
[:en]
Abstract
The purpose of this research was to investigate the effect of manipulating item formats for a revised version of the Technology Acceptance Model (TAM) questionnaire. The TAM has 12 items, six assessing perceived usefulness (PU) and six assessing perceived ease of use (PEU). Its original purpose was to quantify likelihood of technology acceptance, using an item format with end anchors of “Likely” on the left and “Unlikely” on the right, and seven response options (from left to right) of “Extremely, Quite, Slightly, Neither, Slightly, Quite, Extremely.” To revise the TAM to measure user experience (UX), it is necessary to change the items from assessments of likelihood to agreement. In this study, 546 participants rated their experience using IBM Notes with one of four versions of the modified TAM created by crossing two independent variables: Response format (labels or numbers) and Response order (increasing from right-to-left or from left-to-right), with participants about evenly divided among the four formats. A check on ratings of overall experience showed no significant difference as a function of format group, with similar nonsignificant results for the overall TAM scores. An analysis of variance examining the main effects and interaction of the two independent variables (response format and order) on TAM scores was also nonsignificant at similar levels. Factor analyses for each version produced the same alignment of items with the PU and PEU factors, consistent with the item alignment in the original TAM research. Beta weights for regression models predicting likelihood-of-use and overall experience from PU and PEU ratings were very similar for all four versions. The results indicate that the item format differences did not lead to any important differences in the magnitude or structure of TAM measurement, but there were significantly more response errors when the magnitude of agreement increased from right to left.
Keywords
Technology Acceptance Model, TAM, item format
Introduction
Around the same time that usability researchers were producing the first standardized questionnaires to assess perceived usability (Brooke, 1996; Chin, Diehl, & Norman, 1988; Kirakowski & Dillon, 1988; Lewis, 1990), market researchers who studied the adoption of information systems were addressing similar issues. Of these, one of the most influential has been the Technology Acceptance Model (TAM; Davis, 1989). According to the TAM, the primary factors that affect the intention to use a technology are its perceived usefulness (PU) and perceived ease of use (PEU). This model addressed early criticism of focusing only on usability without consideration of whether the product or system was useful (Pearson & Bailey, 1980). A number of studies support the validity of the TAM and its satisfactory explanation of end-user system usage (Wu, Chen, & Lin, 2007). In the TAM, PU is the extent to which a person believes a technology will enhance job performance, and PEU is the extent to which a person believes that using the technology will be effortless.
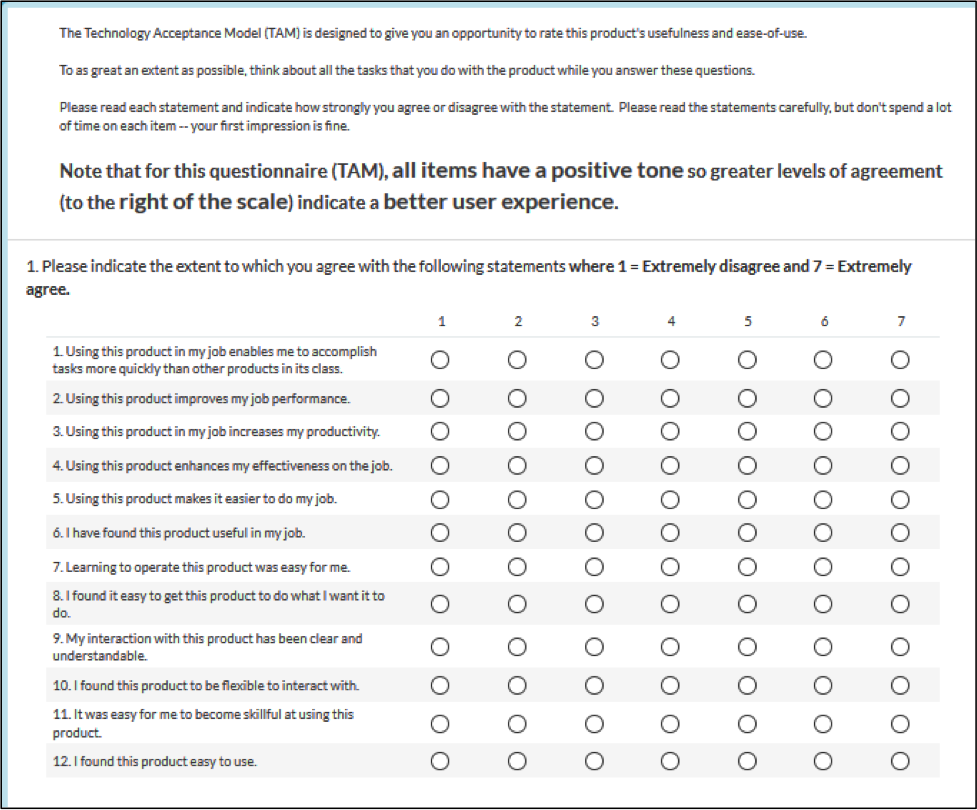
The TAM questionnaire is made up of 12 items, six for the measurement of PU and six for PEU, as shown in Figure 1. Note that the TAM items elicit likelihood ratings rather than agreement ratings because the purpose of the model was to predict future use of a product rather than rating the experience of its actual use. Also, because the conceptual definition of PU was on the enhancement of job performance, most of the associated items directly reference a work context.
TAM development started with the creation of 14 items each for PU and PEU based on their conceptual definitions. Initial factor analytic study of ratings with those items led to two changes. First, having mixed positive and negative tone items led to unintended factor structure that followed item tone rather than the intended constructs, a finding consistent with research in standardized usability questionnaires (Lewis & Sauro, 2017; Sauro & Lewis, 2011). Second, item analysis led to the selection of the six items per construct as shown in Figure 1.
Davis (1989) conducted a lab study in which 40 participants evaluated (in counterbalanced order) two graphics applications with different user interfaces. The PU and PEU subscales had high reliability, and multitrait-multimethod analyses indicated appropriate convergent and divergent validity. Factor analysis of the data showed the expected pattern of association of items with factors. Both PU and PEU correlated significantly with self-predictions of likelihood of use if the product were available at the participants’ place of work (respectively, r = 0.85 and 0.59, both p < 0.001).
Modifying TAM for User Experience Research
An outstanding research question is the extent to which measures of perceived usability relate to the components of the TAM. To conduct this research, however, it would be necessary to modify the TAM to collect experiential ratings rather than ratings of likelihood of use. For use in a battery of experiential ratings, it would also be advantageous for the item formats to be similar to those used in other measures of perceived usability, such as the SUS (Brooke, 1996) or UMUX-LITE (Lewis, Utesch, & Maher, 2013, 2015).
As shown in Figure 1, the original TAM format has end anchors of “Likely” on the left and “Unlikely” on the right, and seven response options (from left to right) of “Extremely, Quite, Slightly, Neither, Slightly, Quite, Extremely.” There are two ways in which the format of the original TAM differs from the SUS/UMUX-LITE item format. First, it is typical to arrange the response options so lower levels of agreement are on the left and higher on the right. Second, it is more common to label response options with numbers than a full set of verbal levels.
Research results from the literature are mixed with regard to the use of numeric or verbal labels for response options (Hjermstad et al., 2011; Moors, Kieruj, & Vermunt, 2014; van Beuningen, van der Houwen, & Moonen, 2014). Previous research in manipulations of questionnaires designed to measure perceived usability have shown no important difference as a function of item tone (mixed positive and negative vs. only positive; Sauro & Lewis, 2011), number of response options (Lewis & Erdinç, 2017), or agreement vs. item-specific endpoints (Lewis, in press). Despite this history of UX questionnaires’ resistance to the influence of minor differences in item formats, it is important to investigate how different adaptations of the TAM might differ in their measurement properties.
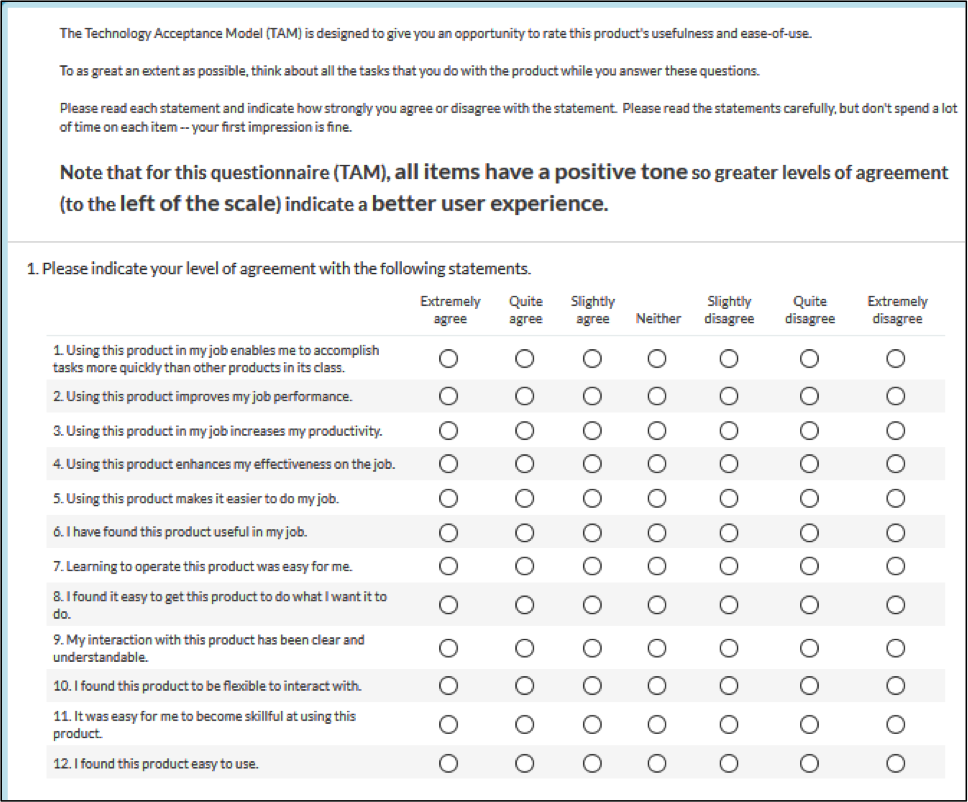
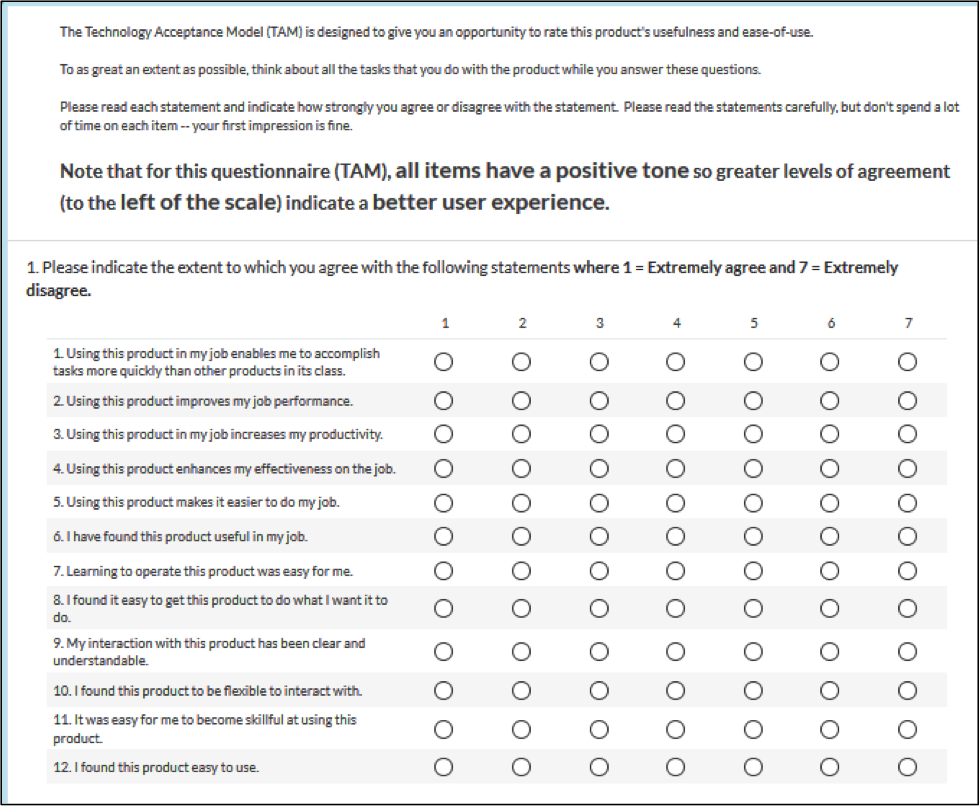
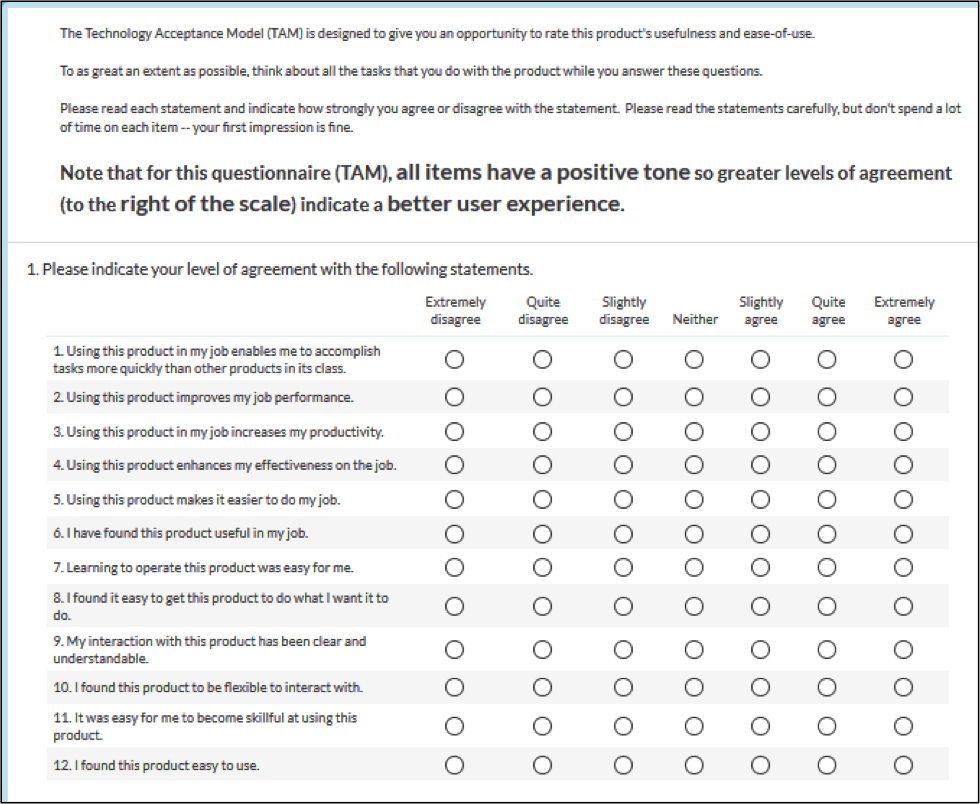
The Appendix shows four versions of the TAM, adapted for UX measurement. Version 1 is the most similar to the original TAM, with verbal labels for each response option and options arranged from right to left in order of increasing agreement. Version 2 is the same as Version 1, except with numbers in place of verbal labels for the response options and end anchors matching the verbal labels (“Extremely disagree” and “Extremely agree”). Version 3 is the same as Version 1, but with options arranged from left to right in order of increasing agreement. Version 4 is the same as Version 2, but with options arranged from left to right in order of increasing agreement.
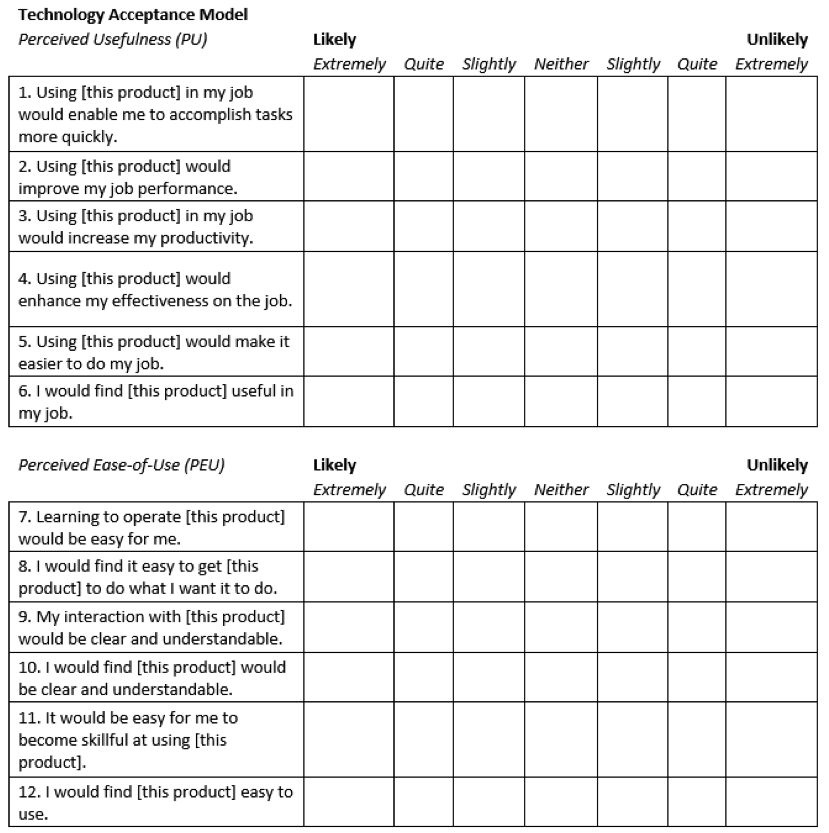
Figure 1. The Technology Acceptance Model (Davis, 1989).
Research Goals
The major goals of this study were to investigate the following:
- differences in magnitude of ratings as a function of item format variation (response labels and order) in a revised version of the TAM
- differences in alignment of items with hypothesized TAM components (PU, PEU) as a function of variation in item formats
- differences in prediction of ratings of overall experience and likelihood-to-recommend (LTR) for the four versions of the TAM
Method
The key elements of the method for this study were the survey, the participants, and the scoring method.
The Survey
Participants in this study completed a survey (Survey Gizmo, www.surveygizmo.com) based on the one used in a previous study by Lewis (2018a) in which they rated their experience using IBM Notes. The instructions to participants were the following:
Thank you for agreeing to participate in this evaluation. It should take about 5-10 minutes to complete this survey. In this survey you’ll use three standardized usability questionnaires to rate your experience using this product (over whatever period of time you have used it). Full disclosure — I am in no position to help with problems you might be having with your system — you’ll need to work with your management and IBM service to resolve anything like that. My primary goal is for you to use these standardized questionnaires to rate your experience with this product.
Please keep in mind that you are participating in a usability evaluation. This is not a test of you — you are helping us to understand your experience with this product. Please try to answer all the items in the questionnaires, but don’t spend a lot of time on an item — your first impression is fine.
The items will differ in whether a low number or a high number indicates a good or poor user experience, so please read each item carefully.
There were four versions of the survey that differed in the version of the TAM presented to participants. Because previous research using these questionnaires found no effect of their order of presentation (Lewis, 2018a, 2018b), all surveys presented three questionnaires in the same order: TAM/SUS/UMUX. After random assignment to a TAM version, participants completed the three usability questionnaires and a section that included overall assessment items (overall experience and likelihood to recommend using 0–10-point scales), system questions (type of hardware, operating system, and applications used) and usage characteristics (length of time using the rated product and the frequency of product use). In accordance with the rules established by their developers, missing data in the SUS and UMUX were replaced with the center item of the rating scale (3 for the SUS, 4 for the UMUX). For consistency, this rule was also followed for the TAM (missing data replaced with center scale value of 4). The focus of this report is on differences among the four versions of the TAM. All statistical analyses used SPSS Version 25.
The Participants
Participants were members of the IBM User Experience panel. In early 2017, the initial panel was formed by emailing invitations to 20,000 randomly selected IBM U.S. employees of whom about 10% agreed to join the panel. At the time of this study there were 2,155 members in the panel. As a check on data quality, cases in which participants had more than a 50-point difference among the SUS, UMUX, or TAM scores (after translation to a common 0–100-point scale) were removed based on the likelihood that those participants had made rating errors due to the different questionnaire formats. The total number of participants who completed the survey was 568, with 38 having one or two missing responses replaced as described above. Twenty-two cases were deleted as a result of the data quality check, leaving 546 for inclusion in the analyses.
Scoring TAM
To provide TAM scores that are consistent with SUS and UMUX-related metrics, the following formulas were used to put PU and PEU on a 0–100-point scale, averaging PU and PEU to get the overall TAM.
- PU = (AVERAGE(TAM01, TAM02, TAM03, TAM04, TAM05, TAM06) – 1)(100/6)
- PEU = (AVERAGE(TAM07, TAM08, TAM09, TAM10, TAM11, TAM12) – 1)(100/6)
Results
The results of this study include analysis of mean differences, factor analyses, regression analyses, and analysis of response errors.
Mean Differences
Before assessing the effect of the different TAM versions, the groups were checked for their ratings of overall experience to ensure at least rough group equality. The resulting one-way analysis of variance (ANOVA) showed no significant difference as a function of TAM version, F(1, 3) = 0.13, p = 0.94; with a mean range of just 0.23 (2.3% on the 0–10-point scale). Thus, there was no unexpected large random difference in overall experience among the four groups of participants.
The results were similar for the overall TAM scores, with no significant main effect of version in a one-way ANOVA, F(3, 542) = 0.09, p = 0.97; mean range of 1.73 points on the 0–100-point scale.
The factorial design of the study allowed analysis of the separate main effects of response format (verbal vs. numeric) and order of increasing agreement (left-to-right or right-to-left) and their interactions with each other and with TAM components in a mixed-design ANOVA with two between-subjects variables (response format and order) and one within-subjects variable (TAM component; Myers, 1979). As shown in Table 1, the only significant effect was the difference between the PU and PEU means, F(1, 542) = 10.6, p = 0.001; mean difference of 2.36.
Table 1. Mixed-Design ANOVA: Response Format by Option Order by TAM Component
|
Source |
Sum of squares |
df |
Mean square |
F |
p |
|
Between subjects |
|
546 |
|
|
|
|
Intercept |
3436895.464 |
1 |
|
|
|
|
Response format (verbal/numeric) |
3.016 |
1 |
3.016 |
0.002 |
0.966 |
|
Response order (R-L/L-R) |
264.117 |
1 |
264.117 |
0.158 |
0.691 |
|
Format x order |
150.240 |
1 |
150.240 |
0.090 |
0.764 |
|
Error between |
904535.078 |
542 |
1668.884 |
|
|
|
Within subjects |
|
546 |
|
|
|
|
TAM component (PU/PEU) |
1512.779 |
1 |
1512.779 |
10.630 |
0.001 |
|
Component x response format |
216.460 |
1 |
216.460 |
1.521 |
0.218 |
|
Component x response order |
0.189 |
1 |
0.189 |
0.001 |
0.971 |
|
Component x format x order |
242.578 |
1 |
242.578 |
1.705 |
0.192 |
|
Error within |
77134.799 |
542 |
142.315 |
|
|
Factor Analyses
Table 2 shows the results of factor analyses (unweighted least squares, two-factor solutions, varimax rotation) of the TAM ratings for each version. With regard to the alignment of items with factors, all four versions had the expected structure with the six PU items (1–6) aligning on one factor and the six PEU items (7–12) aligning on the other.
Table 2. Factor Analyses of the Four Versions of the Modified TAM
|
|
Version 1 verbal/R-L |
Version 2 numeric/R-L |
Version 3 verbal/L-R |
Version 4 numeric/L-R |
||||
|
Item |
Factor 1 |
Factor 2 |
Factor 1 |
Factor 2 |
Factor 1 |
Factor 2 |
Factor 1 |
Factor 2 |
|
1 (PU) |
0.770 |
0.517 |
0.758 |
0.518 |
0.777 |
0.452 |
0.818 |
0.456 |
|
2 (PU) |
0.835 |
0.499 |
0.863 |
0.432 |
0.870 |
0.424 |
0.877 |
0.451 |
|
3 (PU) |
0.882 |
0.434 |
0.882 |
0.446 |
0.872 |
0.436 |
0.893 |
0.429 |
|
4 (PU) |
0.877 |
0.441 |
0.891 |
0.414 |
0.849 |
0.476 |
0.894 |
0.416 |
|
5 (PU) |
0.837 |
0.479 |
0.866 |
0.452 |
0.835 |
0.480 |
0.856 |
0.456 |
|
6 (PU) |
0.776 |
0.475 |
0.782 |
0.405 |
0.702 |
0.533 |
0.708 |
0.575 |
|
7 (PEU) |
0.423 |
0.788 |
0.336 |
0.867 |
0.385 |
0.840 |
0.347 |
0.831 |
|
8 (PEU) |
0.521 |
0.791 |
0.546 |
0.771 |
0.452 |
0.834 |
0.477 |
0.817 |
|
9 (PEU) |
0.419 |
0.821 |
0.527 |
0.773 |
0.513 |
0.817 |
0.428 |
0.832 |
|
10 (PEU) |
0.499 |
0.772 |
0.564 |
0.715 |
0.619 |
0.655 |
0.560 |
0.676 |
|
11 (PEU) |
0.419 |
0.841 |
0.353 |
0.830 |
0.423 |
0.798 |
0.421 |
0.838 |
|
12 (PEU) |
0.494 |
0.819 |
0.496 |
0.811 |
0.524 |
0.811 |
0.479 |
0.822 |
Regression Analyses: Predicting LTR and Overall Experience
Table 3 shows the coefficients of determination and beta weights (with 95% confidence intervals) for each of the four versions from regression models of the prediction of LTR and overall experience from PU and PEU. The coefficient of determination indicates the percentage of variation in the dependent variable that is accounted for by the independent variables, so larger values indicate a stronger model. Beta weights are standardized regression coefficients for which larger values indicate stronger effects.
Table 3. Regression Analyses
|
Predicting |
Version |
R2adj |
Beta PU (95% CI) |
Beta PEU (95% CI) |
|
LTR |
1 |
86% |
0.634 (0.517-0.763) |
0.327 (0.209-0.458) |
|
|
2 |
73% |
0.323 (0.154-0.476) |
0.568 (0.398-0.723) |
|
|
3 |
83% |
0.455 (0.328-0.603) |
0.491 (0.346-0.608) |
|
|
4 |
85% |
0.507 (0.383-0.619) |
0.456 (0.342-0.585) |
|
Overall experience |
1 |
90% |
0.567 (0.460-0.668) |
0.418 (0.315-0.525) |
|
|
2 |
82% |
0.417 (0.272-0.530) |
0.527 (0.381-0.642) |
|
|
3 |
89% |
0.602 (0.505-0.725) |
0.376 (0.262-0.472) |
|
|
4 |
90% |
0.544 (0.455-0.653) |
0.447 (0.365-0.589) |
All regressions were statistically significant (p < 0.0001), with coefficients of determination ranging from 73 to 90%. All beta weights were also statistically significant (p < 0.0001). For six of the eight models, there was no significant difference in the beta weights for PU and PEU. For Version 1 predicting LTR, the beta weight for PU was significantly larger than the weight for PEU (p < 0.05, 95% confidence interval for PU ranged from 0.517–0.763, for PEU ranged from 0.209–0.458). For Version 3 predicting overall experience, the beta weight for PU was significantly larger than the weight for PEU (p < 0.05, 95% confidence interval for PU ranged from 0.505–0.725, for PEU ranged from 0.262–0.472). For comparisons across versions and dependent variables, the only combination for which confidence intervals failed to overlap for highest and lowest values of the beta weights was for PU when predicting LTR, indicating a considerable amount of consistency across versions with regard to the strengths of the relationships between PU and PEU with LTR and overall experience.
Response Errors
The overall rate of response errors was fairly low (22/568 = 3.9%, 95% adjusted-Wald binomial confidence interval ranging from 2.5–5.8%). Of the 22 cases that were removed prior to analysis due to a difference greater than 50 points between the TAM, SUS, and UMUX-LITE scores, however, 21 were from a TAM version in which the magnitude of agreement increased from right to left (12 from Version 1 and 9 from Version 2). Thus, the response error rate for the right-to-left item format was 7.3% (21/289, 95% adjusted-Wald binomial confidence interval from 4.8–10.9%) and for the left-to-right format was 0.4% (1/281, 95% adjusted Wald binomial confidence interval from 0–2.2%), a statistically significant difference, N-1 C2(1) = 18.3, p < 0.0001. (See Sauro & Lewis, 2016 for a description of the N-1 C2 test).
Discussion
The purpose of this research was to investigate the effect of manipulating item formats for a revised version of the 12-item Technology Acceptance Model (TAM) questionnaire, modified for use as a measure of UX. Its original purpose was to assess likelihood of technology acceptance, using an item format with end anchors of “Likely” on the left and “Unlikely” on the right, and seven response options (from left to right) of “Extremely, Quite, Slightly, Neither, Slightly, Quite, Extremely.”
To accomplish this goal, it was necessary to change the items from assessments of likelihood to agreement. The design of this study also enabled the assessment of two other aspects of item formats:
- using verbal labels for each response option similar to the original TAM or numbering the response options from 1 to 7
- arranging the response options so the order of increasing magnitude of agreement was from right to left (as in the original TAM) or the more typical left to right format
In this study, 546 participants rated their experience using IBM Notes with one of four versions of the modified TAM created by crossing two independent variables: Response format (labels or numbers) and Response order (increasing from right-to-left or from left-to-right), with participants about evenly divided among the four formats.
A check on ratings of overall experience showed no significant difference as a function of format group, with similar nonsignificant results for the overall TAM scores. An analysis of variance examining the main effects and interaction of the two independent variables (response format and order) on TAM scores was also nonsignificant at similar levels. Factor analyses for each version produced the same alignment of items with the PU and PEU factors, consistent with the item alignment in the original TAM research. Beta weights for regression models predicting likelihood-of-use and overall experience from PU and PEU ratings were very similar for all four versions. Analysis of the frequency of response errors revealed a significantly greater error rate for Versions 1 and 2, which had the magnitude of increasing agreement ordered from right to left.
In general, all four versions worked reasonably well for the purpose of providing a TAM-like UX measurement that includes assessment of perceived usefulness and perceived usability (ease of use). Considering the increased response error rate for Versions 1 and 2 and the greater use of numeric labels for response options in UX research (Sauro & Lewis, 2016), Version 4 would be the best choice for most user research.
Recommendations for Future Research
One study never settles an issue, so there is always value in replication. The limits to generalization in this study include the population of respondents (IBM U.S. employees), ratings of a single product, and data collection of retrospective ratings in a survey rather than data collection during a task-based usability study.
Conclusion
The results indicate that the item format differences did not lead to any important differences in the magnitude or structure of the TAM measurement, but there were significantly more response errors when the magnitude of agreement increased from right to left.Version 4, with numeric response options arranged with magnitude of agreement increasing from left to right appears to be the best choice for future research given its similarity to other popular measures of perceived usability like the SUS and UMUX-LITE.
Tips for Practitioners
The findings of this study support the following tips:
- If you want to use the TAM to assess UX, unless there is a compelling reason to do otherwise, use Version 4 (as shown in the Appendix).
- When creating your own custom items, arrange response options from left to right in order of increasing strength of agreement, and avoid the right to left arrangement.
- Do not get dragged into lengthy debates about whether to use numbers or verbal labels for response options—they both work—but for consistency with other major standardized usability questionnaires, I recommend using numbers.
Acknowledgements
Many thanks to the members of the IBM UX Panel who participated in this study.
References
Brooke, J. (1996). SUS: A “quick and dirty” usability scale. In P. Jordan, B. Thomas, & B. Weerdmeester (Eds.), Usability Evaluation in Industry (pp. 189–194). London, UK: Taylor & Francis.
Chin, J. P., Diehl, V. A., & Norman, K. L. (1988). Development of an instrument measuring user satisfaction of the human–computer interface. In E. Soloway, D. Frye, & S. B. Sheppard (Eds.), Proceedings of CHI 1988 (pp. 213–218). Washington, DC: Association for Computing Machinery.
Davis, D. (1989). Perceived usefulness, perceived ease of use, and user acceptance of information technology. MIS Quarterly, 13, 319–339.
Hjermstad, M. J., Fayers, P. M., Haugen, D. F., Caraceni, A., Hanks, G. W., Loge, J. H., Fainsinger, R., Aass, N., & Kaasa, S. (2011). Studies comparing numerical rating scales, verbal rating scales, and visual analogue scales for assessment of pain intensity in adults: A systematic literature review. Journal of Pain and Symptom Management, 41(6), 1073–1093.
Kirakowski, J., & Dillon, A. (1988). The Computer User Satisfaction Inventory (CUSI): Manual and scoring key. Human Factors Research Group, University College of Cork, Cork, Ireland.
Lewis, J. R. (1990). Psychometric evaluation of a post-study system usability questionnaire: The PSSUQ (Tech. Report 54.535). Boca Raton, FL: International Business Machines Corp.
Lewis, J. R. (2018a). Measuring perceived usability: The CSUQ, SUS, and UMUX. International Journal of Human-Computer Interaction, 34(12), 1148–1156. DOI: https://doi.org/10.1080/10447318.2017.1418805
Lewis, J. R. (2018b). Measuring perceived usability: SUS, UMUX, and CSUQ ratings for four everyday products (IBM Tech. Report BCR-UX-2018-0003). Boca Raton, FL: IBM Corp.
Lewis, J. R. (In press). Comparison of item formats: Agreement vs. item-specific endpoints. To appear in Journal of Usability Studies.
Lewis, J. R., & Erdinç, O. (2017). User experience rating scales with 7, 11, or 101 points: Does it matter? Journal of Usability Studies, 12(2), 73–91.
Lewis, J. R., & Sauro, J. (2017). Revisiting the factor structure of the System Usability Scale. Journal of Usability Studies, 12(4), 183–192.
Lewis, J. R., Utesch, B. S., & Maher, D. E. (2013). UMUX-LITE—When there’s no time for the SUS. In Proceedings of CHI 2013 (pp. 2099–2102). Paris, France: Association for Computing Machinery.
Lewis, J. R., Utesch, B. S., & Maher, D. E. (2015). Measuring perceived usability: The SUS, UMUX-LITE, and AltUsability. International Journal of Human-Computer Interaction, 31(8), 496–505.
Moors, G., Kieruj, N. D., & Vermunt, J. K. (2014). The effect of labeling and numbering of response scales on the likelihood of response bias. Sociological Methodology, 44(1), 369–399.
Myers, J. L. (1979). Fundamentals of experimental design (3rd ed.). Boston, MA: Allyn and Bacon.
Pearson, S. W., & Bailey, J. E. (1980). Measurement of computer user satisfaction. ACM SIGMETRICS Performance Evaluation Review, 9(1), 59–68.
Sauro, J., & Lewis, J. R. (2011). When designing usability questionnaires, does it hurt to be positive? In Proceedings of CHI 2011 (pp. 2215–2223). Vancouver, Canada: ACM.
Sauro, J., & Lewis, J. R. (2016). Quantifying the user experience: Practical statistics for user research (2nd ed.). Cambridge, MA: Morgan Kaufmann.
van Beuningen, J., van der Houwen, K., & Moonen, L. (2014). Measuring well-being: An analysis of different response scales (Discussion Paper 2014 03). The Hague: Statistics Netherlands.
Wu, J., Chen, Y., & Lin, L. (2007). Empirical evaluation of the revised end user computing acceptance model. Computers in Human Behavior, 23, 162–174.
Appendix: The Four Versions of the TAM
The following gives examples of each version of the TAM.
Version 1: Verbal Labels, Right-to-Left
Version 1 is the most similar to the original TAM, with verbal labels for each response option and options arranged from right to left in order of increasing agreement.
Version 2: Numeric Labels, Right-to-Left
Version 2 is the same as Version 1, except with numbers in place of verbal labels for the response options and end anchors matching the verbal labels (“Extremely disagree” and “Extremely agree”).
Version 3: Verbal Labels, Left-to-Right
Version 3 is the same as Version 1, but with options arranged from left to right in order of increasing agreement.
Version 4: Numeric Labels, Left-to-Right
Version 4 is the same as Version 2, but with options arranged from left to right in order of increasing agreement.
[:]