
Abstract
The current study was an investigation of the extent to which items constructed with an agreement format were affected by acquiescence bias relative to responses to a matched set of items designed with item-specific formats. If an acquiescence bias existed, the expectation was that the magnitude of responses to agreement items would be consistently greater than those to the matched item-specific versions. Two hundred respondents completed a survey in which they described and rated a recent interaction with an auto insurance website. Half of the respondents provided ratings using items with an agreement format (Version 1 of the survey), and the other half provided ratings on items matched for content but with item-specific endpoint anchors rather than generic disagree/agree endpoints (Version 2 of the survey). The two groups of respondents were matched on their ratings of overall experience, which was the same for both groups. Of 14 comparisons of matched agreement and item-specific formats, 12 (86%) were not statistically significant. For the other two items, the means of the agreement versions were significantly lower than those for the item-specific versions (p < 0.05), which is the opposite of the expected result if agreement items were affected by an acquiescence bias. Thus, despite published concerns about the potential effect of acquiescence bias on responses to items using an agreement format, the results of this study found no evidence for such bias, at least in the context of user experience research. Both agreement and item-specific formats appeared to work equally well.
Keywords
Likert, agreement, item-specific, endpoint, anchor
Introduction
It is common in user experience (UX) research to include questionnaire items with an agreement format (statements with which respondents indicate a level of agreement). This includes commonly-used standardized usability questionnaires like the System Usability Scale (SUS; Brooke, 1996) and the Computer System Usability Questionnaire (CSUQ; Lewis, 1995). A potential weakness of agreement items is the extent to which they may be affected by acquiescence bias—the purported tendency of respondents to be more agreeable than they would otherwise be when providing ratings (Billiet & McClendon, 1998). An alternative approach to constructing items is to use item-specific rating scales (Menold & Bogner, 2016). For example, consider the items shown in Table 1, which contains agreement items used in Lewis, Utesch, and Maher (2015) and content-matched item-specific items created for this study.
Table 1. Eleven Agreement and Item-Specific Items with Matched Content
| Label | Agreement | Item-specific |
| UMUXLITE01 | This website’s capabilities meet my requirements <Strongly disagree – Strongly agree>. | This website’s capabilities <never meet my requirements – always meet my requirements>. |
| UMUXLITE02 | This website is easy to use <Strongly disagree – Strongly agree>. | This website was <very difficult to use – very easy to use>. |
| Navigate | This website is easy to navigate <Strongly disagree – Strongly agree>. | This website was <very difficult to navigate – very easy to navigate>. |
| FindNeed | It’s easy to find what I need in this website <Strongly disagree – Strongly agree>. | Finding what I need in this website is <very difficult – very easy>. |
| Familiar | This website’s capabilities are familiar to me <Strongly disagree – Strongly agree>. | This website’s capabilities are <not at all familiar to me – very familiar to me>. |
| DoesNeed | This website does what I need it to do <Strongly disagree – Strongly agree>. | This website <never does what I need it to do – always does what I need it to do>. |
| Efficient | This website helps me do tasks efficiently <Strongly disagree – Strongly agree>. | This website <never helps me do tasks efficiently – always helps me do tasks efficiently>. |
| InControl | I feel in control when I work with this website <Strongly disagree – Strongly agree>. | When I work with this website, I <never feel in control – always feel in control>. |
| Appeal | This website is visually appealing <Strongly disagree – Strongly agree>. | The visual appeal of this website is <very poor – very good>. |
| Reliable | This website is very reliable <Strongly disagree – Strongly agree>. | This website is <very unreliable – very reliable>. |
| Responsive | This website responds quickly when I use it <Strongly disagree – Strongly agree>. | When I use it, this website <responds very slowly – responds very quickly>. |
Lewis, Utesch, and Maher (2015) used the agreement format of these items in an exploration of the construct of perceived usability. The items in the Item-specific column of the table have content matched to the agreement versions, but with item-specific rather than generic agreement endpoints. In their review of rating scale designs, Menold and Bogner (2016) concluded, “Empirical findings suggest that it is better to use item-specific scales and to avoid agree/disagree scales as they elicit higher rates of agreement than item-specific ratings scales” (p. 8). But is this necessarily the case in the context of user experience research?
Another characteristic of questionnaire design that has been associated with acquiescence bias is item tone. To control the potential effect of acquiescence bias, the prevailing practice is to mix item tone so half of the items have a positive tone and the other half a negative tone. As written in the following quotation from Travis (2008):
There are many issues to consider when designing a good questionnaire, and few usability questionnaires are up to scratch. For example, we’ve known for over 60 years that you need to avoid the “acquiescence bias”: the fact that people are more likely to agree with a statement than disagree with it (Cronbach, 1946). This means that you need to balance positively-phrased statements (such as “I found this interface easy to use”) with negative ones (such as “I found this interface difficult to navigate”). So it’s surprising that two commonly used questionnaires in the field of usability—the Usefulness, Satisfaction, and Ease-of-Use (USE) questionnaire and the Computer System Usability Questionnaire (CSUQ)—suffer from just this problem: every question in both of these questionnaires is positively phrased, which means the results from them are biased towards positive responding. (p. 1)
On the other hand, Nunnally (1978) reviewed various types of response styles, including acquiescence, and concluded “the overwhelming weight of the evidence now points to the fact that the agreement tendency is of very little importance either as a measure of personality or as a source of systematic invalidity in measures of personality and sentiments” (p. 669).
To put this controversy to the test in the context of user experience research, Sauro and Lewis (2011) took a standardized questionnaire that used mixed tone, the SUS, and created an all-positive version. Using data from 213 Amazon Mechanical Turk users who completed two representative tasks on a website, they found no evidence of an acquiescence bias.
The goal of the current research was to see if there were systematic differences in the means of user experience ratings collected using agreement versus item-specific formats, specifically, using the balanced items shown in Table 1 (see Appendix A to review the items as they were presented to respondents, especially the two versions of Page 3 of the survey).
Method
To compare the formats, survey respondents were invited to describe and rate recent experiences using auto insurance websites.
The Surveys
Two versions of a SurveyGizmo survey were constructed to collect data regarding respondents’ recent interactions with auto insurance websites. The surveys differed only in their presentations of the user experience items in Table 1 (see the two versions of Page 3 in Appendix A). The general structure of the survey was the following:
- Page 1: Introduction and check for interaction with auto insurance website in the past three months
- Page 2: Capture information about the respondents’ recent experience and obtain ratings of overall experience and likelihood-to-recommend (LTR)
- Page 3: Collect ratings of the items in Table 1 (agreement format for Version 1, item-specific format for Version 2)
- Page 4: Thank the respondents for participating in the survey
Note that the ratings of overall experience and LTR used the same formats in both versions, and in both versions appeared on the page before the presentation of the items listed in Table 1.
The IBM User Experience Panel
Respondents were members of the IBM User Experience panel. In early 2017 invitations were emailed to 20,000 randomly selected IBM employees (US only), inviting them to join the panel. As members of the panel, they would receive links to participate in short UX studies in their spare time. At the time of this study, the panel had 2,000 members, of which 248 (24.8%) completed the survey.
Computing Higher-Level Metrics from the Items
In addition to analysis at the item level, the items selected for this study could be used to compute three composite higher-level metrics. The first two items, UMUXLITE01 and UMUXLITE02 are the items used to compute the UMUX-LITE and the UMUX-LITEr (Berkman & Karahoca, 2016; Lewis, Utesch, & Maher, 2013). In particular, research on the UMUX-LITEr has shown it to typically track reasonably closely with concurrently collected SUS means (Borsci, Federici, Gnaldi, Bacci, & Bartolucci, 2015; Lewis, in press; Lewis, Utesch, & Maher, 2015).
The formula for computing the standard UMUX-LITE is UMUXLITE = (UMUXLITE01 + UMUXLITE02 – 2)(100/12). Due to a small but statistically significant difference between the SUS and UMUX-LITE means, Lewis et al. (2013) computed a regression equation to bring the SUS and UMUX-LITE scores into closer correspondence. The formula for this regression-adjusted version is UMUXLITEr = 0.65(UMUXLITE) + 22.9.
Lewis et al. (2015) used a subset of the items in Table 1 to form a metric called AltUsability, which they demonstrated had a high correlation (0.86) with the SUS. The formula, using the labels from Table 1, is AltUsability = (Navigate + FindNeed + Familiar + DoesNeed + Efficient + InControl + Appeal – 7)(100/42), which produces, like the SUS and the UMUX-LITE, scores that can range from 0–100.
The analyses in the next section include these three derived metrics in addition to the individual items from Table 1.
Results
The first step in analyzing the data was to check for correspondence in the two groups’ ratings of overall experience, followed by a series of t-tests of the items in Table 1, including some higher-level metrics derived from those items.
Correspondence in Ratings of Overall Experience
The mean rating of overall experience for Version 1 was 7.3 and for Version 2 was 7.9. This difference just missed being statistically significant, t(246) = 1.87; p = 0.06, and, as Rosnow and Rosenthal (1989) famously said, “Surely, God loves the .06 nearly as much as the .05” (p. 1277).
Due to this unexpected magnitude of difference between the groups of respondents, an additional step was taken to match the survey samples on ratings of overall experience. Specifically, the respondents were assigned random numbers and then ordered first by their rating of overall experience, then by survey version, and then by the random number. Using this random assignment, cases were removed as needed from both versions until each version had equal representation for each rating of overall experience in the data remaining for analysis. There were 100 cases remaining from each version for a total sample size of 200.
Comparing Agreement and Item-Specific Means
Table 2 lists the means, mean differences, and results of independent-groups t-tests conducted to compare those means. The mean difference between the overall experience (OverExp) means was 0, which confirms the effectiveness of the steps taken to match the independent groups on this metric. The mean difference between the groups for LTR, which had the same presentation in both groups, was a nonsignificant -0.16.
Of the 14 comparisons between agreement and item-specific metrics, 12 were not statistically significant, even with 198 df in the comparisons. The observed significance levels (p values) for the nonsignificant comparisons ranged from 0.16 to 0.96. For the individual items, which used 7-point numeric scales with anchored endpoints, the mean differences ranged from -0.30 to +0.05 – less than 1/3 of a scale step. For the derived metrics, which could range from 0 to 100, the mean differences for the UMUX-LITE, UMUX-LITEr, and AltUsability were, respectively, 0.5, 0.32, and -3.88, all of which indicated close correspondence in the composite means and none of which were significantly different.
Table 2. Item and Higher-Level Means, Mean Differences, and t-Tests
| Metric | Agreement | Item-specific | Difference | t | P |
| OverExp | 7.88 | 7.88 | 0.00 | 0.00 | 1.00 |
| LTR | 7.65 | 7.81 | -0.16 | -0.47 | 0.64 |
| UMUXLITE01 | 5.75 | 5.74 | 0.01 | 0.05 | 0.96 |
| UMUXLITE02 | 5.82 | 5.77 | 0.05 | 0.27 | 0.79 |
| Navigate | 5.78 | 5.83 | -0.05 | -0.27 | 0.78 |
| FindNeed | 5.54 | 5.59 | -0.05 | -0.25 | 0.81 |
| Familiar | 5.64 | 5.65 | -0.01 | -0.05 | 0.96 |
| DoesNeed | 5.71 | 5.78 | -0.07 | -0.37 | 0.71 |
| Efficient | 4.75 | 5.61 | -0.86 | -3.97 | 0.00 |
| InControl | 5.16 | 5.45 | -0.29 | -1.37 | 0.17 |
| Appeal | 5.32 | 5.62 | -0.30 | -1.56 | 0.12 |
| Reliable | 5.72 | 6.18 | -0.46 | -2.76 | 0.01 |
| Responsive | 5.84 | 6.00 | -0.16 | -0.94 | 0.35 |
| UMUXLITE | 79.75 | 79.25 | 0.50 | 0.16 | 0.87 |
| UMUXLITEr | 74.74 | 74.41 | 0.32 | 0.16 | 0.87 |
| AltUsability | 73.57 | 77.45 | -3.88 | -1.40 | 0.16 |
Note: Differences in bold were statistically significant (p < 0.05); all df = 198
The two statistically significant differences were those for Efficient and Reliable. For both items, the means of the agreement versions were significantly lower than those for the item-specific versions, which is the opposite of the expected result if agreement items were affected by an acquiescence bias.
Another approach to testing the hypothesis of the existence of an acquiescence bias for the agreement items used in this study would be to conduct a binomial sign test (Sauro & Lewis, 2016) on the difference scores shown in Table 2. If there were an acquiescence bias affecting the magnitude of the ratings of the agreement items, then out of the 14 Agreement minus Item-specific differences shown in Table 2 (from UMUXLITE01 through AltUsability), the expectation is that significantly more than half of them would have a positive sign. The results were, however, that there were only four positive differences, so the test would necessarily have a nonsignificant outcome. To achieve the standard criterion of statistical significance (p < 0.05), there would need to be at least 11/14 positive signs. With 4/14 positive signs the actual probability was 0.97—markedly nonsignificant.
When running a series of t-tests, there is a risk of alpha inflation (Sauro & Lewis, 2016). Table 3 in Appendix B shows the likelihoods of getting significant (p < 0.05) test results in a set of 14 tests under the assumption that there really are no significant differences. As shown in the table, the likelihood of getting two false positives out of 14 tests is 0.15, so these two significant results should be viewed with some caution because it is plausible that they might be false positives.
Discussion
Of 14 comparisons made between metrics using agreement versus item-specific formats, 12 (86%) showed no significant difference. The remaining two differences were statistically significant (p < 0.05), but in the opposite direction of the expected result if it were true that agreement items are more likely than item-specific to induce an acquiescence bias. Thus, it appears, at least in the context of user experience research and for these types of items, that researchers can use either format without fear of the influence of acquiescence.
An advantage of using agreement items is that they are more compact in their presentation and, due to using consistent endpoint anchoring rather than item-specific, may be easier for participants to complete (e.g., see the amount of space required by the two formats as shown in Appendix A on the third page of the survey). Also, there are times when it might be easy to express an attribute using the agreement format but would not be easy to write using an item-specific format.
Several years ago, Caroline Jarrett taught a tutorial about the many design characteristics of Web forms that people argue about but which, ultimately, have no effect on user performance or preference (see Jarrett & Gaffney, 2009). She mentioned having been in meetings that carried on for hours while these unimportant design issues were debated. Hopefully, this research will help user experience researchers avoid an endless debate about whether it is or is not good practice to use agreement items, either independently or in Likert-type scales such as the CSUQ and SUS. From a measurement perspective, just like prior research on the number of response options from seven to 101 (Lewis & Erdinç, 2017) or use of all-positive rather than balanced negative/positive items in standardized usability questionnaires (Sauro & Lewis, 2011), it doesn’t seem to matter much, if at all.
Recommendations for Future Research
One study never settles an issue, so there is always value in replication. The limits to generalization in this study include the population of respondents (IBM US employees), the specific items used in this study, and data collection of retrospective ratings in a survey rather than data collection during a task-based usability study. User experience researchers who are planning reasonably large-sample studies (either surveys or usability studies) should consider splitting their samples into groups who complete agreement versus balanced item-specific versions of their rating items, then publish the results of those comparisons.
Conclusion
Despite published concerns about the potential effect of acquiescence bias on responses to items using an agreement format, the results of this study found no evidence for such bias, at least in the context of user experience research. Both agreement and item-specific formats appeared to work equally well.
Tips for Practitioners
Use the following tips when selecting questionnaire formats for a study:
- If you’re starting a new project, consider using the agreement format due to its more concise presentation, consistency of presentation, and familiarity to respondents.
- If you have been using a particular format, continue using that format unless there is a compelling reason to change.
- Do not get dragged into lengthy debates about whether to use agreement or item-specific formats—they both work.
Acknowledgements
Many thanks to the members of the IBM UX Panel who participated in this study.
References
Berkman, M. I., & Karahoca, D. (2016). Re-assessing the Usability Metric for User Experience (UMUX) scale. Journal of Usability Studies, 11(3), 89–109.
Billiet, J. B., & McClendon, M. J. (1998). On the identification of acquiescence in balanced sets of items using structural models. Advances in Methodology, Data Analysis, and Statistics, 14, 129–150.
Borsci, S., Federici, S., Gnaldi, M., Bacci, S., & Bartolucci, F. (2015). Assessing user satisfaction in the era of user experience: An exploratory analysis of SUS, UMUX and UMUX-LITE. International Journal of Human-Computer Interaction. 31, 484–495.
Brooke, J. (1996). SUS: A “quick and dirty” usability scale. In P. Jordan, B. Thomas, & B. Weerdmeester (Eds.), Usability evaluation in industry (pp. 189-194). London, UK: Taylor & Francis.
Cronbach, L. J. (1946). Response sets and test validity. Educational and Psychological Measurement, 6, 475–494.
Jarrett, C., & Gaffney, G. (2009). Forms that work: Designing Web forms for usability. Burlington, MA: Morgan Kaufmann.
Lewis, J. R. (1995). IBM computer usability satisfaction questionnaires: Psychometric evaluation and instructions for use. International Journal of Human-Computer Interaction, 7(1), 57–78.
Lewis, J. R. (In press). Measuring perceived usability: The CSUQ, SUS, and UMUX. To appear in the International Journal of Human-Computer Interaction.
Lewis, J. R., & Erdinç, O. (2017). User experience rating scales with 7, 11, of 101 points: Does it matter? Journal of Usability Studies, 12(2), 73–91.
Lewis, J. R., Utesch, B. S., & Maher, D. E. (2013). UMUX-LITE—When there’s no time for the SUS. In Proceedings of CHI 2013 (pp. 2099–2102). Paris, France: Association for Computing Machinery.
Lewis, J. R., Utesch, B. S., & Maher, D. E. (2015). Measuring perceived usability: The SUS, UMUX-LITE, and AltUsability. International Journal of Human-Computer Interaction, 31(8), 496–505.
Menold, N., & Bogner, K. (2016). Design of ratings scales in questionnaires. GESIS Survey Guidelines, Mannheim, Germany: GESIS – Leibniz Institute for the Social Sciences, doi 10.15465/gesis-sg_en_015.
Nunnally, J. C. (1978). Psychometric theory. New York: McGraw-Hill.
Rosnow, R. L., & Rosenthal, R. (1989). Statistical procedures and the justification of knowledge in psychological science. American Psychologist, 44, 1276–1284.
Sauro, J., & Lewis, J. R. (2011). When designing usability questionnaires, does it hurt to be positive? In Proceedings of CHI 2011 (pp. 2215–2223). Vancouver, BC: ACM.
Sauro, J., & Lewis, J. R. (2016). Quantifying the user experience: Practical statistics for user research (2nd ed.). Cambridge, MA: Morgan Kaufmann.
Travis, D. (2008). Measuring satisfaction: Beyond the usability questionnaire. Available from www.userfocus.co.uk/articles/satisfaction.html
Appendix A. The SurveyGizmo Surveys
PAGE 1 (BOTH VERSIONS)
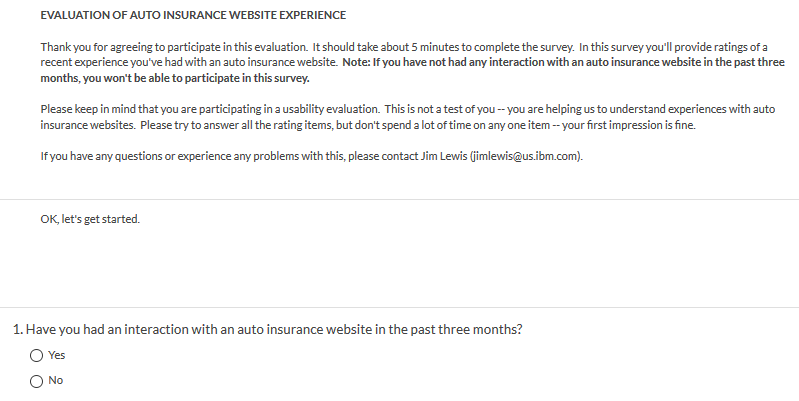
If No, the survey ended.
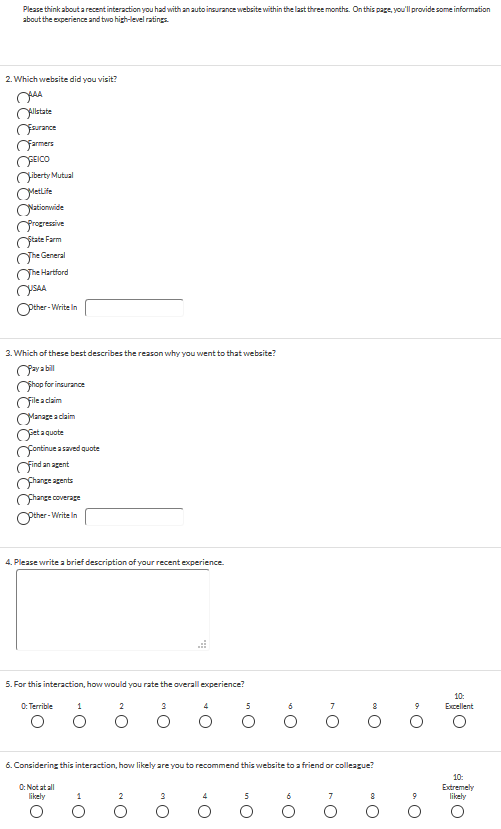
PAGE 2 (BOTH VERSIONS)
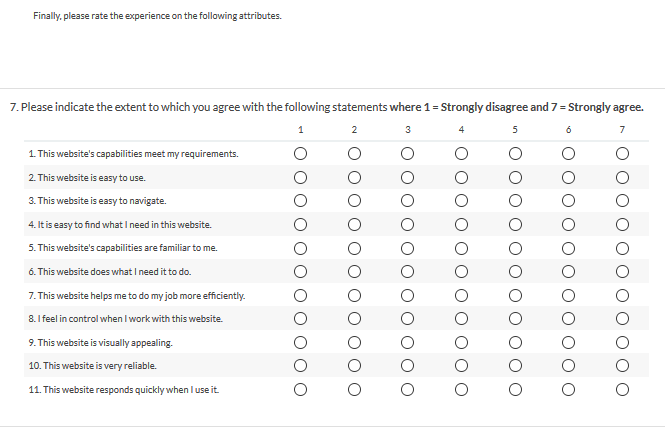
PAGE 3 (VERSION 1 – AGREEMENT FORMAT)
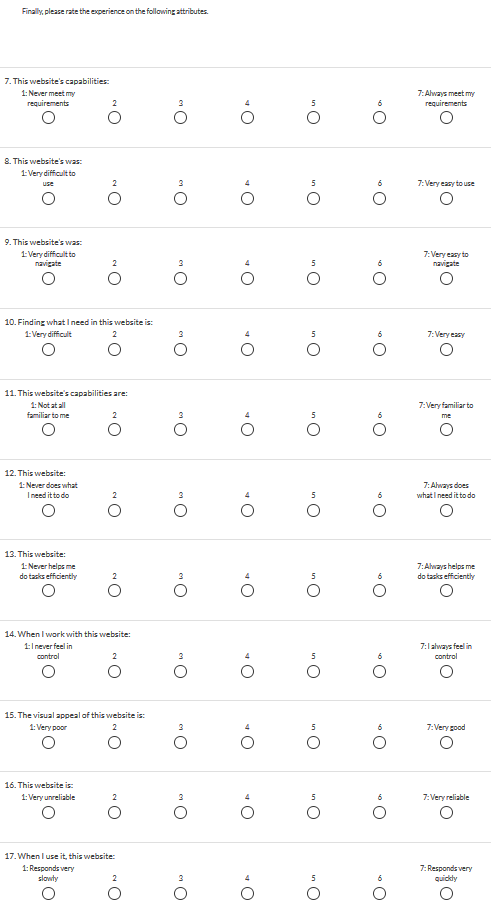
PAGE 3 (VERSION 2 – ITEM-SPECIFIC FORMAT)
Appendix B. Likelihood of False Positives for 14 t-Tests
Table 3. Likelihood of False Positives for 14 t-Tests with Significance Criterion of p < 0.05
| x | p(x) | p(at least x) |
| 0 | 0.48767 | 1.00000 |
| 1 | 0.35934 | 0.51233 |
| 2 | 0.12293 | 0.15299 |
| 3 | 0.02588 | 0.03005 |
| 4 | 0.00375 | 0.00417 |
| 5 | 0.00039 | 0.00043 |
| 6 | 0.00003 | 0.00003 |
| 7 | < 0.00001 | < 0.00001 |
| 8 | < 0.00001 | < 0.00001 |
| 9 | < 0.00001 | < 0.00001 |
| 10 | < 0.00001 | < 0.00001 |
| 11 | < 0.00001 | < 0.00001 |
| 12 | < 0.00001 | < 0.00001 |
| 13 | < 0.00001 | < 0.00001 |
| 14 | < 0.00001 | < 0.00001 |