
Abstract
From humble beginnings, the SUS has become a valuable tool in the toolkits of usability and user experience practitioners and researchers. We have developed regression equations that compute benchmarks for SUS items based on an overall SUS score. A review of the SUS literature on published benchmarks for the means of overall SUS scores from usability studies/surveys provides guidance on selecting an appropriate value of SUS to use when setting item benchmarks. We expect this extension of SUS benchmarking methodology to be of value to usability and user experience practitioners.
Keywords
System Usability Scale, SUS, targets, benchmarks
Introduction
“[The] SUS [System Usability Scale] yields a single number representing a composite measure of the overall usability of the system being studied. Note that scores for individual items are not meaningful on their own” (Brooke, 1996, p. 189).
Brooke’s (1996) caution against examining scores for the individual items of the SUS was appropriate at the time. He was publishing a “quick and dirty” questionnaire with analyses based on data from 20 people. Despite this humble beginning, the SUS has become a widely-used questionnaire for the assessment of perceived usability (Brooke, 2013; Sauro & Lewis, 2009; Zviran, Glezer, & Avni, 2006). With the data now available more than 20 years after its initial publication, we believe it is time to develop a method for benchmarking individual SUS items based on emerging benchmarks for the overall SUS (Bangor, Kortum, & Miller, 2008, 2009; Sauro & Lewis, 2016).
What Is the System Usability Scale?
The SUS (Figure 1) is a standardized questionnaire designed to assess perceived usability (Brooke, 1996, 2013; Sauro, 2011). In a study of unpublished industrial usability studies, Sauro and Lewis (2009) found that the SUS accounted for 43% of post-test questionnaire usage. The standard version of the SUS has 10 items, each with five steps anchored with “Strongly Disagree” and “Strongly Agree.” It is a mixed-tone questionnaire in which the odd-numbered items have a positive tone and the even-numbered items have a negative tone.
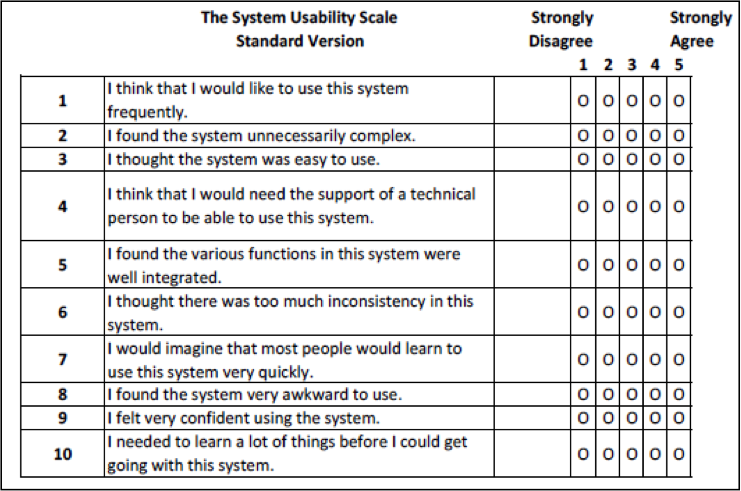
Figure 1. The standard System Usability Scale. Note: Item 8 shows “awkward” in place of the original “cumbersome.”
The first step in scoring a SUS is to determine each item’s score contribution, which will range from 0 to 4. For positively-worded items (odd numbers), the score contribution is the scale position minus 1. For negatively-worded items (even numbers), the score contribution is 5 minus the scale position. To get the overall SUS score, multiply the sum of the item score contributions by 2.5, which produces a score that can range from 0 (very poor perceived usability) to 100 (excellent perceived usability) in 2.5-point increments.
The SUS has turned out to be a very flexible questionnaire. Since its initial publication, some researchers have proposed minor changes to the wording of the items. For example, Finstad (2006) and Bangor et al. (2008) recommended replacing “cumbersome” with “awkward” in Item 8. The original SUS items refer to “system,” but substituting the word “website” or “product,” or using the actual website or product name seems to have no effect on the resulting scores (Lewis & Sauro, 2009). Of course, any of these types of substitutions should be consistent across the items. SUS scores did not appear to be significantly affected even when the even items were rewritten with a positive tone (Sauro & Lewis, 2011). In addition to its use as a post-test questionnaire for the assessment of perceived usability, the SUS is also useful for the retrospective evaluation of products and services (Grier, Bangor, Kortum, & Peres, 2013).
Psychometric Properties of the SUS
The 10 SUS items were selected from an initial pool of 50 potential items, based on the responses of 20 people who used the full set of items to rate two software systems, one of which was known to be relatively easy to use and the other relatively difficult. The items selected for the SUS were those that provided the strongest discrimination between the systems. In the original paper by Brooke (1996), he reported strong correlations among the selected items (absolute values of r ranging from 0.7 to 0.9), but he did not report any measures of reliability or validity.
Other researchers have investigated the reliability, validity, and sensitivity of the SUS. This research has consistently shown the SUS to have reliabilities at or just over 0.90 (Bangor et al., 2008; Lewis, Brown, & Mayes, 2015; Lewis & Sauro, 2009; Lewis, Utesch, and Maher, 2015), which exceeds the typical criterion of 0.70 for measurements of sentiments (Nunnally, 1978). A variety of studies have provided evidence of the validity and sensitivity of the SUS, including the following:
- Bangor et al. (2008) found the SUS to be sensitive to differences among types of interfaces and changes made to a product. They also found significant concurrent validity with a single 7-point rating of user friendliness (r = 0.806).
- Lewis and Sauro (2009) reported that the SUS was sensitive to the differences in a set of 19 usability tests.
- Kortum and Bangor (2013) found significant differences in SUS ratings for different types of products. For example, Excel had relatively low SUS scores; Gmail had relatively high scores.
- Kortum and Sorber (2015) found differences in the SUS ratings of mobile device operating systems (iOS and Android) and types of devices (phones and tablets).
- SUS scores are sensitive to successful task completion, with those completing tasks successfully providing higher scores (Kortum & Peres, 2014; Lewis, Brown, et al., 2015; Peres, Pham, & Phillips, 2013).
- Bangor, Joseph, Sweeney-Dillon, Stettler, and Pratt (2013) found a significant relationship between SUS scores and a composite metric based on business indicators of success in the marketplace.
- Tullis and Stetson (2004) conducted a Monte Carlo resampling study in which the SUS was the fastest of five post-study questionnaires to reliably discriminate between two financial websites as a function of increasing sample size.
SUS Norms
By itself, a score has no meaning regarding whether it is poor or good. This judgment requires some sort of comparison. One type of comparison is to statistically compare two sets of data from, for example, different products or different user groups. Another is comparison with norms. The basis for norms is data collected from a representative group that has a sufficiently large sample size to establish percentiles. For a metric in which a low score is poorer than a high score, an observed score that is at the 5th percentile can be interpreted as markedly poorer than one that is at the 95th percentile, or even at the 50th percentile. Thus, standardized questionnaires for which there are normative data are of greater value to practitioners than questionnaires that lack them.
Within the past 10 years, several researchers have accumulated large data sets with thousands of individual SUS questionnaires and hundreds of studies (e.g., Bangor et al., 2008; Sauro, 2011; Tullis & Albert, 2008). With the advent of large-sample data sets of SUS scores, there have been a few attempts to provide a “grading scale” for their interpretation. For example, Bangor et al. (2009) added a 7-point scale user-friendliness item as an 11th question to nearly a thousand SUS questionnaires: “Overall, I would rate the user-friendliness of this product as: [from left to right in a scale rating selection box] Worst Imaginable, Awful, Poor, OK, Good, Excellent, Best Imaginable” (p. 117). They developed a grading scale in which SUS scores below 60 were an “F,” between 60 and 69 were a “D,” between 70 and 79 were a “C,” between 80 and 89 were a “B,” and 90 and above were an “A.”
In the spirit of a relative (as opposed to an absolute) approach to grading, Sauro and Lewis (2016—based on an analysis first presented in Sauro, 2011) used data from 241 industrial usability studies and surveys to create a curved grading scale in which a SUS score of 68 is at the center of the range for a “C.” In a typical curved grading scale, the 50th percentile (median) corresponds to the center of the range for an average grade (C). The highest and lowest 15 percentile points correspond to the A and F ranges, respectively. They further divided the top 15 percent of mean SUS scores into A+, A, and A-, and did a similar breakdown for B and C grades (providing similar distinctions for D and F grades did not seem as if it would be very useful). Table 1 shows the complete curved grading scale, showing the range of SUS scores for each grade and the corresponding percentile range.
Table 1. Curved Grading Scale for the SUS
|
Grade |
SUS |
Percentile range |
|
A+ |
84.1 – 100 |
96 – 100 |
|
A |
80.8 – 84.0 |
90 – 95 |
|
A- |
78.9 – 80.7 |
85 – 89 |
|
B+ |
77.2 – 78.8 |
80 – 84 |
|
B |
74.1 – 77.1 |
70 – 79 |
|
B- |
72.6 – 74.0 |
65 – 69 |
|
C+ |
71.1 – 72.5 |
60 – 64 |
|
C |
65.0 – 71.0 |
41 – 59 |
|
C- |
62.7 – 64.9 |
35 – 40 |
|
D |
51.7 – 62.6 |
15 – 34 |
|
F |
0 – 51.6 |
0 – 14 |
In an interesting correspondence to these empirically based grading scales, we have noted that it is becoming a common industrial goal to achieve a SUS of 80 as evidence of an above average user experience. This seems like a reasonable benchmark given that an 80 is a B in the Bangor et al. absolute grading scale and an A- in the Sauro-Lewis curved grading scale.
Why Develop Item-Level Benchmarks?
Why might SUS item benchmarks be of value to user experience practitioners? The SUS is an excellent instrument for the broad measurement of perceived usability, but there may well be times when practitioners want to set targets for other more specific experience attributes, such as perceptions of findability, complexity, consistency, and confidence. To do that, practitioners would need to develop specific items to measure those more specific attributes.
Some attributes, such as findability, do not appear in the 10 SUS items. Other attributes, such as perceived complexity (Item 2), perceived ease-of-use (Item 3), perceived consistency (Item 6), perceived learnability (Item 7), and confidence-in-use (Item 9) do appear in the SUS. Practitioners who use the SUS and who also need to assess any of these specific attributes would need to decide whether to ask participants in their studies to rate this attribute twice (once in the SUS and again using a separate item) or to use the response to the SUS item in two ways (contributing to the overall SUS score and as a measure of the specific attribute of interest). The latter, using the response to the SUS item in two ways, is the more efficient approach. Furthermore, our existing large database of completed SUS questionnaires (Lewis & Sauro, 2017a, 2017b) can be used to develop benchmarks for the items of the SUS.
Our modelling strategy was to develop simple linear regression equations that would allow practitioners to choose a value of SUS with a known grade level from Table 1 and compute the corresponding value of the SUS item associated with the specific attribute of interest. It does complicate matters when the item whose value you’re interested in predicting has contributed to the overall SUS score. One way to address that complication would be to remove the attribute of interest from the SUS, but then the regression equations would not use the standard SUS, so fixing one issue creates another.
Fortunately, in Lewis and Sauro (2017a), we examined the consequences of removing single SUS items on the overall SUS score and found that the mean scores of all 10 possible nine-item variants of the SUS were within one point (out of a hundred) of the mean of the standard SUS. Thus, removing any one of the SUS items does not have a practically significant effect on the resulting scores, as long as the appropriate adjustment is made to the multiplier (specifically, multiply the sum of the adjusted item scores by 100/36 instead of the standard 100/40, or 2.5, to compensate for the dropped item).
For the current research, this means that there is no need to deal with nine-item variants of the SUS because there is no practical difference between the scores of any nine-item variant and the full SUS. Although the essential equivalence between nine-item variants and the standard SUS means that we could have done our modelling with nine-item variants, we chose to use the standard SUS. Using the standard SUS simplifies the practical use of the research we’re presenting because practitioners will not need to be familiar with the nine-item variants.
Objective of the Current Study
The objective of the current study was to develop regression equations that model the relationship between SUS items and overall SUS scores. With those models and published SUS norms, it would be easy to compute benchmarks for SUS items that correspond with given overall SUS benchmarks.
Method
The following sections present the data and procedures used in this study.
Data Set
We compiled data from 166 unpublished industrial usability studies/surveys. Thus, the data set included 166 sets of means, with those means based on scores from 11,855 individual SUS questionnaires. We restricted the data set to studies/surveys that used a version of the standard SUS.
Analyses
The regression equations were computed from the data using IBM SPSS Statistics 21. The analyses were double-checked using the R function analyze.regression (published in Lewis & Sauro, 2016), which can also compute confidence intervals around predicted values.
Results
All regressions were statistically significant (p < .01). Practitioners can use the regression equations to compute benchmarks that correspond to any overall value of SUS. We have illustrated this in Table 2, which shows the 10 regression equations and item benchmarks for overall SUS scores of 68 (the center of the Sauro-Lewis curved grading scale) and 80 (a common industrial benchmark which is an A- on the Sauro-Lewis curved grading scale). Note that due to the mixed tone of the SUS the directionality of the item targets is different for odd- and even-numbered items. Specifically, for odd-numbered items, it is desirable for observed means to be greater than the targets; for even-numbered items it is desirable for observed means to be less than the targets.
For example, if a practitioner is interested in interpreting Item 3, “I thought the system was easy to use,” then a mean score of 3.67 would correspond to a SUS score of 68 (an average overall system score). For consistency with an above average SUS score of 80, the corresponding target for Item 3 would be an average score of at least 4.24.
Table 2. Regression Equations and Item Benchmarks for SUS = 68 and SUS = 80
|
Regression [R2] |
Lower |
Target for SUS=68 |
Upper |
|
Lower |
Target for SUS=80 |
Upper |
|
SUS01 = 1.073927 + 0.034024(SUS) [34.5%] |
3.30 |
≥ 3.39 |
3.47 |
|
3.69 |
≥ 3.80 |
3.90 |
|
SUS02 = 5.834913 – 0.04980485(SUS) [89.3%] |
2.42 |
≤ 2.44 |
2.48 |
|
1.81 |
≤ 1.85 |
1.89 |
|
SUS03 = 0.4421485 + 0.04753406(SUS) [88.1%] |
3.64 |
≥ 3.67 |
3.71 |
|
4.21 |
≥ 4.24 |
4.28 |
|
SUS04 = 3.766087 – 0.02816776(SUS) [51.7%] |
1.80 |
≤ 1.85 |
1.90 |
|
1.45 |
≤ 1.51 |
1.57 |
|
SUS05 = 1.18663 + 0.03470129(SUS) [75.0%] |
3.51 |
≥ 3.55 |
3.58 |
|
3.92 |
≥ 3.96 |
4.01 |
|
SUS06 = 4.589912 – 0.03519522(SUS) [73.9%] |
2.16 |
≤ 2.20 |
2.23 |
|
1.73 |
≤ 1.77 |
1.82 |
|
SUS07 = 0.9706981 + 0.04027653(SUS) [84.6%] |
3.68 |
≥ 3.71 |
3.74 |
|
4.15 |
≥ 4.19 |
4.23 |
|
SUS08 = 5.575382 – 0.04896754(SUS) [86.5%] |
2.21 |
≤ 2.25 |
2.28 |
|
1.61 |
≤ 1.66 |
1.70 |
|
SUS09 = 0.6992487 + 0.04435754(SUS) [85.0%] |
3.68 |
≥ 3.72 |
3.75 |
|
4.21 |
≥ 4.25 |
4.29 |
|
SUS10 = 4.603949 – 0.03692307(SUS) [67.6%] |
2.05 |
≤ 2.09 |
2.14 |
|
1.59 |
≤ 1.64 |
1.71 |
Note: “Lower” is the lower limit of a 95% confidence interval around the estimated target; “Upper” is the upper limit.
A common way to assess the quality of a regression model is to compute its coefficient of determination. The coefficients of determination (R2) shown in Table 2 correlate highly with the widths of the confidence intervals, r(8) = -0.93; p < .01. The correlation is negative because the poorer the fit of the model, the wider the interval. The 95% confidence intervals in Table 2 show that these estimates are reasonably precise (even for SUS01, the model with the poorest fit), with margins of error for the more extreme predictions (if SUS = 80) ranging from ±0.04 to ±0.11 and for the less extreme predictions (if SUS = 68) ranging from ±0.03 to ±0.08. Because very extreme predictions will be very imprecise (e.g., SUS = 0 or SUS = 100), we advise against them. Fortunately, there is little reason for practitioners to set such extreme benchmarks.
Discussion
When Brooke (1996) published the SUS as a “quick and dirty usability scale,” the description was accurate, and his warning to avoid attempting to interpret the individual items was warranted. Now, 20 years later, there appears to be enough data available to support the development of regression models to enable practitioners to interpret the means of SUS items, especially in the light of published norms for interpreting overall mean SUS scores.
We expect these models to be of value to usability and user experience practitioners who use the SUS. We do not, however, expect them to be equally valuable. The most useful items will probably be those that touch most directly on constructs believed to affect perceived usability, such as SUS02 (complexity), SUS03 (ease of use), SUS05 (integration), SUS06 (consistency), and SUS09 (confidence). At this time, we can only speculate on which SUS items practitioners will choose to focus, and that might be different depending on the practitioner’s context.
It isn’t surprising that each regression model was highly significant given that the variable being predicted (the score for the individual item) was also part of the predictor variable (the overall SUS). To eliminate this interdependence, however, would require computing an overall SUS without the item of interest, which would then not be a standard SUS. From a practical perspective, we believe the approach we have taken is reasonable and would be the easiest for practitioners to adopt.
Regarding the choice of an appropriate overall SUS benchmark, we have provided detailed results for 68 (average) and 80 (above average). Previous research (e.g., Kortum & Bangor, 2013; Sauro & Lewis, 2016) has shown markedly different SUS means for different products and types of products. The published grading scales for the SUS (Bangor et al., 2008; Sauro & Lewis, 2016) are appropriate for assessing the SUS (overall and by item) against the broad canvass of a wide variety of products and their associated user experiences. These may or may not be the same as the appropriate benchmarks for a more narrowly defined set of competitive products. For other overall benchmarks, practitioners can use the regression equations in Table 2 to compute appropriate item benchmarks.
Example 1
Suppose that in addition to using the SUS to measure perceived usability, a user experience practitioner has been asked to provide information about how confident people feel when using the product under study. In this lab, as it is in many, the typical SUS benchmark is 80. Rather than creating a new item for the assessment of self-confidence and needing to make a major investment to develop an empirically-based benchmark, the researcher decides to use Item 9 (“I felt very confident using this system”) and, as shown in Table 2, to set the usability benchmark to ≥ 4.25 (the value the regression equation produces when setting SUS to 80).
Example 2
In this example, suppose the research is on a product that is more difficult to use than most, and competitive evaluation has shown that the mean SUS for its competitors is 55, so the user experience research team sets the target for their product to 60. Furthermore, suppose previous user research has indicated that a key driver for the population that uses the product is that it is perceived as easy to learn—an attribute addressed by Item 7 of the SUS (“I would imagine that most people would learn to use this system quickly”). As in the previous example, the practitioner decides to use this item rather than creating a new version. Unlike the previous example, because the corresponding SUS benchmark is not 68 or 80, the practitioner needs to use the regression equation provided in Table 2 to set the benchmark for Item 7, which will be ≥ 3.39 (SUS07 = 0.9706981 + 0.04027653(60) = 3.39).
Recommendations
Future research on this topic can take a couple of different directions:
- We have analyzed data from a large number of usability studies/surveys, which were in turn composed of many completed SUS questionnaires. Others who have similar large data sets could attempt to replicate our findings.
- It would be interesting to see how these item benchmarks are used in practice, so we encourage researchers to study and report this use.
Conclusion
From humble beginnings, the SUS has become a valuable tool in the toolkits of usability and user experience practitioners and researchers. We have developed regression equations that compute benchmarks for SUS items based on an overall SUS score. A review of the SUS literature on published benchmarks for the means of overall SUS scores from usability studies/surveys provides guidance on selecting an appropriate value of SUS to use when setting item benchmarks. We expect this extension of SUS benchmarking methodology to be of value to usability and user experience practitioners.
Tips for Usability Practitioners
Consider these tips when deciding how to use the SUS to create an item benchmark:
- If you have a current benchmark for the SUS, you can use the information in Table 2 to extend that benchmark to one or more SUS items. The table includes benchmark information for an average experience (SUS = 68) and a good experience (SUS = 80). For other experience levels or unusual measurement contexts, you will need to use the regression equations.
- The regression equations will work best for moderate values of SUS (in the grade range of D to A). Avoid using them in association with extremely high or low values of SUS (e.g., 0 or 100) because that is where the computed values will be least accurate.
- Don’t feel as if you need to set benchmarks for every SUS item. Choose those items that are the most important in your work context.
- To ensure that you have achieved a given target, be sure to compute confidence intervals around your observed means. If the target value is outside of the confidence interval and in the desired direction (which is different for the odd and even SUS items), then you have compelling evidence at that level of confidence that you have achieved your goal (for details on comparing observed data to benchmarks, see Sauro & Lewis, 2016, Chapter 4).
References
Bangor, A., Joseph, K., Sweeney-Dillon, M., Stettler, G., & Pratt, J. (2013). Using the SUS to help demonstrate usability’s value to business goals. In Proceedings of the Human Factors Society and Ergonomics Society Annual Meeting (pp. 202–205). Santa Monica, CA: HFES.
Bangor, A., Kortum, P. T., & Miller, J. T. (2008). An empirical evaluation of the System Usability Scale. International Journal of Human-Computer Interaction, 24, 574–594.
Bangor, A., Kortum, P. T., & Miller, J. T. (2009). Determining what individual SUS scores mean: Adding an adjective rating scale. Journal of Usability Studies. 4(3), 114–123.
Brooke, J. (1996). SUS: A ‘quick and dirty’ usability scale. In P. Jordan, B. Thomas, & B. Weerdmeester (Eds.), Usability Evaluation in Industry (pp. 189–194). London, UK: Taylor & Francis.
Brooke, J. (2013). SUS: A retrospective. Journal of Usability Studies, 8(2), 29–40.
Finstad, K. (2006). The System Usability Scale and non-native English speakers. Journal of Usability Studies, 1(4), 185–188.
Grier, R. A., Bangor, A., Kortum, P., & Peres, S. C. (2013). The System Usability Scale: Beyond standard usability testing. In Proceedings of the Human Factors Society and Ergonomics Society Annual Meeting (pp. 187–191). Santa Monica, CA: HFES.
Kortum, P., & Bangor, A. (2013). Usability ratings for everyday products measured with the System Usability Scale. International Journal of Human-Computer Interaction, 29, 67–76.
Kortum, P., & Peres, S. C. (2014). The relationship between system effectiveness and subjective usability scores using the System Usability Scale. International Journal of Human-Computer Interaction, 30, 575–584.
Kortum, P., & Sorber, M. (2015). Measuring the usability of mobile applications for phones and tablets. International Journal of Human-Computer Interaction, 31, 518–529.
Lewis, J. R., Brown, J., & Mayes, D.K. (2015). Psychometric evaluation of the EMO and the SUS in the context of a large-sample unmoderated usability study. International Journal of Human-Computer Interaction, 31, 545–553.
Lewis, J. R., & Sauro, J. (2009). The factor structure of the System Usability Scale. In M. Kurosu (Ed.), Human Centered Design, HCII 2009 (pp. 94–103). Heidelberg, Germany: Springer-Verlag.
Lewis, J. R., & Sauro, J. (2016). Excel and R companion to the second edition of “Quantifying the user experience: Practical statistics for User Research: Rapid answers to over 100 examples and exercises. Denver, CO: Create Space Publishing.
Lewis, J. R., & Sauro, J. (2017a). Can I leave this one out? The effect of dropping an item from the SUS. Journal of Usability Studies, 13(1), 38–46.
Lewis, J. R., & Sauro, J. (2017b). Revisiting the factor structure of the System Usability Scale. Journal of Usability Studies, 12(4), 183–192.
Lewis, J. R., Utesch, B. S., & Maher, D. E. (2015). Measuring perceived usability: The SUS, UMUX-LITE, and AltUsability. International Journal of Human-Computer Interaction, 31, 496–505.
Nunnally, J. C. (1978). Psychometric theory. New York, NY: McGraw-Hill.
Peres, S. C., Pham, T., & Phillips, R. (2013). Validation of the System Usability Scale (SUS): SUS in the wild. In Proceedings of the Human Factors and Ergonomics Society Annual Meeting (pp. 192–196). Santa Monica, CA: HFES.
Sauro, J. (2011). A practical guide to the System Usability Scale. Denver, CO: Measuring Usability LLC.
Sauro, J., & Lewis, J. R. (2009). Correlations among prototypical usability metrics: Evidence for the construct of usability. In Proceedings of CHI 2009 (pp. 1609–1618). Boston, MA: ACM.
Sauro, J., & Lewis, J. R. (2011). When designing usability questionnaires, does it hurt to be positive? In Proceedings of CHI 2011 (pp. 2215–2223). Vancouver, Canada: ACM.
Sauro, J., & Lewis, J. R. (2016). Quantifying the user experience: Practical statistics for user research, 2nd ed. Cambridge, MA: Morgan-Kaufmann.
Tullis, T. S., & Albert, B. (2008). Measuring the user experience: Collecting, analyzing, and presenting usability metrics. Burlington, MA: Morgan Kaufmann.
Tullis, T. S., & Stetson, J. N. (2004). A comparison of questionnaires for assessing website usability. Paper presented at the Usability Professionals Association Annual Conference, June. UPA, Minneapolis, MN.
Zviran, M., Glezer, C., & Avni, I. (2006). User satisfaction from commercial web sites: The effect of design and use. Information Management, 43, 157–178.