
Abstract
The importance of user experience for the design, development, and deployment of software products has increased significantly, motivating governments to focus on user experience when designinge-government services. We evaluated the user experience of e-government services from citizens’ perspectives by focusing on citizens’ characteristics and social aspects, which significantly affect their experience with technology. Therefore, we conducted a systematic literature review to investigate user experience in e-government by adopting the Social Progress Index (SPI) as a user metric. We followed accepted, scholarly guidelines to form research questions and identify specific inclusion/exclusion criteria to meet research objectives. Then, we collected 672 articles, published between 2000–2022 from six technology digital libraries, and we selected 75 state-of-the-art studies. These studies were categorized based on SPI class. We synthesized a set of factors that significantly impacts user experience in each class. Then, we identified six major user experience concerns in e-government. We provide an overall analysis of these concerns, including the calculated frequencies that specific concerns appear in published articles, followed by definitions of the theories and models used to evaluate each behavior. We conclude with recommendations for how to enhance user experience in e-government services and mitigate the challenges hindering users from obtaining the best experiences.
Keywords
electronic government, e-government, user experience, user interactions, e-government services, e-government challenges, systematic literature review, social progress index (SPI), e-government development index (EGDI)
Introduction
Companies are employing new information and communication technologies (ICT) to deliver services and engage users in decision-making to ensure their system’s success. ICT features help ensure quality in software but require more focus during the services’ design and development processes. One important feature is user experience (Chung & do Prado Leite, 2009). ISO standards define user experience as a “consequence of brand image, presentation, functionality, system performance, interactive behavior, and assistive capabilities of a system, product, or service. It also results from the user’s internal and physical state resulting from prior experiences, attitudes, skills, abilities, and personality and from the context of use” (ISO 9241-210:2019, 2019). User experience points to a broad objective, not just to obtain a usable and effective system, but also to enhance the overall experience of target users, starting from their expectations, through their attitudes and interaction with the system, and ending with the reflection of their experience (Zhao & Liu, 2017). In the software engineering domain, software development has been characterized by many approaches, such as user-centered design (UCD) that considers the goals and needs of target users at the center of the development process. Because user experience plays a crucial role in the design and development of services, it has become an integral part of the software development process in many Information Technology (IT) companies (Komischke, 2009).
Governments worldwide have introduced electronic government (e-government) services using ICT infrastructure to deliver services and interact with citizens. E-government helps reduce costs, makes operations more efficient, and improves services’ quality, including by delivering them promptly to citizens (Y. Chen et al., 2006). The importance of user experience in software development processes has increased significantly, motivating governments to focus on user experience when designing e-government services. However, e-government services are still prone to poor user experience (Carter et al., 2016; Dwivedi et al., 2019). Therefore, designing for user experience plays a significant role in bridging the gap between governments and citizens. Governments should pay close attention to citizens’ needs and preferences and engage them while designing government services to provide value to their citizens.
The study of user experience for e-government services is a way to help government practitioners and developers design efficient services that meet citizens’ needs, which imbues positive citizens’ attitudes toward e-government. This research area has received much attention from researchers in the past decades (Downey & Rosales, 2012; Qureshi et al., 2017; Sukmasetya et al., 2018), yet there is a lack of studies that consolidates the considerable number of papers in a systematic fashion regarding user experience in e-government services. Therefore, we conducted a systematic literature review (SLR) study to get a comprehensive overview of how user experience has been studied in the e-government domain to identify the gaps in the existing literature. To the best of our knowledge, none of the previous studies presented a comprehensive SLR to investigate user experience in e-government. Our original contributions include:
- Proposing a taxonomy of user experience in e-government services based on a specific user metrics model;
- Demonstrating the factors that significantly influence user experience in the e-government domain from citizens’ perspectives;
- Covering the performance of e-government in different countries from citizens’ perspectives; and
- Introducing open gaps between user experience and e-government for future research contributions.
The remainder of this article is organized as follows. We present the overall background of e-government and user experience then explain our metrics used to categorize user experience in e-government based on the Social Progress Index (SPI). We describe the method we followed to conduct the SLR study, including our research questions, sources of information, and selection criteria. Then we provide the resulting answers to the research questions. We elaborate on the study’s findings in an overall discussion and conclude with recommendations for user experience design in e-government services.
Background
This section introduces an overview of the concepts of e-government, e-government maturity models, and user experience in e-government.
E-government
The initiative of adopting ICT infrastructure in government systems is known as e-government, which emerged in the late 1990s (Ho, 2002). Countries around the world adopted the e-government term as a permanent commitment toward all their stakeholders to enhance their services and increase users’ confidence and intentions to adopt their e-government initiatives (Carter & Bélanger, 2005; Mahmood et al., 2014; Tolbert & Mossberger, 2006). Since then, e-government initiatives have grown dramatically and provided great opportunities for research and development (Grönlund & Horan, 2005).
Prior research studies in the e-government domain revealed that there is no globally agreed upon definition pertaining to e-government; otherwise, various definitions of the e-government are found (Halchin, 2004; Tohidi, 2011). The majority of definitions focus on two significant aspects of e-government: 1. E-government as a new approach of using ICT to deliver and provide new services; 2. The way governments provide e-services and information to their stakeholders (Al-Nuaim, 2011). E-government is simply defined as the use of technology through seamless online interaction between government entities and users for the fast delivery of government services and transactions (Fagan, 2006). It can be considered a strategic plan that adopts new and promising technologies to enhance stakeholders’ adoption, interactions, participation, engagement, and trust with the government sector using the available government services and information.
The e-government approach provides many benefits to the public. It increases the efficiency and effectiveness of service delivery. Also, it allows users to access and use government services in the most convenient way (Gant & Gant, 2002; Hackney et al., 2007). It offers the public the opportunity to break down any temporal and geographical barriers, and it efficiently fills in the gap between governments and users (Moon, 2002; West, 2004). E-government initiatives allow users to participate in different government events while reducing the burden of administrative work through an adopted cost-effective delivery mode which ensures the quality of services (Carter & Bélanger, 2005).
E-government Maturity Models
The Software Engineering Institute at Carnegie-Mellon University developed the maturity models concept as a framework for the required stages of maturity in software development (Paulk et al., 1993). These models provide best practices for developing, implementing, and designing functional services. In the government context, maturity models help government practitioners and policymakers gauge the government’s maturity and perform the necessary steps to enhance the offered services. The maturity model provides guidance to process development strategies by specifying the current process and exploring the issues that affect the quality and process development of e-government services (Wendler, 2012). The development of e-government maturity models has been investigated thoroughly. Most of the existing e-government maturity models comprise two to nine stages (Fath-Allah et al., 2014), and researchers have proposed many variants of models to improve the e-government maturity level (Joshi & Islam, 2018).
The most common e-government maturity model was developed by Layne and Lee (2001). This model consists of four main stages for functional services: catalog, transaction, vertical integration, and horizontal integration. The catalog stage refers to the online existence of e-government services. The transaction stage refers to the electronic transactions between the government and citizens. In the third stage, vertical integration, local systems are linked to higher-level systems. The horizontal integration stage refers to the system’s integration across different functions where users can access more than one service through the same web portal.
Another e-government maturity model was proposed by Reddick (2004). They defined it as a two-stage maturity model that consists of catalog and transaction stages. Another maturity model consists of five stages (Moon, 2002); these stages are information dissemination, two-way communication, service, financial transactions, horizontal and vertical integration, and political participation.
To summarize, e-government maturity models are divided into three main types (Iribarren et al., 2008):
- Governmental models are developed by government practitioners to help government agencies reach high levels of e-government.
- Holistic approach models are designed to help government authorities in project implementation and identify whether the e-government project will succeed or not.
- Evolutionary e-government maturity models are focused on the evolution of e-government using sequential steps.
Despite the significant number of e-government maturity models proposed, their underlying themes and stages are similar. The maturity models provide the development process of e-government from the organizational, political, and technological perspectives in a disjointed manner; these models do not address users’ behaviors and feelings while using e-government services. The models do not address the usability and usefulness of such services, which are the pillars of evaluating user experience in e-government services (Kawashita et al., 2020). These models need to be developed based on the evaluation of users’ behaviors if they are to enhance user experience in e-government services.
User Experience and E-government
During the past decades, e-government researchers have focused on the technological transformation of government services. They studied the adoption of technology and the use of the internet to efficiently deliver services and transactions to the public (Gauld et al., 2010). However, many studies have shown that the implementation of e-government initiatives failed to achieve their assigned role due to the lack of the services offered, poor website functions, or lack of users’ trust (Al-Shboul et al., 2014; Li & Osman Abdalla, 2014; Weerakkody et al., 2011; Weerakkody & Choudrie, 2005). A closer look at the failure aspects indicates how e-government initiatives drifted by focusing more so on the technology rather than understanding users’ needs to adopt e-government services (Bertot et al., 2008).
Therefore, recent research studies have started to improve the user-government relationship by investigating user experience in e-government services to increase users’ satisfaction and intention to adopt these services. The concept of user experience in government systems was introduced in the 1950s (Downey & Rosales, 2012). It has profound effects on users’ satisfaction, perception, and expectations of government services (Lowry et al., 2006). Users’ perceptions of e-government systems were widely investigated to discover users’ preferences of e-government systems (Verdegem & Verleye, 2009). Yet, most challenges and failures of e-government initiatives are due to the lack of users’ satisfaction and perception of the services (A. Alkraiji & Ameen, 2022). Reddick (2005) showed that a government’s capability to implement services that increase users’ willing adoption is—in and of itself—a pillar of a successful e-government system. Therefore, including user experience in services’ design will mitigate challenges, improve the development of e-government services, and increase users’ engagement (Tsakonas & Papatheodorou, 2008) because it aims to intensify and improve users’ beliefs and emotions toward e-government services.
To summarize, e-government services have yet to reach their full potential, which can be achieved by filling the gap between what is offered and what is used through investigating what users actually need and expect. This establishes the need to understand the factors influencing users’ acceptance and intentions to adopt e-government services. Hence, this study focused widely on investigating these factors, as well as previewing the current state of e-government initiatives worldwide to understand existing user experience in e-government services, which leads to increasing user’s acceptance and adoption.
User Analysis Metrics
Where people live significantly impacts their decisions, the way they think, and their reactions to external effects. Therefore, user experience is strongly related to the social and environmental constructs from which users formulate their opinions and attitudes toward government services (Harston & Pyla, 2018). Hence, in this study, we adopted the SPI to incorporate social and environmental factors with the user experience concept.
Social progress is defined as “the capacity of a society to meet the basic human needs of its citizens, establish the building blocks that allow citizens and communities to enhance and sustain the quality of their lives, and create the conditions for all individuals to reach their full potential” (The Social Progress Imperative, 2021). SPI is published by the nonprofit organization Social Progress Imperative® to help define best practices to evaluate countries by better understanding their people instead of focusing on other metrics unrelated to people characteristics. The proposed framework consists of three main dimensions to measure social progress, which are basic human needs, foundations of wellbeing, and opportunity, as shown in Figure 1. Four components are under each dimension with related, underlying concepts to that dimension. This framework provides a specific level of social progress for any given country. SPI measures each dimension, which leads to an overall score and rank for each country.
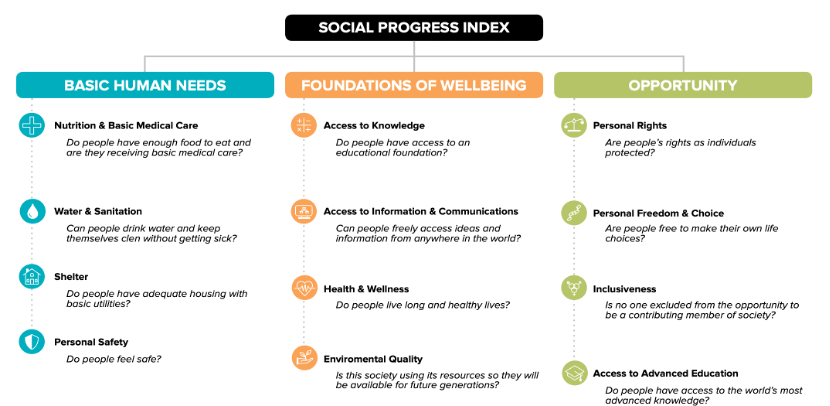
Figure 1: Social Progress Index (SPI) (The Social Progress Imperative, 2021).
SPI does not focus on the economic aspects of a country. In contrast, it isolates the non-economic dimensions of social performance and aims to be outcome-based. Hence, it helps countries benchmark their progress more accurately. It is an essential tool that helps compare countries and evaluate performance levels on social progress to help decision-makers. It defines best practices to evaluate countries by better understanding their people instead of focusing on other metrics unrelated to people characteristics. Hence, it supports researchers to target areas whose people need more attention to improve their overall wellbeing.
The 2021 SPI ranks 168 countries on social progress (Figure 2). Based on the hierarchical cluster analysis, countries are divided into six different tiers, starting with Tier 1 as the most socially progressed and ending with Tier 6 as the least socially progressed. Each tier contains a set of countries whose people have broadly similar SPI performance. The cluster analysis is based on education, health, safety, technology, human rights, and more.
In this SLR study, we adopted SPI to categorize the selected papers based on the score and rank of the given country. For a more concise and easy analysis, we merged the six tiers into three main groups: Tier 1 and Tier 2 countries in one group, Tier 3 and Tier 4 countries in a second group, and Tier 5 and Tier 6 countries in a third group. Each group refers to countries whose people are more likely to have similar social characteristics.
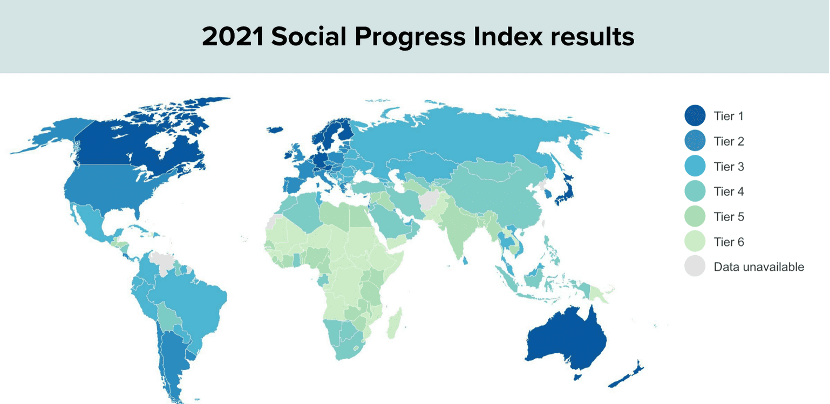
Figure 2: SPI results for 2021 (The Social Progress Imperative, 2021).
Method
This SLR study aimed to preview the literature of the current research studies on user experience in the e-government sector and investigate factors that have a significant impact on user experience. This helped answer specific research questions, identify gaps in the body of knowledge, and propose future directions (Kitchenham et al., 2009; Kitchenham & Charters, 2007; Petersen et al., 2015). Many SLR methods and guidelines have been adopted by researchers to perform the SLR process, such as PRISMA (Moher et al., 2015) and the Kitchenham guidelines (Baheer et al., 2020; Khan & Park, 2013; Kitchenham et al., 2009). The Kitchenham guidelines have been widely utilized in performing SLRs in Software Engineering and Information Systems (IS) arenas, which makes it the best option for this study. These guidelines comprise three-step review stages that include planning the review, conducting the review, and reporting the review. Figure 3 illustrates the components of each stage.
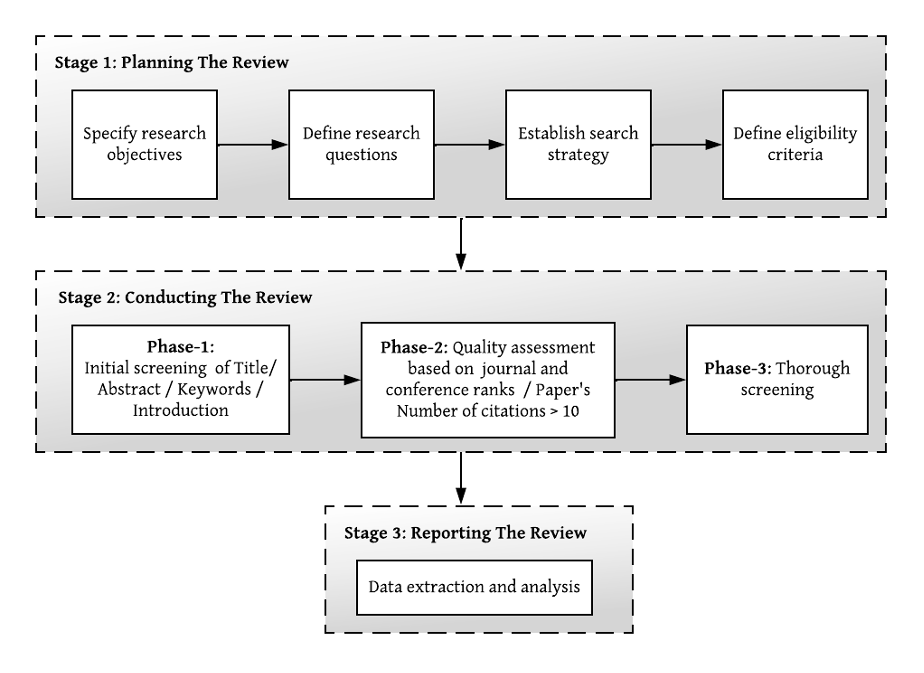
Figure 3: SLR research methodology.
Stage 1: Planning the Review
During the planning stage, a research procedure was conducted to guide the SLR process and increase the accuracy of the review process. The research procedure is composed of the research objectives and questions, details about the research strategy (that is, search words and resources that will be searched), and the eligibility criteria explaining both the inclusion and exclusion criteria of the research results. In the following sub-sections, we explain in-depth the contents of this research procedure.
Research Objectives
The primary objectives of this research are presented herein:
RO1: Investigate what has been documented as a widespread understanding of user experience of e-government.
RO2: Collect a group of credible and reliable references that are related to user experience in e-government.
RO3: Preview the current state of user experience in e-government for potential future contributions.
RO4: Investigate how user experience could be enhanced and improved in e-government.
Research Questions
We aimed to answer the following main research question: Within the vast revolution of technology, how can we better enhance and support users’ experience in the offered e-government services? Based on this research question, the following research sub-questions were formed:
RQ1: What are the factors that significantly influence user experience in e-government services from users’ perspectives?
This research question helped to investigate the factors that significantly influence user experience in the offered e-government services. We used the three groups based on the SPI tiers. Then, we provided the significant factors affecting each group of countries. This question helped to focus on significant, effective factors for further research.
RQ2: What are the user experience concerns investigated in a country based on that country’s SPI?
This question provided focused insight into user experience in e-government services by categorizing users’ behaviors and concerns of e-government services based on the country’s SPI. It helps researchers to properly understand the current state of user experience in e-government for each country by focusing on people characteristics rather than the economic level of a country.
RQ3: What are the future recommendations to enhance user experience in e-government services?
This question provided future perspectives for enhancing and improving user experience practices of e-government systems. It defined the user experience challenges in current systems to help researchers propose future contributions for enhancing user experience in e-government.
The research questions were framed using the PICOC model to identify the scope of the SLR study, as shown in Table 1. The PICOC model outlines five criteria: Population, Intervention, Comparison, Outcomes, and Context (PICOC). The first criteria, population, is related to the participants or the target system for the investigation. The interventions are actions that specify the investigation aspects and issues of researchers’ interest. The comparison refers to the research aspects to which the intervention is compared. The outcome leads to the results of the investigation. Finally, context is associated to the environment of the investigation (Petticrew & Roberts, 2006). The answers to these research questions help government practitioners better understand their citizens and focus on the factors affecting their experience with e-government services. The findings of empirical studies could be used as guidance to develop e-government services and enhance citizens’ experience in a given country.
Table 1: PICOC Criteria
| RQ1 | RQ2 | RQ3 | |
| Population | E-government services from users’ perspectives | ||
| Intervention | User experience | ||
| Comparison | N/A | ||
| Outcome | Factors | Concerns | Challenges |
| Context | Research papers selected from six scientific databases to investigate in the SLR study. | ||
Search Strategy
After identifying research objectives and questions, we proceeded with a search strategy to investigate relevant empirical studies corresponding to the aim of this research. Our process of choosing search sources and performing the search stage is explained in this section.
Source Selection
The first step of establishing the research strategy was building a knowledge base from major resources and databases. We selected digital databases with peer-reviewed and high-impact materials to avoid gray literature. Also, we paid attention to articles’ relevance to the research topic of user experience and government systems. Hence, we included six databases: ACM Digital Library, IEEE Xplore, ScienceDirect, VT Library, Digital Government Reference Library (DGRL), and Springer Link.
Search Phrase
The search phrase was formed by identifying keywords that helped answer our research questions. These keywords were combined using AND and OR logical operators. Table 2 shows the primary and secondary search terms along with the final search phrase.
Table 2: SLR Search Terms
| Primary search terms | user experience, e-government |
| Secondary search terms | user experience, attitude, perception, perceive, emotion, intention, adoption, electronic government, e-government, digital government |
| Final search phrase | (“User experience” OR user experience OR adoption OR emotion OR attitude OR intention OR perception OR perceive) AND (“electronic government”, e-government, “digital government”) |
Eligibility Criteria
After retrieving all relevant studies based on searching the keywords, we applied a screening process to include only those which met the inclusion criteria.
Table 3: SLR Eligibility Criteria
| Inclusion criteria | Exclusion criteria |
| Publication Year: 2000–2022 | Document is not related to the research topic. |
| Peer reviewed documents | Workshop, panel, tutorial, seminar, interview, or poster |
| Documents focusing on the user experience of e-government services from users’ perspectives | Document is a book or magazine. |
| Available online | Marginal publication venue |
| The document answers the research question. |
Stage 2: Conducting the Review
The reviewing process had three main phases.
Phase-1: We evaluated articles’ relevance to this study based on their titles, abstracts, introductions, and conclusions. Following the Kitchenham guidelines, we tried to be liberal in conducting this phase to eliminate any chance of excluding relevant studies (Kitchenham & Charters, 2007). Therefore, the strategy to evaluate quality was informed by the following checklist:
- The article should have a clear contribution to user experience in e-government.
- The article should discuss the user experience concept from only citizens’ perspectives.
- The article should contribute to answering at least one research question.
All articles were assessed using this checklist to evaluate their compliance with the scope of the survey. After we completed the assessment, articles that didn’t meet the quality criteria were excluded. This phase excluded 297 articles.
Phase-2: We assessed the credibility of the selected articles using two credibility criteria. A study was included once it met any one of these criteria:
- To ensure maximum visibility and recognition, we established specific criteria for our selection process, which included only journal articles with an impact factor greater than 3 and conferences with well-established reputations.
- To ensure that our study is based on high-quality research, we implemented a screening process that included assessing the number of citations for each study. We decided to keep only those studies that had more than 10 citations, as we believe that this number indicates their importance and impact in the field. After applying this criterion, we eliminated a total of 110 studies at the conclusion of this phase. By doing so, we were able to focus our attention on a smaller, more relevant set of articles for the next phase of our research.
Phase-3: We conducted a thorough screening of all included studies. The full texts of these studies were scrutinized based on the eligibility criteria in Table 3, and we used the quality evaluation checklist from Phase-1 to determine the relevance of each article in this phase. For instance, some articles discussed user experience in e-government services from a business perspective or government officer’s perspective, not from citizens’ perspectives; these articles were excluded. Also, some articles focused on this topic from the technical aspects of e-government services, overlooking citizens’ behaviors and feelings; these articles were excluded. Therefore, a total of 75 articles were considered relevant (to some extent) to our research questions, and they were selected as the primary studies. Figure 4 demonstrates the complete screening process.
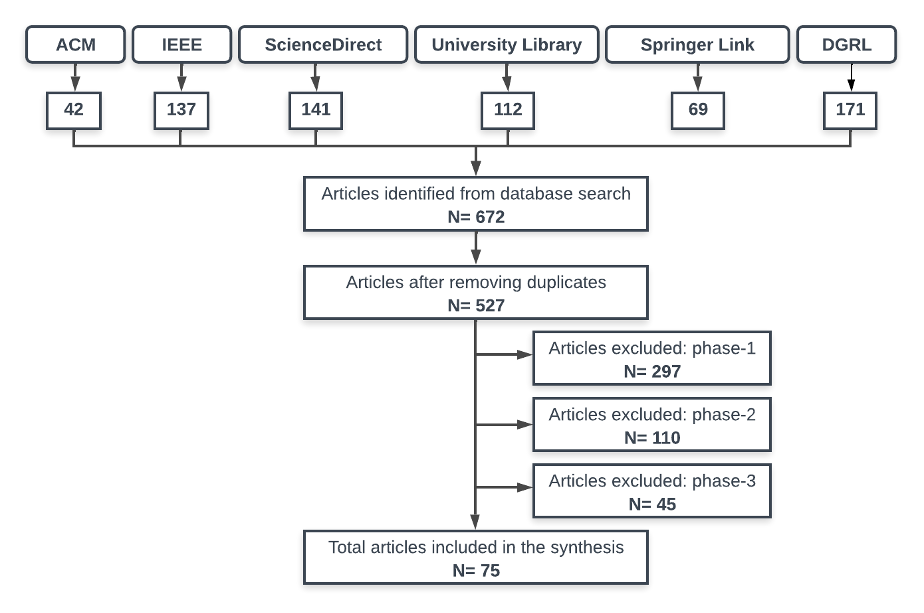
Figure 4: Flowchart demonstrating the screening phases.
Stage 3: Reporting the Review
The selected studies were moved through a data extraction strategy. In this strategy, each study was downloaded from its digital library and given a unique file ID. A spreadsheet was created to fill in the information of each study. Essential information, such as abstract, country of the study, user experience concern, set of factors, significance and limitation of the study, study gap, proposed solution, and future work, was retrieved from the study and stored in their respective columns. Accordingly, the stored analysis information was then used to analyze the results and answer the RQs, which is covered in the next section. Figure 5 describes the year-wise distribution of the 69 selected studies for the period 2000–2022.
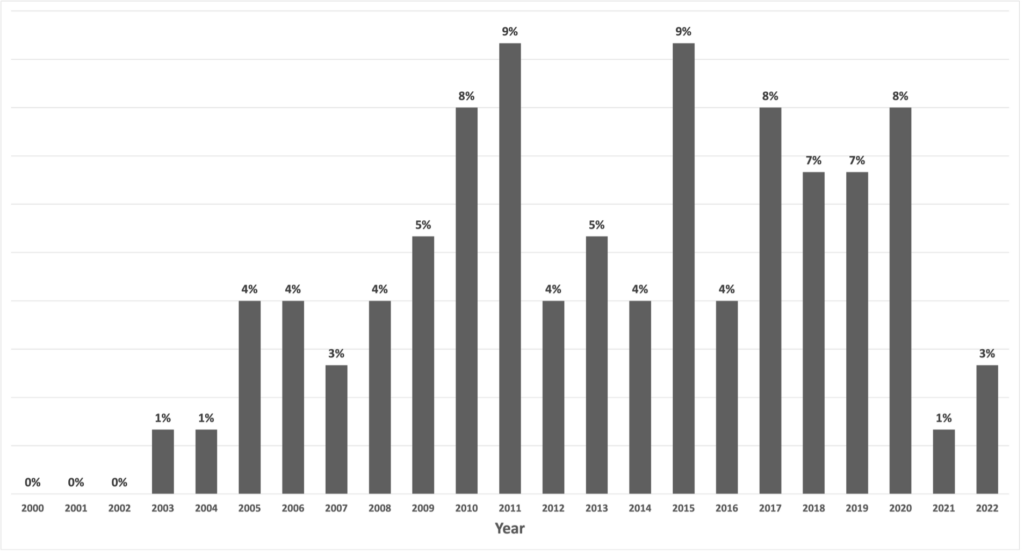
Figure 5: Year-wise distribution of the selected studies.
Results
The initial sample included 672 studies, from which we selected 75 studies (see Appendix 1 for a complete list of the selected studies). We provided answers to each RQ based on the categorization into three SPI classes based on SPI tiers: SPI Class 1 (Tier 1 and Tier 2 countries), SPI Class 2 (Tier 3 and Tier 4 countries), and SPI class 3 (Tier 5 and Tier 6 countries). By adopting SPI, we were able to investigate user experience in e-government by focusing on users’ characteristics that were carefully evaluated in the SPI framework. Hence, we investigated the current state of user experience in e-government for each class alongside significant factors influencing each class.
It is worth mentioning that this SLR study is an overview of papers that conducted empirical studies and statistical tests to identify the factors affecting user experience in specific countries. So, we did not seek any statistical tests in this paper. Otherwise, we try to draw a clear picture of the current state of user experience in the e-government domain based on the findings of the selected papers by calculating their frequencies.
See Appendix 3 for a glossary of definitions of all factors mentioned in the research questions.
RQ1: What Are the Factors That Significantly Influence Users Experience of E-government Services from Users’ Perspectives?
To answer this question, we categorized the selected studies based on their SPI class. Then we recorded the significant factors affecting the user experience in e-government for each study. We listed the most frequent significant factors influencing the user experience in e-government for each SPI class.
SPI Class 1: Tier 1 and Tier 2
Of the selected studies, 32% belonged to SPI Class 1 (Tier 1 and Tier 2 countries). Table 4 illustrates the frequent and significant factors influencing the user experience of e-government services in this class. More than half of the studies in this class (60%) considered the usefulness of the offered e-government services the most crucial factor to enhance user experience in e-government. Following that, 45% of studies mentioned the significance of perceived ease of use as a second significant factor. After that, users’ perceived trust in the offered e-government services significantly enhanced their experience, with 35% of the studies supporting this factor.
Moreover, user trust in the government itself is a critical factor, with 25% of the studies included in this class. Of the selected studies in this class, 25% considered the following factors significant to enhance user experience in e-government, based on the people’s perceptions in the countries included in SPI Class 1, which are: internet experience, perceived security, perceived risk, social influence, and information quality. Finally, 15% of the studies referred to the importance of trusting the internet to enhance overall user experience in e-government.
Table 4: Frequent Factors Affecting User Experience in SPI Class 1 Countries
| Factor | Frequency |
| Perceived usefulness | 60% |
| Perceived ease of use | 45% |
| Perceived trust | 35% |
| Trust in government | 25% |
| Internet experience | 20% |
| Perceived security | 20% |
| Perceived risk | 20% |
| Social influence | 20% |
| Information quality | 20% |
| Trust in the internet | 15% |
SPI Class 2: Tier 3 and Tier 4
The majority of the selected studies belonged to SPI Class 2 (Tier 3 and Tier 4) countries, containing 55% of the total studies. Table 5 shows the significant factors influencing user experience in e-government services in this class. More than half of the studies (60%) paid considerable attention to the importance of the perceived usefulness to influence user experience in e-government in this class. Of studies considered, 53% showed perceived ease of use as a significant factor in influencing user experience in e-government. In this class, 25% of studies mentioned the importance of facilitating conditions to affect user experience in e-government, followed by 23% of studies that considered the significant effect of social influence.
After that, users’ perceived trust in the offered e-government services significantly enhanced their experience, with 20% of the studies supporting this factor. Moreover, user trust in the government itself was a critical factor with 18% of the studies in this class, the same as the factor for information quality. Following that, 15% of the studies emphasized seeking users’ satisfaction to enhance overall user experience in e-government. The remaining significant factors are mentioned in Table 5.
Table 5: Frequent Factors Affecting User Experience in SPI Class 2 Countries
| Factor | Frequency |
| Perceived usefulness | 60% |
| Perceived ease of use | 53% |
| Facilitating conditions | 25% |
| Social influence | 23% |
| Perceived trust | 20% |
| Information quality | 18% |
| Trust in government | 18% |
| Satisfaction | 15% |
| Perceived behavior control | 13% |
| System quality | 13% |
SPI Class 3: Tier 5 and Tier 6
Few of the selected studies (13%) referred to SPI Class 3 (Tier 5 and Tier 6) countries. Table 6 shows the frequent and significant factors influencing user experience in e-government services in this class. Perceived usefulness is still considered the most critical factor that affects user experience in e-government, with 75% of the studies included in this class. Half of the studies considered the perceived ease of use and facilitating conditions the second most significant factors affecting user experience in e-government services. Of the selected studies in this class, 38% considered the following factors significant to enhance user experience in e-government based on the people’s perceptions in the countries included in SPI Class 3, which are: perceived trust, trust in government, service quality, and social influence. The remaining significant factors are mentioned in Table 6.
Table 6: Frequent Factors Affecting User Experience in SPI Class 3 Countries
| Factor | Frequency |
| Perceived usefulness | 75% |
| Perceived ease of use | 50% |
| Facilitating conditions | 50% |
| Perceived trust | 38% |
| Trust in government | 38% |
| Service quality | 38% |
| Social influence | 38% |
| System quality | 25% |
| Perceived security | 25% |
| Perceived privacy | 25% |
| Transparency | 25% |
| Self-efficacy | 25% |
In summary, some insights can be inferred from these results. For example, perceived usefulness was the most crucial factor enhancing users’ experience in all countries, with 60% in SPI Class 1 and SPI Class 2 and 75% in SPI Class 3 countries. Our study showed that SPI Class 3 countries are more concerned about the usefulness of e-government services than other countries. In addition, facilitating conditions played a significant role in enhancing users’ experience in SPI Class 3 countries, with 50% frequency, whereas only 25% of papers in SPI Class 2 countries considered its importance, and none of the papers related to the SPI Class 1 countries discussed its importance. This would lead us to the fact that SPI Class 1 countries are advanced and have a solid technical infrastructure compared to other countries. It is worth mentioning that the number of studies in each SPI class does not affect the frequency provided in these tables.
RQ2: What Are the User Experience Concerns Investigated in a Country Based on SPI of That Country?
This SLR study aimed to provide a comprehensive overview of user experience in e-government services. User experience, as a concept, broadly refers to users’ feelings, behaviors, and attitudes while using the offered services. It conveys different aspects of users’ experiences. Hence, we intended to seek more complex behaviors of users that describe their overall experience toward the services offered to them. Therefore, we analyzed the selected studies and imported the main user experience behavior being investigated in each study. This analysis helped provide a deep understanding of user experience in e-government. It should allow for better development of e-government services for a country based on its users’ characteristics along with their specific user experience concerns to enhance their overall experience in e-government by following the SPI tier of that country.
However, we noticed that user experience outcome variables (dependent variables) are not verbally similar in the selected studies. Therefore, we categorized the outcome variables based on their similarities and assigned a merging variable name for their later reference. Our categorization process is illustrated in Appendix 2. We referred to the studies by using the study ID parameter, mentioned in Appendix 1. This pattern helped us answer this research question by following a unified variable name. We defined six user experience concerns, which are discussed for each class of the SPI tiers. There are six user experience concerns in e-government, which are adoption, attitude, continuous intention to use, perceived net benefits, trust, and satisfaction. Figure 6 illustrates the number of the studies we selected that investigated each concern.
Then, we categorized each user experience concern based on each study’s SPI tier to provide a comprehensive overview of the current state of user experience in e-government for each SPI class. Figure 7 illustrates the list of user experience concerns alongside the percentage of the categorized classes based on SPI.
1) Adoption: The most common user experience variable in the e-government domain was adoption. Adoption is defined as “a mental process through which an individual passes from first hearing about an innovation to final adoption” (Rogers, 1983). More than half of the selected studies (54%) investigated user experience in e-government from the lens of users’ adoption behavior. In SPI Class 1, 30% of the studies investigated the adoption variable, followed by 58% of SPI Class 2 studies and 13% of SPI Class 3 studies. It appeared that the SPI Class 2 countries have more interest in users’ adoption behavior by containing the highest percentage of studies for the adoption behavior of e-government services compared to the other two SPI classes.
2) Attitude: Of the total selected studies, 13% were conducted to investigate users’ attitude behaviors. The attitude variable represents a person’s general feeling of favorability or unfavourability toward a specific system or service (Fishbein & Ajzen, 1975). Of SPI Class 1 studies, 50% investigated the attitude variable, followed by 30% of the SPI Class 2 studies, and 20% of SPI Class 3 class studies. The SPI Class 1 countries had the highest percentage of studies concerning the attitude of e-government services.
3) Continuous Intention to Use: Of the selected studies, 11% investigated continuous intention to use. Continuous intention to use refers to users’ continual intention to use the e-government services (Bhattacherjee, 2001). Of SPI Class 1 studies, 13% investigated this variable, followed by 63% of SPI Class 2 studies, and 25% of SPI Class 3 studies. The SPI Class 2 countries had more interest in continuous intention to use; this class contained the highest percentage of studies concerning this behavior toward e-government services.
4) Perceived Net Benefits: Perceived Net Benefits is defined as “the sum of all future benefits less all future costs expected to flow from the use of an information technology application” (Seddon, 1995). Around 9% of the selected studies investigated the user experience in e-government from the lens of this behavior. Of the SPI Class 1 studies, 29% investigated this variable, followed by 57% of SPI Class 2 studies, and 14% of SPI Class 3 studies. The SPI Class 3 countries had the highest percentage of studies concerning this behavior to investigate user experience in e-government services.
5) Trust: Trust is referred to as “an expectancy that the promise of an individual or group can be relied upon” (Rotter, 1971). Around 8% of the selected studies investigated the user experience in e-government from the lens of users’ trust. Of SPI Class 1 studies, 67% focused on users’ trust of e-government services, followed by 33% of SPI Class 2 studies. None of SPI Class 3 studies investigated this variable. The SPI Class 1 countries investigated users’ trust in e-government services more than other classes.
6) Satisfaction: The last user experience concern for offered e-government services was satisfaction, which refers to the extent of users’ physical, emotional, and cognitive responses resulting from their use of a system or service that meets their needs and expectations (ISO 9241-210:2019, 2019). Of the selected studies, 5% investigated users’ satisfaction with the offered e-government services. This variable was investigated by only SPI Class 2 studies, whereas none of the other two SPI classes investigated the user experience of e-government from the lens of users’ satisfaction. According to the International Organization for Standardization (ISO), satisfaction is considered one of the important standards of human factors (ISO 9241-210:2019, 2019). However, none of the selected studies explicitly mentioned satisfaction as an ISO standard. In Appendix 4, we detail the IS acceptance and use theories that are widely used to investigate each user experience concern.
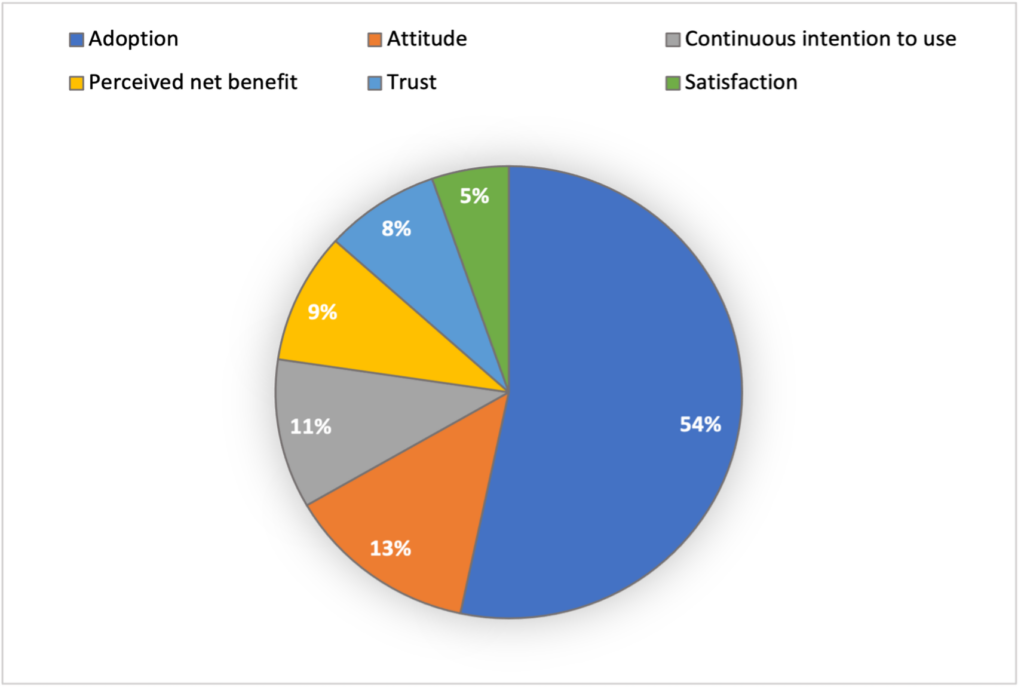
Figure 6: Frequently investigated user experience concerns.
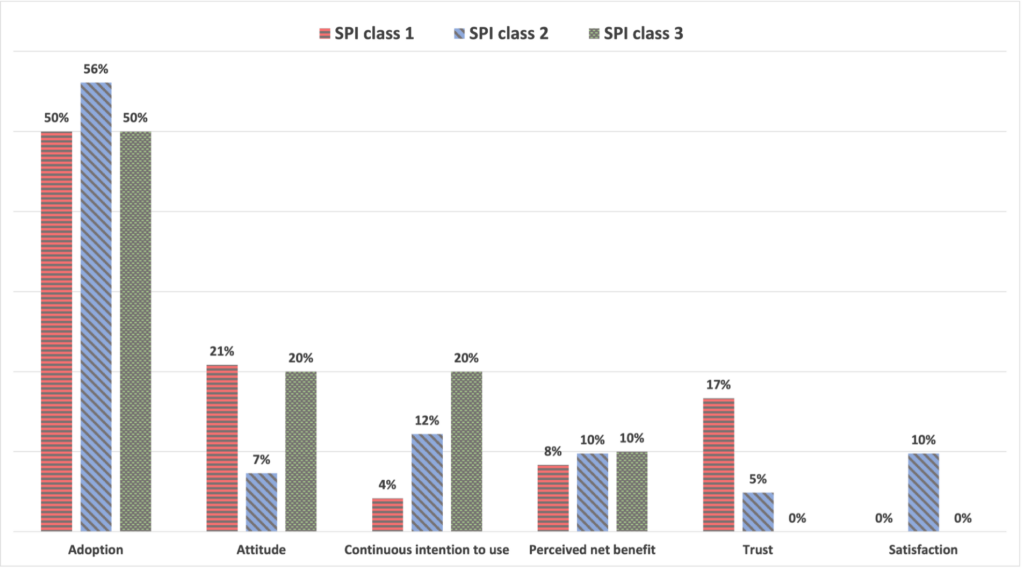
Figure 7: User experience concerns per SPI class.
RQ3: What Are the Future Recommendations to Enhance User Experience in E-government Services?
In this study, we identified many challenges that hinder users from having optimal experience in the e-government domain. Therefore, future research directions for enhancing the user experience in e-government are required to take the edge off these challenges and ensure the integrity of government sector. We completed in-depth analysis of the challenges and grouped them into categories based on their similarities. A set of 10 significant challenges were identified and categorized (Table 7). These are current challenges explicitly verbalized by the authors of the selected studies that might significantly affect user experience in e-government services.
The first challenge emerged from the difficulty of adapting to human behaviors. Human beings naturally change their behaviors and attitudes based on the given time or situation. Moreover, we have witnessed the significant increase in use of ICT systems, which will undoubtedly change our perceptions toward technology. Our concerns today could be less important tomorrow. Therefore, nine studies explicitly mentioned the necessity for conducting a longitudinal study that tracks the change of users’ behaviors and beliefs over time, which influences their experience with technology.
Table 7: Recommendations for Enhancing User Experience Practices in E-government Services
| # | Recommendations | Study ID | Count |
| 1 | Tracking change of user’s behavior over time | [5][21][25][31][45][48][52][67][72] | 9 |
| 2 | Increasing trust perception | [6][8][10][30][33][36][53][67][73] | 9 |
| 3 | Focusing on the influence of user’s demographics on their experience | [3][7][8][27][30][43][63][70] | 8 |
| 4 | In depth investigation about cultural, economic, and users’ characteristics | [8][18][36][42][59][63] | 6 |
| 5 | Mitigating security concerns | [2][21][24][30][46] | 5 |
| 6 | Increasing privacy | [2][3][21][24][46] | 5 |
| 7 | Incorporating smart technologies in government services | [15][67][69][74] | 4 |
| 8 | Providing personalized services | [43] [54] | 2 |
| 9 | Integrating service delivery | [21] | 1 |
| 10 | Generalizing services’ features | [19] | 1 |
The second challenge is trust issues with e-government services. Although many studies contributed to increasing users’ trust, a recall for more future efforts to handle trust issues was discussed in nine studies. The trust variable can be investigated and evaluated from a wide range of different disciplines that influence the user’s psychology. Therefore, it is highly recommended to study potential external and internal factors that might have influence on changing users’ trust toward either current or future systems.
After that, eight studies discussed the third challenge, which is about overlooking the high impact of user demographics such as gender, age, education level, and income. They discussed how important this information is in improving e-government services and enhancing user experience in e-government through users’ demographics. Users vary in their needs and abilities to use the technology, so researchers should pay close attention to understand the target users to provide optimal services that meet the majority of their needs. Hence, more future studies must incorporate users’ demographics in the design of e-government services to improve user experience.
The fourth challenge is issues of different cultural and societal factors affecting user experience in e-government systems. Users are more likely to change their attitudes due to their society and culture, as stated in six studies. From a psychological perspective, users are significantly influenced by different social and cultural disciplines. Future studies must consider all these aspects while designing e-government services. What is suitable for users in the USA is not necessarily the right choice for Middle Eastern users because both countries have entirely different cultural and social perspectives, which considerably influence their interaction with the delivered e-government services.
The fifth and six challenges are security and privacy issues of e-government services, as discussed in five studies. A highly protected system is still a stumbling block widely facing many researchers in different fields, not only e-government systems. The importance of cybersecurity has emerged dramatically side-by-side electronic and digital technologies in all domains. Hence, it is highly recommended to investigate updated security proposals and privacy protections to mitigate potential risks and violations which would negatively influence users’ adoption of the offered services.
The seventh challenge is the necessity of incorporating smart technology in the design and development of e-government services, which would enhance the user experience, as discussed in four studies. The world moves toward the era of a smart society that is human-centered and sustainable. We should expect in near future a plethora of new government services related to smart technologies, such as Artificial Intelligence (AI), the Internet of Things (IoT), and smart city technologies. These smart technologies provide a new level of convenience and bring governments closer to their citizens, which would drive a better society. Therefore, the next phase of e-government development should use smart technologies to ensure the automation of services and deliver a better experience to citizens.
The last three challenges are the least mentioned among the selected studies. Two studies discussed the importance of personalized services to enhance user experience in e-government systems so that, for instance, users can navigate and preview only services they are involved in instead of being overwhelmed by all offered e-government services. Other studies emphasized improving e-government services by either generalizing their features among all government sectors or developing integrated delivery channels to users.
Discussion
Enhancing user experience in e-government has been a topic of interest for many years. Although a significant amount of research investigates this topic, there are still challenges in e-government services. However, to the best of our knowledge, no previous study previewed the current aspects and variables of user experience in e-government worldwide. Our SLR study of six well-known digital libraries, using inclusion/exclusion criteria for the quality and high impact of the studies’ findings, provides valuable guidance for both researchers and practitioners to explain how to enhance user experience in e-government.
The SPI framework we used as a metric to categorize the selected studies isolates the non-economic dimensions of social performance and aims to be outcome-based by helping countries benchmark their progress more accurately. The framework allowed us to derive factors based on users’ characteristics by focusing on people and grouping them based on similar social characteristics. The SPI framework consists of three main dimensions: basic human needs, the foundation of wellbeing, and opportunity (see Figure 1). An SPI dimension of wellbeing focuses on people’s quality of life, such as access to knowledge, access to ICT, health & wellness, and environmental quality, significantly affects their experience of the offered technology. Our resulting comprehensive understanding of global user experience in e-government services helped us draw valuable conclusions that supports future research contributions.
This SLR study explains in-depth the significant factors widely adopted to evaluate and facilitate user experience in e-government for each SPI class (see Appendix 3 for glossary definitions of factors). Our literature review shows that the usefulness and usability of the offered services are considered the pillars of successful user experience in e-government despite the country’s SPI class or the service type. Our results show, in SPI Class 1, trust is the next significant factor affecting the user experience in e-government. Governments in this class should strengthen the trust relationship with their citizens. They should provide trustworthy services and incorporate transparency in their transactions to increase their citizens’ trust. In two other classes, SPI Class 2 and SPI Class 3, facilitating conditions are the next significant factor affecting user experience in e-government. Facilitating conditions identifies the degree to which users believe that the required technological infrastructure exists for enhancing the use of such a technology (Venkatesh et al., 2003), and it reflects the ability of required resources to be involved in a behavior, such as electronic systems, money, time, or other specialized facilities (Triandis, 1979). Based on the digital divide, people in these countries have limited use of technology and low quality of life, affecting their experience toward e-government services. Therefore, this factor significantly affects their overall experience of e-government.
These six user experience variables were imported from the selected studies: adoption, attitude, continuous intention to use, perceived net benefits, trust, and satisfaction. The majority of the selected studies (54%) focused on investigating how to enhance user experience in e-government from the lens of the adoption behavior. All SPI classes show adoption before other user experience concerns. E-government services should be well designed to encourage users to use them as a first step in evaluating user experience in e-government. Then, attitude and trust are the next essential behaviors of the SPI Class 1 countries. Governments need to investigate the user experience from the lens of these two behaviors to enhance their citizens’ overall experience toward e-government services. Whereas governments of the SPI Class 2 countries should investigate user experience from the lens of the continuous intention to use the e-government services, perceived net benefits, and satisfaction behaviors. Because people in this class have limited access and use of technology, governments should enhance their experience by supporting them in using the services, understanding their benefits, and being satisfied with the offered services. Finally, to enhance the user experience in e-government in the SPI Class 3 countries with a low quality of life, governments should investigate citizens’ experience from the lens of attitude and continuous intention to use. Therefore, the challenge in countries with an average to below-average quality of life that significantly affects user experience in e-government services is the continuous use of these services. Governments need to encourage citizens to feel willing to continuously use the e-government services, which would move their experience to the next level.
There is a significant digital divide among countries based on their people’s use and attitude toward technology. The United States, Canada, Australia, and some European countries have a very high quality of life, and their people have advanced skills to use technology. Whereas most countries in Asia and Africa are between average and below-average for quality of life, which would impact their people’s wellbeing and their use of technology. We believe that the digital divide significantly affects user experience in e-government services. Therefore, SPI provides an excellent perspective to analyze the selected studies, which helps us consider the digital divide among countries and investigate user experience in e-government services to each group separately.
We also discovered a significant gap between the E-Government Development Index (EGDI) and the SPI for some countries, which could have negative implications for citizens’ experience with e-government services. The EGDI measures the level of technology adopted by governments to develop and offer services to their citizens (The United Nations, 2020). Some governments may prioritize improving their infrastructure and services by adopting new and advanced technologies, but this alone is not sufficient to enhance the user experience of e-government services. The SPI measures the quality of life and the ability of people to use these technologies, and for some countries, their SPI ranking is below average and belongs to SPI Class 3. For example, Egypt has a high EGDI ranking but a low SPI ranking in Tier 6, indicating a mismatch between e-government development and the wellbeing of its citizens. To improve the user experience of e-government services, governments must prioritize narrowing the technology-life quality gap, meeting citizens’ needs, and focusing on social factors.
In addition to our main findings, we were intrigued by studies that mentioned gender in enhancing user experience in e-government among the studies that investigated the challenge of users’ demographics. Three selected research studies emphasized the gender disparities between men and women using e-government systems. Al-Shafi and Weerakkody (2010) proposed a hypothesis that the adopters of e-government would be more from male than female gender in Qatar. He proved that gender is considered one of the direct determinants that influences e-government adoption. Moreover, Mumporeze and Prieler (2017) focused solely on the gender digital divide in East Africa. She emphasized the continuance of gender disparities for using e-government systems. Her study’s findings revealed that many social, cultural, and economic factors are the reasons that hinder women’s access to ICT systems. The last study discussed barriers and issues facing the adoption of e-government systems (Akman et al., 2005). The study indicated significant gender differences in accepting and adopting e-government systems. The results emphasized that men were more likely to be lenient, or Forgiving of issues in the service, then women.
We also noticed potential challenges in gender disparities in users’ demographics affecting the adoption of e-government systems. Therefore, we conducted an initial investigation on gender disparity in the usability of e-government services in Saudi Arabia, where the recent removal of restrictions for women introduced this demographic of users to e-government services (Aldrees & Gračanin, 2021). In 2019, Saudi women widely embraced new laws that allowed them to drive, travel, and use all government systems with the same freedom as Saudi men (Jessie & Hamdi, 2019). Due to this dramatic change in Saudi women’s lives, we formed hypotheses based on user experience in Saudi e-government systems from Saudi women’s perspectives, who have recently been able to use and access systems men used for a long time. We have conducted an initial investigation on the gender disparity in the usability of Saudi e-government services, especially in the Saudi job seeking web portal Taqat® (Aldrees & Gračanin, 2021). Our findings show significant gender disparity among Saudi citizens for the usability of the web portal. Hence, further investigation on the significant factors that might influence this gender disparity while using Saudi e-government services is highly recommended.
Globally, e-government services have grown to an extent that raises the necessity of quality control. The design of e-government services must comply with a rigorous evaluation process to ensure their efficiency and effectiveness for their target users. Therefore, user experience contributes to guiding the design and development of these services by accounting for all users’ opinions and feelings of the currently offered e-government services.
This study paves the way for initial investigations of user experience in e-government. It helps better understand users and their way of thinking based on their country, so it will be easier to conduct user experience research for a given country efficiently. Hence, government decision-makers and practitioners can benefit from the results of this study by conducting empirical studies about user experience in e-government services in their countries and incorporating the proper factors associated to that country.
Conclusion
This study made two main contributions: It improves the understanding of user experience in e-government services; and the selected studies show existing research trends identifying the most common and significant factors affecting user experience in e-government services, which we categorized by the SPI class of countries. It also previews how frequently each user experience behavior was investigated in each SPI class. Finally, it discusses current challenges for user experience in e-government and provides future recommendations to mitigate them.
Knowing the factors affecting user experience in e-government as well as the user experience concerns in a given country, government practitioners can use these factors and findings to conduct in-depth investigations to understand their citizens better and improve the design of their existing e-government services. Empirical user studies have the potential to practically apply these findings as guidance to enhance user experience in e-government services.
Tips for User Experience Practitioners
Based on our systematic literature review of user experience in e-government services and our findings, we identified these tips to assist user experience practitioners:
- Understand the importance of the environmental and social constructs affecting people’s decisions and their way of thinking.
- Design e-government services based on a deeper investigation of the users’ needs and the surrounding environment.
- Employ the social progress index metric and its constructs in the user experience design of e-government services.
- Conduct a deeper investigation of user experience in e-government in specific countries using the factors and user experience concerns associated with that country.
- Focus on user experience while designing e-government services. For example, trust in government services indicates trust in the current regime or personnel from a political viewpoint. But, from the user experience viewpoint, trust in e-government services refers to the technical and human aspects and the trust in technology usage offered by the government.
- Ask carefully designed and validated questions to elicit users’ behaviors in usability testing. It is recommended to refer to experts in the field to review the questions before interacting with users.
References
Abu-Shanab, E. A. (2017). E-government familiarity influence on Jordanians’ perceptions. Telematics and Informatics, 34(1), 103–113. https://doi.org/10.1016/j.tele.2016.05.001
Ajzen, I. (1991). The theory of planned behavior. Organizational Behavior and Human Decision Processes, 50(2), 179–211. https://doi.org/10.1016/0749-5978(91)90020-T
Akman, I., Yazici, A., Mishra, A., & Arifoglu, A. (2005). E-Government: A global view and an empirical evaluation of some attributes of citizens. Government Information Quarterly, 22(2), 239–257. https://doi.org/10.1016/j.giq.2004.12.001
Akram, M. S., Malik, A., Shareef, M. A., & Awais Shakir Goraya, M. (2019). Exploring the interrelationships between technological predictors and behavioral mediators in online tax filing: The moderating role of perceived risk. Government Information Quarterly, 36(2), 237–251. https://doi.org/10.1016/j.giq.2018.12.007
Aldrees, A., & Gračanin, D. (2021). Gender disparity in the usability of e-government portals: A case study of the saudi job seeking web portal. Proceedings of the 8th International Annual Conference on Electronic Governance and Open Society – EGOSE’21, 15. https://doi.org/10.1007/978-3-031-04238-6_21
Alharbi, A. (2015). The influence of trust and subjective norms on citizens’ intentions to engage in e-participation on e-government websites. Proceedings of the Australasian Conference on Information Systems – ACIS’15, 113, 1–12.
Al-Hujran, O., Al-Debei, M. M., Chatfield, A., & Migdadi, M. (2015). The imperative of influencing citizen attitude toward e-government adoption and use. Computers in Human Behavior, 53, 189–203. https://doi.org/10.1016/j.chb.2015.06.025
Alkraiji, A., & Ameen, N. (2022). The impact of service quality, trust and satisfaction on young citizen loyalty towards government e-services. Information Technology & People, 35(4), 1239–1270. https://doi.org/10.1108/ITP-04-2020-0229
Alkraiji, A. I. (2020). Citizen satisfaction with mandatory e-government services: A conceptual framework and an empirical validation. IEEE Access, 8, 117253–117265. https://doi.org/10.1109/ACCESS.2020.3004541
Al-Nuaim, H. (2011). An evaluation framework for Saudi e-government. Journal of E-Government Studies and Best Practices, 1–12. https://doi.org/10.5171/2011.820912
Alomari, M. K., Sandhu, K., & Woods, P. (2009). E-government adoption in the Hashemite Kingdom of Jordan: Factors from social perspectives. Proceedings of the 4th International Conference for Internet Technology and Secured Transactions – ICITST’09, 1–7. https://doi.org/10.1109/ICITST.2009.5402528
Alomari, M. K., Sandhu, K., & Woods, P. (2014). Exploring citizen perceptions of barriers to e-government adoption in a developing country. Transforming Government: People, Process and Policy, 8(1), 131–150. https://doi.org/10.1108/TG-05-2013-0013
Al-Shafi, S., & Weerakkody, V. (2010). Factors affecting e-government adoption in the State of Qatar. Proceedings of the European and Mediterranean Conference on Information Systems – EMCIS’10, 1–23.
Al-Shboul, M., Rababah, O., Al-Shboul, M., Ghnemat, R., & Al-Saqqa, S. (2014). Challenges and factors affecting the implementation of e-government in Jordan. Journal of Software Engineering and Applications, 07(13), 1111–1127. https://doi.org/10.4236/jsea.2014.713098
Alshibly, H., & Chiong, R. (2015). Customer empowerment: Does it influence electronic government success? A citizen-centric perspective. Electronic Commerce Research and Applications, 14(6), 393–404. https://doi.org/10.1016/j.elerap.2015.05.003
Altayar, M. S. (2018). Motivations for open data adoption: An institutional theory perspective. Government Information Quarterly, 35(4), 633–643. https://doi.org/10.1016/j.giq.2018.09.006
Avazov, S., & Lee, S. (2020). E-government adoption in Uzbekistan: Empirical validation of the Unified Model of Electronic Government Acceptance (UMEGA). Proceedings of the 21st Annual International Conference on Digital Government Research – Dg.o ’20, 338–339. https://doi.org/10.1145/3396956.3397008
Baheer, B. A., Lamas, D., & Sousa, S. (2020). A systematic literature review on existing digital government architectures: State-of-the-art, challenges, and prospects. Administrative Sciences, 10(2), 25. https://doi.org/10.3390/admsci10020025
Bandura, A. (1989). Social cognitive theory. Annals of Child Development, 6, 1–60.
Bataineh, L., & Abu-Shanab, E. (2016). How perceptions of e-participation levels influence the intention to use e-government websites. Transforming Government: People, Process and Policy, 10(2), 315–334. https://doi.org/10.1108/TG-12-2015-0058
Belanche-Gracia, D., Casaló-Ariño, L. V., & Pérez-Rueda, A. (2015). Determinants of multi-service smartcard success for smart cities development: A study based on citizens’ privacy and security perceptions. Government Information Quarterly, 32(2), 154–163. https://doi.org/10.1016/j.giq.2014.12.004
Bélanger, F., & Carter, L. (2008). Trust and risk in e-government adoption. The Journal of Strategic Information Systems, 17(2), 165–176. https://doi.org/10.1016/j.jsis.2007.12.002
Beldad, A., de Jong, M., & Steehouder, M. (2010). Reading the least read? Indicators of users’ intention to consult privacy statements on municipal websites. Government Information Quarterly, 27(3), 238–244. https://doi.org/10.1016/j.giq.2010.01.004
Bertot, J. C., Jaeger, P. T., & McClure, C. R. (2008). Citizen-centered e-government services: Benefits, costs, and research needs. Proceedings of the 9th Annual International Digital Government Research Conference – Dg.o ’08, 137–142. DOI: 10.1145/1367832.1367858
Bhattacherjee, A. (2001). Understanding information systems continuance: An expectation-confirmation model. MIS Quarterly, 25(3), 351. https://doi.org/10.2307/3250921
Carter, L., & Bélanger, F. (2005). The utilization of e-government services: Citizen trust, innovation and acceptance factors. Information Systems Journal, 15(1), 5–25. https://doi.org/10.1111/j.1365-2575.2005.00183.x
Carter, L., Weerakkody, V., Phillips, B., & Dwivedi, Y. K. (2016). Citizen adoption of e-government services: Exploring citizen perceptions of online services in the United States and United Kingdom. Information Systems Management, 33(2), 124–140. https://doi.org/10.1080/10580530.2016.1155948
Chatterjee, S., & Kar, A. K. (2018). Effects of successful adoption of information technology enabled services in proposed smart cities of India: From user experience perspective. Journal of Science and Technology Policy Management, 9(2), 189–209. https://doi.org/10.1108/JSTPM-03-2017-0008
Chatzoglou, P., Chatzoudes, D., & Symeonidis, S. (2015). Factors affecting the intention to use e-government services. Proceedings of the Federated Conference on Computer Science and Information Systems – FedCSIS’15, 5, 1489–1498. DOI:10.15439/2015F171
Chen, J. V., Jubilado, R. J. M., Capistrano, E. P. S., & Yen, D. C. (2015). Factors affecting online tax filing – An application of the IS success model and trust theory. Computers in Human Behavior, 43, 251–262. https://doi.org/10.1016/j.chb.2014.11.017
Chen, Y., Chen, H. M., Huang, W., & Ching, R. K. H. (2006). E-government strategies in developed and developing countries: An implementation framework and case study. Journal of Global Information Management, 14(1), 23–46. https://doi.org/10.4018/jgim.2006010102
Chohan, S. R., & Hu, G. (2020). Success factors influencing citizens’ adoption of IoT service orchestration for public value creation in smart government. IEEE Access, 8, 208427–208448. https://doi.org/10.1109/ACCESS.2020.3036054
Chu, P.-Y., Hsiao, N., Lee, F.-W., & Chen, C.-W. (2004). Exploring success factors for Taiwan’s government electronic tendering system: Behavioral perspectives from end users. Government Information Quarterly, 21(2), 219–234. https://doi.org/10.1016/j.giq.2004.01.005
Chung, L., & do Prado Leite, J. C. S. (2009). On non-functional requirements in software engineering. In A. T. Borgida, V. K. Chaudhri, P. Giorgini, & E. S. Yu (Eds.), Conceptual modeling: Foundations and applications (Vol. 5600, pp. 363–379). Springer. https://doi.org/10.1007/978-3-642-02463-4_19
Cullen, R., & Reilly, P. (2007). Information privacy and trust in government: A citizen-based perspective from New Zealand. Proceedings of the 40th Hawaii International Conference on System Sciences – HICSS’07, 1–10. https://doi.org/10.1109/HICSS.2007.271
Danila, R., & Abdullah, A. (2014). User’s satisfaction on e-government services: An integrated model. Procedia – Social and Behavioral Sciences, 164, 575–582. https://doi.org/10.1016/j.sbspro.2014.11.148
Davis, F. D. (1989). Perceived usefulness, perceived ease of use, and user acceptance of information technology. MIS Quarterly, 13(3), 319–340. https://doi.org/10.2307/249008
DeLone, W. H., & McLean, E. R. (1992). Information systems success: The quest for the dependent variable. Information Systems Research, 3(1), 60–95. https://doi.org/10.1287/isre.3.1.60
DeLone, W. H., & McLean, E. R. (2003). The DeLone and McLean Model of information systems success: A ten-year update. Journal of Management Information Systems, 19(4), 9–30. https://doi.org/10.1080/07421222.2003.11045748
Detlor, B., Hupfer, M. E., Ruhi, U., & Zhao, L. (2013). Information quality and community municipal portal use. Government Information Quarterly, 30(1), 23–32. https://doi.org/10.1016/j.giq.2012.08.004
Dinev, T., Xu, H., Smith, J. H., & Hart, P. (2013). Information privacy and correlates: An empirical attempt to bridge and distinguish privacy-related concepts. European Journal of Information Systems, 22(3), 295–316. https://doi.org/10.1057/ejis.2012.23
Dong, X., Xiong, L., & Wang, W. (2011). How adoption is G2C model e-government? Proceedings of the International Conference on E-Business and E-Government – ICEE’11, 1–4. https://doi.org/10.1109/ICEBEG.2011.5881524
Downey, L. L., & Rosales, S. (2012). A brief history of user experience in government systems. In E. Buie & M. Dianne (Eds.), usability in government systems user experience design for citizens and public servants (1st ed., pp. 1–19). Elsevier, Inc.
Dwivedi, Y. K., Rana, N. P., Jeyaraj, A., Clement, M., & Williams, M. D. (2019). Re-examining the Unified Theory of Acceptance and Use of Technology (UTAUT): Towards a revised theoretical model. Information Systems Frontiers, 21(3), 719–734. https://doi.org/10.1007/s10796-017-9774-y
Fagan, M. Helen. (2006). Exploring city, county and state e‐government initiatives: An East Texas perspective. Business Process Management Journal, 12(1), 101–112. https://doi.org/10.1108/14637150610643797
Fath-Allah, A., Cheikhi, L., Al-Qutaish, R. E., & Idri, A. (2014). E-government maturity models: A comparative study. International Journal of Software Engineering & Applications, 5(3), 71–91. DOI:10.1109/CIT.2017.23
Fishbein, M., & Ajzen, I. (1975). Belief, attitude, intention, and behavior: An introduction to theory and research. Addison-Wesley Publishing Company. https://people.umass.edu/aizen/f&a1975.html
Fu, J.-R., Farn, C.-K., & Chao, W.-P. (2006). Acceptance of electronic tax filing: A study of taxpayer intentions. Information & Management, 43(1), 109–126. https://doi.org/10.1016/j.im.2005.04.001
Gant, J. P., & Gant, D. B. (2002). Web portal functionality and state government e-service. Proceedings of the 35th Annual Hawaii International Conference on System Sciences, 1627–1636. https://doi.org/10.1109/HICSS.2002.994073
Gauld, R., Goldfinch, S., & Horsburgh, S. (2010). Do they want it? Do they use it? The ‘demand-side’ of e-government in Australia and New Zealand. Government Information Quarterly, 27(2), 177–186. https://doi.org/10.1016/j.giq.2009.12.002
Grönlund, Å., & Horan, T. A. (2005). Introducing e-gov: History, definitions, and issues. Communications of the Association for Information Systems, 15, 713–729. https://doi.org/10.17705/1CAIS.01539
Hackney, R., Jones, S., & Lösch, A. (2007). Towards an e-government efficiency agenda: The impact of information and communication behaviour on e-reverse auctions in public sector procurement. European Journal of Information Systems, 16(2), 178–191. https://doi.org/10.1057/palgrave.ejis.3000677
Halchin, L. E. (2004). Electronic government: Government capability and terrorist resource. Government Information Quarterly, 21(4), 406–419. https://doi.org/10.1016/j.giq.2004.08.002
Harston, R., & Pyla, P. (2018). The UX book—Agile UX design for a quality user experience (2nd ed.). Elsevier, Inc.
Heeks, R. (2003). Most eGovernment-for-development projects fail: How can risks be reduced? (iGovernment Working Paper Series, Paper No. 14, p. 19). Institute for Development Policy and Management. https://dx.doi.org/10.2139/ssrn.3540052
Ho, A. T. (2002). Reinventing local governments and the e‐government initiative. Public Administration Review, 62(4), 434–444. https://doi.org/10.1111/0033-3352.00197
Horst, M., Kuttschreuter, M., & Gutteling, J. M. (2007). Perceived usefulness, personal experiences, risk perception and trust as determinants of adoption of e-government services in the Netherlands. Computers in Human Behavior, 23(4), 1838–1852. https://doi.org/10.1016/j.chb.2005.11.003
Hung, S.-Y., Chang, C.-M., & Kuo, S.-R. (2013). User acceptance of mobile e-government services: An empirical study. Government Information Quarterly, 30(1), 33–44. https://doi.org/10.1016/j.giq.2012.07.008
Hung, S.-Y., Tang, K.-Z., Chang, C.-M., & Ke, C.-D. (2009). User acceptance of intergovernmental services: An example of electronic document management system. Government Information Quarterly, 26(2), 387–397. https://doi.org/10.1016/j.giq.2008.07.003
Iribarren, M., Concha, G., Valdes, G., Solar, M., Villarroel, M. T., Gutiérrez, P., & Vásquez, Á. (2008). Capability maturity framework for eGovernment: A multi-dimensional model and assessing tool. In M. A. Wimmer, H. J. Scholl, & E. Ferro (Eds.), Electronic government (Vol. 5184, pp. 136–147). Springer. https://doi.org/10.1007/978-3-540-85204-9_12
ISO 9241-210:2019. (2019). Ergonomics of human-system interaction—Part 210: Human-centred design for interactive systems. ISO (International Organization for Standardization). https://www.iso.org/obp/ui/#iso:std:iso:9241:-210:ed-2:v1:en
Jessie, Y., & Hamdi, A. (2019, February 8). Saudi Arabian women finally allowed to hold passports and travel independently. CNN. https://www.cnn.com/2019/08/02/middleeast/saudi-women-travel-passport-intl-hnk/index.html
Jiang, X. (2011). Enhancing users’ continuance intention to e-government portals: An empirical study. Proceedings of the International Conference on Management and Service Science – MASS’11, 1–4. https://doi.org/10.1109/ICMSS.2011.5998967
Joshi, P., & Islam, S. (2018). E-government maturity model for sustainable e-government services from the perspective of developing countries. Sustainability, 10(6), 1882. https://doi.org/10.3390/su10061882
Kawashita, I. M. S., Baptista, A. A., & Soares, D. (2020). E-government maturity models: More of the same? 2020 Seventh International Conference on eDemocracy & eGovernment (ICEDEG), 58–66. https://doi.org/10.1109/ICEDEG48599.2020.9096697
Keoduangsine, S., & Goodwin, R. (2009). User satisfaction model for mobile e-government service. Proceedings of the 11th International Conference on Information Integration and Web-Based Applications & Services – IiWAS ’09, 609–612. https://doi.org/10.1145/1806338.1806453
Khan, G. F., & Park, H. W. (2013). The e-government research domain: A triple helix network analysis of collaboration at the regional, country, and institutional levels. Government Information Quarterly, 30(2), 182–193. https://doi.org/10.1016/j.giq.2012.09.003
Khayun, V., & Ractham, P. (2011). Measuring e-excise tax success factors: Applying the DeLone. Proceedings of the 44th Hawaii International Conference on System Sciences, 1–10. https://doi.org/10.1109/HICSS.2011.303
Kitchenham, B., & Charters, S. (2007). Guidelines for performing systematic literature reviews in software engineering (Version 2.3; EBSE 2007, p. 65). Keele University and University of Durham.
Kitchenham, B., Pearl Brereton, O., Budgen, D., Turner, M., Bailey, J., & Linkman, S. (2009). Systematic literature reviews in software engineering – A systematic literature review. Information and Software Technology, 51(1), 7–15. https://doi.org/10.1016/j.infsof.2008.09.009
Komischke, T. (2009). Integrating user experience into a software development company – A case study. In M. Kurosu (Ed.), Proceedings of the 1st International Conference on Human Centered Design—HCD’09: Vol. 5619 (pp. 221–229). Springer. https://doi.org/10.1007/978-3-642-02806-9_26
Kumar, R., Sachan, A., & Mukherjee, A. (2017). Qualitative approach to determine user experience of e-government services. Computers in Human Behavior, 71, 299–306. https://doi.org/10.1016/j.chb.2017.02.023
Lallmahomed, M. Z. I., Lallmahomed, N., & Lallmahomed, G. M. (2017). Factors influencing the adoption of e-government services in Mauritius. Telematics and Informatics, 34(4), 57–72. https://doi.org/10.1016/j.tele.2017.01.003
Lean, O. K., Zailani, S., Ramayah, T., & Fernando, Y. (2009). Factors influencing intention to use e-government services among citizens in Malaysia. International Journal of Information Management, 29(6), 458–475. https://doi.org/10.1016/j.ijinfomgt.2009.03.012
Lee, T. (David), Lee, B.-K., & Lee-Geiller, S. (2020). The effects of information literacy on trust in government websites: Evidence from an online experiment. International Journal of Information Management, 52, 1–13. https://doi.org/10.1016/j.ijinfomgt.2020.102098
Lee, T. (David), Lee-Geiller, S., & Lee, B.-K. (2020). Are pictures worth a thousand words? The effect of information presentation type on citizen perceptions of government websites. Government Information Quarterly, 37(3), 1–12. https://doi.org/10.1016/j.giq.2020.101482
Lee, T. (David), Park, H., & Lee, J. (2019). Collaborative accountability for sustainable public health: A Korean perspective on the effective use of ICT-based health risk communication. Government Information Quarterly, 36(2), 226–236. https://doi.org/10.1016/j.giq.2018.12.008
Li, H., Detenber, B. H., Lee, W. P., & Chia, S. (2005). E-government in Singapore: Demographics, usage patterns, and perceptions. Journal of E-Government, 1(3), 29–54. https://doi.org/10.1300/J399v01n03_03
Li, Q., & Osman Abdalla, E. (2014). The e-government in Sudan: Challenges, barriers and prospects. Proceedings of the International Conference on Global Economy, Commerce and Service Science – GECSS’14, Phuket, Thailand. https://doi.org/10.2991/gecss-14.2014.60
Li, Y., & Shang, H. (2020). Service quality, perceived value, and citizens’ continuous-use intention regarding e-government: Empirical evidence from China. Information & Management, 57(3), 103197. https://doi.org/10.1016/j.im.2019.103197
Lian, J.-W. (2015). Critical factors for cloud based e-invoice service adoption in Taiwan: An empirical study. International Journal of Information Management, 35(1), 98–109. https://doi.org/10.1016/j.ijinfomgt.2014.10.005
Liu, Y., Chen, Y., & Zhou, C. (2006). Exploring success factors for web-based e-government services: Behavioral perspective from end users. Proceedings of the 2nd International Conference on Information & Communication Technologies – ICTTA’06, 1, 937–942. https://doi.org/10.1109/ICTTA.2006.1684500
Liu, Y., & Zhou, C. (2010). A citizen trust model for e-government. Proceedings of the International Conference on Software Engineering and Service Sciences – ICSESS’10, 751–754. https://doi.org/10.1109/ICSESS.2010.5552260
Lowry, P. B., Spaulding, T., Wells, T., Moody, G., Moffit, K., & Madariaga, S. (2006). A theoretical model and empirical results linking website interactivity and usability satisfaction. Proceedings of the 39th Annual Hawaii International Conference on System Sciences (HICSS’06), 9. https://doi.org/10.1109/HICSS.2006.33
Mahmood, M., Osmani, M., & Sivarajah, U. (2014). The role of trust in e-government adoption: A systematic literature review. Proceedings of the 20st Americas Conference on Information Systems – AMCIS’14, 1–16. http://bura.brunel.ac.uk/handle/2438/9993
Meuter, M. L., Ostrom, A. L., Roundtree, R. I., & Bitner, M. J. (2000). Self-service technologies: Understanding customer satisfaction with technology-based service encounters. Journal of Marketing, 64(3), 50–64. https://doi.org/10.1509/jmkg.64.3.50.18024
Moher, D., Shamseer, L., Clarke, M., Ghersi, D., Liberati, A., Petticrew, M., Shekelle, P., Stewart, L. A., & PRISMA-P Group. (2015). Preferred reporting items for systematic review and meta-analysis protocols (PRISMA-P) 2015 statement. Systematic Reviews, 4(1), 9. https://doi.org/10.1186/2046-4053-4-1
Moon, M. J. (2002). The evolution of e‐government among municipalities: Rhetoric or reality? Public Administration Review, 62(4), 424–433. https://doi.org/10.1111/0033-3352.00196
Mostafa, M. M., & El-Masry, A. A. (2013). Citizens as consumers: Profiling e-government services’ users in Egypt via data mining techniques. International Journal of Information Management, 33(4), 627–641. https://doi.org/10.1016/j.ijinfomgt.2013.03.007
Mumporeze, N., & Prieler, M. (2017). Gender digital divide in Rwanda: A qualitative analysis of socioeconomic factors. Telematics and Informatics, 34(7), 1285–1293. https://doi.org/10.1016/j.tele.2017.05.014
Nam, T. (2012). Citizens’ attitudes toward open government and government 2.0. International Review of Administrative Sciences, 78(2), 346–368. https://doi.org/10.1177/0020852312438783
Navarrete, C. (2010). Trust in e-government transactional services: A study of citizens’ perceptions in Mexico and the U.S. Proceedings of the 43rd Hawaii International Conference on System Sciences – HICSS’10, 1–10. https://doi.org/10.1109/HICSS.2010.487
Nemeslaki, A., Aranyossy, M., & Sasvári, P. (2016). Could on-line voting boost desire to vote? – Technology acceptance perceptions of young Hungarian citizens. Government Information Quarterly, 33(4), 705–714. https://doi.org/10.1016/j.giq.2016.11.003
Nysveen, H. (2005). Intentions to use mobile services: Antecedents and cross-service comparisons. Journal of the Academy of Marketing Science, 33(3), 330–346. https://doi.org/10.1177/0092070305276149
Ozkan, S., & Kanat, I. E. (2011). E-government adoption model based on theory of planned behavior: Empirical validation. Government Information Quarterly, 28(4), 503–513. https://doi.org/10.1016/j.giq.2010.10.007
Papadomichelaki, X., & Mentzas, G. (2012). e-GovQual: A multiple-item scale for assessing e-government service quality. Government Information Quarterly, 29(1), 98–109. https://doi.org/10.1016/j.giq.2011.08.011
Park, R. (2008). Measuring factors that influence the success of e-government initiatives. Proceedings of the 41st Annual Hawaii International Conference on System Sciences – HICSS’08, 1–10. https://doi.org/10.1109/HICSS.2008.244
Paulk, M. C., Curtis, B., Chrissis, M. B., & Weber, C. V. (1993). Capability maturity model for software (Version 1.1). Defense Technical Information Center. https://doi.org/10.21236/ADA263403
Petersen, K., Vakkalanka, S., & Kuzniarz, L. (2015). Guidelines for conducting systematic mapping studies in software engineering: An update. Information and Software Technology, 64, 1–18. https://doi.org/10.1016/j.infsof.2015.03.007
Petticrew, M., & Roberts, H. (2006). Systematic reviews in the social sciences (1st ed.). Blackwell Publishing Ltd.
Phang, C. W., Li, Y., Sutanto, J., & Kankanhalli, A. (2005). Senior citizens’ adoption of e-government: In quest of the antecedents of perceived usefulness. Proceedings of the 38th Annual Hawaii International Conference on System Sciences – HICSS’05, 1–8. https://doi.org/10.1109/HICSS.2005.538
Pinto, H. dos S., Bernardini, F., & Viterbo, J. (2018). How cities categorize datasets in their open data portals: An exploratory analysis. Proceedings of the 19th Annual International Conference on Digital Government Research Governance in the Data Age – Dgo ’18, 1–9. https://doi.org/10.1145/3209281.3209377
Pleger, L. E., Guirguis, K., & Mertes, A. (2021). Making public concerns tangible: An empirical study of German and UK citizens’ perception of data protection and data security. Computers in Human Behavior, 122, 1–17. https://doi.org/10.1016/j.chb.2021.106830
Qureshi, H. A., Salman, Y., Irfan, S., & Jabeen, N. (2017). A Systematic Review of E-Government Evaluation. Pakistan Economic and Social Review, 55(2), 327–362.
Rana, N. P., Janssen, M., Sahu, G. P., Baabdullah, A., Dwivedi, Y. K., & Way, F. (2019). Citizens’ perception about m-government services: Results from an exploratory survey. Proceedings of the 52nd Hawaii International Conference on System Sciences – HICSS’19, 3356–3365.
Rogers, E. M. (1983). Diffusion of innovations (3rd ed.). The Free Press, Collier Macmillan.
Rotchanakitumnuai, S. (2007). The important risk factors of e-government service adoption. Proceedings of the International Conference on Wireless Communications, Networking and Mobile Computing – WiCom’07, 3652–3655. https://doi.org/10.1109/WICOM.2007.904
Rotter, J. B. (1971). Generalized expectancies for interpersonal trust. American Psychologist, 26(5), 443–452. https://doi.org/10.1037/h0031464
Salisbury, W. D., Pearson, R. A., Pearson, A. W., & Miller, D. W. (2001). Perceived security and World Wide Web purchase intention. Industrial Management & Data Systems, 101(4), 165–177. https://doi.org/10.1108/02635570110390071
Santa, R., MacDonald, J. B., & Ferrer, M. (2019). The role of trust in e-government effectiveness, operational effectiveness and user satisfaction: Lessons from Saudi Arabia in e-G2B. Government Information Quarterly, 36(1), 39–50. https://doi.org/10.1016/j.giq.2018.10.007
Schaupp, L. C., Carter, L., & McBride, M. E. (2010). E-file adoption: A study of U.S. taxpayers’ intentions. Computers in Human Behavior, 26(4), 636–644. https://doi.org/10.1016/j.chb.2009.12.017
Scholta, H., Mertens, W., Kowalkiewicz, M., & Becker, J. (2019). From one-stop shop to no-stop shop: An e-government stage model. Government Information Quarterly, 36(1), 11–26. https://doi.org/10.1016/j.giq.2018.11.010
Schooley, B., Harold, D. A., Horan, T. A., & Burkhard, R. (2011). Citizen perspectives on trust in a public online advanced traveler information system. Proceedings of the 44th Hawaii International Conference on System Sciences – HICSS’11, 1–9. https://doi.org/10.1109/HICSS.2011.100
Seddon, P. (1995). Perceived net benefit as a measure of is success and predictor of IS use. Proceedings of the International Conference on Information Systems – ICIS ’95, 354–355.
Shareef, M. A., Kumar, V., Kumar, U., & Dwivedi, Y. K. (2011). e-Government Adoption Model (GAM): Differing service maturity levels. Government Information Quarterly, 28(1), 17–35. https://doi.org/10.1016/j.giq.2010.05.006
Shyu, S. H.-P., & Huang, J.-H. (2011). Elucidating usage of e-government learning: A perspective of the extended technology acceptance model. Government Information Quarterly, 28(4), 491–502. https://doi.org/10.1016/j.giq.2011.04.002
Stiglitz, J. E. (2007). The right to know transparency for an open world (A. Florini, Ed.). Columbia University Press.
Sukmasetya, P., Santoso, H. B., & Sensuse, D. I. (2018). Current e-government public service on user experience perspective in Indonesia. Proceedings of the International Conference on Information Technology Systems and Innovation – ICITSI’18, 159–164. https://doi.org/10.1109/ICITSI.2018.8695962
Susanto, T. D., & Aljoza, M. (2015). Individual acceptance of e-government services in a developing country: Dimensions of perceived usefulness and perceived ease of use and the importance of trust and social influence. Procedia Computer Science, 72, 622–629. https://doi.org/10.1016/j.procs.2015.12.171
Susanto, T. D., Diani, M. M., & Hafidz, I. (2017). User acceptance of e-government citizen report system (a case study of City113 App). Procedia Computer Science, 124, 560–568. https://doi.org/10.1016/j.procs.2017.12.190
Susanto, T. D., & Goodwin, R. (2013). User acceptance of SMS-based e-government services: Differences between adopters and non-adopters. Government Information Quarterly, 30(4), 486–497. https://doi.org/10.1016/j.giq.2013.05.010
Tang, Z., Gong, Z., Han, X., & Peng, X. (2018). Public interest in continued use of Chinese government portals: A mixed methods study. Telematics and Informatics, 35(8), 2312–2325. https://doi.org/10.1016/j.tele.2018.09.011
The Social Progress Imperative. (2021). 2021 social progress index—Executive summary (p. 1–21). https://www.socialprogress.org/
The United Nations. (2020). E-government survey 2020 digital government in the decade of action for sustainable development (Gov No. 11, p. 364). e-Government Knowledgebase (UNeGovKB).
Tohidi, H. (2011). E-government and its different dimensions: Iran. Procedia Computer Science, 3, 1101–1105. https://doi.org/10.1016/j.procs.2010.12.179
Tolbert, C. J., & Mossberger, K. (2006). The effects of e-government on trust and confidence in government. Public Administration Review, 66(3), 354–369. https://doi.org/10.1111/j.1540-6210.2006.00594.x
Triandis, H. C. (1979). Values, attitudes, and interpersonal behavior. Nebraska Symposium on Motivation, 27, 195–259.
Tsakonas, G., & Papatheodorou, C. (2008). Exploring usefulness and usability in the evaluation of open access digital libraries. Information Processing & Management, 44(3), 1234–1250. https://doi.org/10.1016/j.ipm.2007.07.008
Venkatesh, V., Chan, F. K. Y., & Thong, J. Y. L. (2012). Designing e-government services: Key service attributes and citizens’ preference structures. Journal of Operations Management, 30(1–2), 116–133. https://doi.org/10.1016/j.jom.2011.10.001
Venkatesh, V., Morris, M. G., Davis, G. B., & Davis, F. D. (2003). User acceptance of information technology: Toward a unified view. MIS Quarterly, 27(3), 425–478. https://doi.org/10.2307/30036540
Verdegem, P., & Verleye, G. (2009). User-centered e-government in practice: A comprehensive model for measuring user satisfaction. Government Information Quarterly, 26(3), 487–497. https://doi.org/10.1016/j.giq.2009.03.005
Verkijika, S. F., & De Wet, L. (2018). E-government adoption in sub-Saharan Africa. Electronic Commerce Research and Applications, 30, 83–93. https://doi.org/10.1016/j.elerap.2018.05.012
Wang, H.-J., & Lo, J. (2010). Exploring citizens’ intention to use government websites in Taiwan: An empirical study. Proceedings of the 12th International Conference on Information Integration and Web-Based Applications & Services – IiWAS’10, 524–531. https://doi.org/10.1145/1967486.1967567
Wang, Y.-S. (2003). The adoption of electronic tax filing systems: An empirical study. Government Information Quarterly, 20(4), 333–352. https://doi.org/10.1016/j.giq.2003.08.005
Wang, Y.-S., & Liao, Y.-W. (2008). Assessing eGovernment systems success: A validation of the DeLone and McLean model of information systems success. Government Information Quarterly, 25(4), 717–733. https://doi.org/10.1016/j.giq.2007.06.002
Weerakkody, V., & Choudrie, J. (2005). Exploring e-government in the UK: Challenges, issues and complexities. Journal of Information Science and Technology, 2(2), 25–45.
Weerakkody, V., El‐Haddadeh, R., & Al‐Shafi, S. (2011). Exploring the complexities of e‐government implementation and diffusion in a developing country: Some lessons from the State of Qatar. Journal of Enterprise Information Management, 24(2), 172–196. https://doi.org/10.1108/17410391111106293
Wendler, R. (2012). The maturity of maturity model research: A systematic mapping study. Information and Software Technology, 54(12), 1317–1339. https://doi.org/10.1016/j.infsof.2012.07.007
West, D. M. (2004). E-government and the transformation of service delivery and citizen attitudes. Public Administration Review, 64(1), 15–27. https://doi.org/10.1111/j.1540-6210.2004.00343.x
Xiong, L., Wang, H., & Wang, C. (2022). Predicting mobile government service continuance: A two-stage structural equation modeling-artificial neural network approach. Government Information Quarterly, 39(1), 1–20. https://doi.org/10.1016/j.giq.2021.101654
Xu, F., Qi, Y., & Li, X. (2018). What affects the user stickiness of the mainstream media websites in China? Electronic Commerce Research and Applications, 29, 124–132. https://doi.org/10.1016/j.elerap.2018.05.001
Zahid, H., Ali, S., Abu-Shanab, E., & Muhammad Usama Javed, H. (2022). Determinants of intention to use e-government services: An integrated marketing relation view. Telematics and Informatics, 68(101778), 1–17. https://doi.org/10.1016/j.tele.2022.101778
Zhao, H., & Liu, Y. (2017). Gender differences in tourism website usability: An empirical study. In A. Marcus & W. Wang (Eds.), Proceedings of the 6th International conference on Design, User Experience, and Usability: Understanding Users and Contexts—DUXU’17: Vol. 10290 (pp. 453–461). Springer International Publishing. https://doi.org/10.1007/978-3-319-58640-3_32
Appendix 1: Selected Studies
Table 8: Selected Studies for SPI Class 1
| ID | Study reference | Model | Tier | Technology | Sample size | Country | Year |
| [1] | (Phang et al., 2005) | TAM, DOI, Perceived safety | Tier 2 | e-withdraw service | 99 | Singapore | 2005 |
| [2] | (H. Li et al., 2005) | Qualitative approach | Tier 2 | e-gov website | 1016 | Singapore | 2005 |
| [3] | (Cullen & Reilly, 2007) | Literature review | Tier 1 | e-banking services | 56 | New Zealand | 2007 |
| [4] | (Horst et al., 2007) | TAM, TPB, Perceived risk | Tier 1 | e-gov services | 238 | Netherlands | 2007 |
| [5] | (Park, 2008) | Means/Fundamental Objectives | Tier 2 | e-gov services | 210 | USA | 2008 |
| [6] | (Bélanger & Carter, 2008) | Trust | Tier 2 | e-gov services | 214 | USA | 2008 |
| [7] | (Beldad et al., 2010) | Literature reviews | Tier 1 | e-gov websites | 223 | Netherlands | 2010 |
| [8] | (Navarrete, 2010) | Trust | Tier 2 | tax filing services | 152 302 | USA Mexico | 2010 |
| [9] | (Schaupp et al., 2010) | UTAUT, Trust, Optimism bias, Perceived risk | Tier 2 | e-gov services | 260 | USA | 2010 |
| [10] | (Schooley et al., 2011) | Grounded theory | Tier 2 | traveler services | 24 | USA | 2011 |
| [11] | (Shareef et al., 2011) | GAM | Tier 1 | e-gov services | 239 | Canada | 2011 |
| [12] | (Nam, 2012) | Literature review | Tier 2 | e-gov services | 1215 | USA | 2012 |
| [13] | (Papadomichelaki & Mentzas, 2012) | Literature review | Tier 2 | e-gov services | 264 | Greece | 2012 |
| [14] | (Detlor et al., 2013) | Trust Model | Tier 1 | e-gov services | 1279 | Canada | 2013 |
| [15] | (Belanche-Gracia et al., 2015) | Literature reviews | Tier 2 | smart card | 398 | Spain | 2015 |
| [16] | (Chatzoglou et al., 2015) | Holistic approach | Tier 2 | e-gov services | 304 | Greece | 2015 |
| [17] | (Nemeslaki et al., 2016) | IS success model, TAM | Tier 2 | i-vote system | 608 | Hungary | 2015 |
| [18] | (Carter et al., 2016) | TAM, TRA | Tier 2 | e-gov services | 105 140 | USA UK | 2016 |
| [19] | (Pinto et al., 2018) | Literature review | Tier 2 | e-gov websites | 100 | USA | 2018 |
| [20] | (Lee et al., 2019) | GAM | Tier 2 | e-health services | 700 | Korea | 2019 |
| [21] | (Scholta et al., 2019) | Literature review | Tier 1 | no-stop shop | 20 | Austria Estonia Australia | 2019 |
| [22] | (Lee, Lee, et al., 2020) | TAM, SCT | Tier 2 | e-gov websites | 500 | Korea | 2020 |
| [23] | (Lee, Lee-Geiller, et al., 2020) | Literature review | Tier 2 | e-gov services | 1000 | Korea | 2020 |
| [24] | (Pleger et al., 2021) | Literature review | Tier 1 | e-gov services | 500 500 | UK Germany | 2021 |
| Note–Models’ Abbreviations: GAM–Government Adoption Model, TRA–Theory of Reasoned Action. | |||||||
Table 9: Selected Studies for SPI Class 2
| ID | Study reference | Model | Tier | Technology | Sample size | Country | Year |
| [25] | (Y.-S. Wang, 2003) | TAM | Tier 4 | tax filing | 260 | Taiwan | 2003 |
| [26] | (Chu et al., 2004) | TAM, DTPB | Tier 4 | e-tendering systems | 158 | Taiwan | 2004 |
| [27] | (Akman et al., 2005) | Literature review | Tier 4 | e-gov services | 180 | Turkey | 2005 |
| [28] | (Liu et al., 2006) | TAM, TPB, SST | Tier 4 | e-gov portals | 147 | China | 2006 |
| [29] | (Fu et al., 2006) | TAM, DTPB, Perceived risk | Tier 4 | e-tax filing | 27,208 | Taiwan | 2006 |
| [30] | (Rotchanakitumnuai, 2007) | Literature review | Tier 3 | e-gov services | 1018 | Thailand | 2007 |
| [31] | (Y.-S. Wang & Liao, 2008) | IS success model | Tier 4 | e-gov services | 119 | Taiwan | 2008 |
| [32] | (Alomari et al., 2009) | TAM, DOI, Social factors | Tier 4 | e-gov services | 400 | Jordan | 2009 |
| [33] | (Lean et al., 2009) | TAM, DOI, Trust, Culture variables | Tier 3 | e-gov services | 150 | Malaysia | 2009 |
| [34] | (Hung et al., 2009) | DTPB | Tier 4 | EDMS | 186 | Taiwan | 2009 |
| [35] | (Liu & Zhou, 2010) | TAM, CRM | Tier 4 | e-gov portals | 304 | China | 2010 |
| [36] | (Al-Shafi & Weerakkody, 2010) | UTAUT | Tier 4 | e-gov services | 1179 | Qatar | 2010 |
| [37] | (H.-J. Wang & Lo, 2010) | TPB, TAM, Trust | Tier 4 | e-gov websites | 200 | Taiwan | 2010 |
| [38] | (Shyu & Huang, 2011) | TAM | Tier 4 | gov learning website | 307 | Taiwan | 2011 |
| [39] | (Dong et al., 2011) | TAM, DOI | Tier 4 | e-gov websites | 305 | China | 2011 |
| [40] | (Jiang, 2011) | ISCM | Tier 4 | e-gov websites | 630 | China | 2011 |
| [41] | (Khayun & Ractham, 2011) | IS success model | Tier 3 | e-excise taxes | 77 | Thailand | 2011 |
| [42] | (Ozkan & Kanat, 2011) | TPB | Tier 4 | student loans | 216 | Turkey | 2011 |
| [43] | (Venkatesh et al., 2012) | Literature review | Tier 4 | smartID card | 2465 | Hong Kong | 2012 |
| [44] | (Susanto & Goodwin, 2013) | DTPB | Tier 4 | SMS based e-gov service | 589 | Indonesia | 2013 |
| [45] | (Hung et al., 2013) | DTPB | Tier 4 | m-gov services | 331 | Taiwan | 2013 |
| [46] | (Alomari et al., 2014) | Literature review | Tier 4 | e-gov services | 150 | Jordan | 2014 |
| [47] | (Danila & Abdullah, 2014) | TAM, TPB, IS success model | Tier 3 | e-gov services | 382 | Malaysia | 2014 |
| [48] | (Alshibly & Chiong, 2015) | Literature review | Tier 4 | e-gov services | 176 | Jordan | 2015 |
| [49] | (Lian, 2015) | UTAUT2, Cloud computing | Tier 4 | e-invoicing | 251 | Taiwan | 2015 |
| [50] | (Alharbi, 2015) | TPB, Trust | Tier 4 | e-gov services | 770 | Saudi Arabia | 2015 |
| [51] | (Susanto & Aljoza, 2015) | TAM | Tier 4 | e-gov services | 40 | Indonesia | 2015 |
| [52] | (Al-Hujran et al., 2015) | TAM, Trust, Culture variables | Tier 4 | e-gov services | 413 | Jordan | 2015 |
| [53] | (J. V. Chen et al., 2015) | IS success model, Trust | Tier 4 | e-gov services | 243 | Philippine | 2015 |
| [54] | (Bataineh & Abu-Shanab, 2016) | TAM UTAUT, TRA | Tier 4 | e-gov services | 247 | Jordan | 2016 |
| [55] | (Susanto et al., 2017) | DTPB | Tier 4 | e-citizen system | 156 | Indonesia | 2017 |
| [56] | (Abu-Shanab, 2017) | TAM, Security and Privacy issues | Tier 4 | e-gov services | 289 | Jordan | 2017 |
| [57] | (Lallmahomed et al., 2017) | UTAUT2, GAM | Tier 3 | e-gov services | 249 | Mauritius | 2017 |
| [58] | (Xu et al., 2018)x | Literature review | Tier 4 | mainstream media | 120 | China | 2018 |
| [59] | (Altayar, 2018) | Literature review | Tier 4 | OGD initiatives | 10 | Saudi Arabia | 2018 |
| [60] | (Tang et al., 2018) | Grounded theory | Tier 4 | e-gov services | 56 | China | 2018 |
| [61] | (Santa et al., 2019) | Literature review | Tier 4 | e-G2B services | 209 | Saudi Arabia | 2019 |
| [62] | (Y. Li & Shang, 2020) | Means-end chain, Quality of Service, ISCM | Tier 4 | e-gov services | 1650 | China | 2020 |
| [63] | (A. I. Alkraiji, 2020) | IS success model, TAM, Trust | Tier 4 | e-gov services | 780 | Saudi Arabia | 2020 |
| [64] | (Avazov & Lee, 2020) | UMEGA | Tier 4 | e-gov services | 216 | Uzbekistan | 2020 |
| [65] | (Xiong et al., 2022) | IS success model, TAM, Trust | Tier 4 | m-gov services | 355 | China | 2022 |
| Note–Models’ Abbreviations: DTPB–Decomposed Theory Planned Behavior, CRM–Customer Relationship Management, ISCM–IS Continuance Model, UMEGA–Unified Model of Electronic Government Adoption, GAM–Government Adoption Model, TRA–Theory of Reasoned Action. | |||||||
Table 10: Selected Studies for SPI Class 3
| ID | Study reference | Model | Tier | Technology | Sample size | Country | Year |
| [66] | (Keoduangsine & Goodwin, 2009) | User characteristics, Quality of Service | Tier 6 | m-gov services | 150 | Laos | 2009 |
| [67] | (Mostafa & El-Masry, 2013) | TAM, DOI, TPB | Tier 5 | e-gov services | 776 | Egypt | 2013 |
| [68] | (Kumar et al., 2017) | Interpretivist approach | Tier 5 | e-gov services | 31 | India | 2017 |
| [69] | (Chatterjee & Kar, 2018) | Literature reviews | Tier 5 | smart cities services | 290 | India | 2017 |
| [70] | (Mumporeze & Prieler, 2017) | Literature review | Tier 6 | e-gov services | 30 | East Africa | 2017 |
| [71] | (Verkijika & De Wet, 2018) | UMEGA, UTAUT, UTAUT2 | Tier 6 | e-gov services | 282 | Africa | 2018 |
| [72] | (Akram et al., 2019) | ECM-ISC, TPB, Perceived risk, Demographics | Tier 6 | e-tax systems | 409 | Pakistan | 2019 |
| [73] | (Rana et al., 2019) | Literature review | Tier 5 | m-gov services | 81 | India | 2019 |
| [74] | (Chohan & Hu, 2020) | IS success model, TAM, Trust | Tier 6 | e-gov services | 289 | Pakistan | 2020 |
| [75] | (Zahid et al., 2022) | DTPB | Tier 6 | digital government | 396 | Pakistan | 2022 |
| Note–Models’ Abbreviations: DTPB–Decomposed Theory Planned Behavior, UMEGA–Unified Model of Electronic Government Adoption, ECM-ISC–Expectation Confirmation Model IS Continuance. | |||||||
Appendix 2: Merging Variable Names
This appendix lists the categorization pattern for the user experience outcome variables to efficiently answer RQ2.
| Studies | User experience variable | Merged/Modified variable | Total |
| [1][6][9][16][17][18][20] [33][37][39][52][55][75] | Intention to use | Adoption | 40 |
| [4] | Intention to adopt | ||
| [7] | Intention to read | ||
| [8] | Utilization of e-government | ||
| [11] | Government adoption | ||
| [14][27] | Use | ||
| [25][29][49][57][64][71] | Behavioral intention | ||
| [30][32][67][69] | Adoption | ||
| [34][42][45] | Intention | ||
| [36] | E-government use behavior | ||
| [38] | Actual use | ||
| [44][51] | Usage intention | ||
| [50] | Intention to engage | ||
| [54] | Intention to participate | ||
| [59] | Government adoption | ||
| [70] | Usage and accessibility | ||
| [2][12][21][68] | Attitude | Attitude | 10 |
| [13][24][46][73] | Perception | ||
| [26][28] | Behavior | ||
| [15][40][60] | Continuous intention to use | Continuous intention to use | 8 |
| [58] | User retention | ||
| [62][65][72] | Continuous intention | ||
| [66] | Continue use | ||
| [5][48] | Success of e-government | Perceived net benefits | 7 |
| [23] | Perceived usefulness | ||
| [31][53] | Perceived net benefits | ||
| [41] | Net benefits | ||
| [74] | Perceived value | ||
| [10] | Trust in information systems | Trust | 6 |
| [3][22][56] | Trust in e-government | ||
| [35] | Citizen trust | ||
| [19] | Transparency | ||
| [43][47][61] | User satisfaction | Satisfaction | 4 |
| [63] | Perceived citizen satisfaction |
Appendix 3: Glossary of Factors
This appendix provides a brief definition of every factor mentioned in this study.
Table 11: Glossary of UX Factors
| Factor | Definition | Model | Reference |
| Perceived usefulness | The degree to which a person believes that using a particular system will enhance his or her job performance. | TAM | (Davis, 1989) |
| Perceived ease of use | The degree to which a person believes that using a particular system will be free of effort. | ||
| Perceived trust | One’s general propensity to trust others. | Trust | (Bélanger & Carter, 2008) |
| Perceived risk | One’s subjective expectation of suffering a loss in pursuit of a desired outcome. | ||
| Trust in government | One’s perception regarding the integrity and ability of the agency providing the service. | ||
| Trust in the internet | An individual’s perception of an institutional environment, including the structures and regulations that make the environment feel safe. | ||
| Perceived privacy | An individual’s self-assessed state in which external agents have limited access to information about him or her. | — | (Dinev et al., 2013) |
| Perceived security | The perceived extent to which one can transmit sensitive information securely over the web. | — | (Salisbury et al., 2001) |
| Social influence | The degree to which an individual perceives that important others believe he or she should use the new system. | UTAUT | (Venkatesh et al., 2003) |
| Facilitating conditions | The degree to which an individual believes that an organizational and technical infrastructure exists to support use of a system. | ||
| System quality | A measure of technical success that refers to desirable characteristics of an information system; for example: ease of use, system flexibility, system reliability, ease of learning, and response times. | IS success | (DeLone & McLean, 2003) |
| Information quality | A measure of semantic success that refers to desirable characteristics of system outputs, such as management reports and webpages, covering, for example, relevance, understandability, accuracy, and usability. | ||
| Service quality | The quality of the support that system users receive from an IS department and IT support personnel; for example: responsiveness, accuracy, reliability, and technical competence. | ||
| Satisfaction | The extent to which an application helps the user create value for internal or external customers. | ||
| Perceived behavior control | The individual’s intention to perform a given behavior. | TPB | (Ajzen, 1991) |
| Self-efficacy | Judgment of how well one can execute a course of action required to deal with a prospective situation. | ||
| Internet experience | A composition of both the generalized experience of using the internet medium as well as the specific interactions of the user on the website. | — | (Nysveen, 2005) |
| Transparency | The degree to which information is available to outsiders that enables them to have informed voice in decisions and/or assess the decisions made by insiders. | — | (Stiglitz, 2007) |
Appendix 4: A List of Theoretical Frameworks
This appendix details the Information Systems (IS) acceptance and use theories that are widely used to investigate each user experience concern in e-government identified in this study. We analyzed the significant factors included in RQ1. We then linked each factor to the theory to which it belongs. Some factors can be found repeatedly in more than one theory because some theories are extended versions or combinations of others. Table 12 lists all the theories and models mentioned in RQ1 to show which theories are more suitable to the user experience concerns mentioned in the RQ2.
Table 12: Theories and Models Used to Investigate User Experience Variables
| Adoption | Attitude | Continuous intention to use | Perceived net benefit | Trust | Satisfaction | |
| TAM (Davis, 1989) | ✓ | ✓ | ✓ | ✓ | ✓ | ✓ |
| Trust (Bélanger & Carter, 2008) | ✓ | ✓ | ✓ | ✓ | ✓ | |
| IS success model (DeLone & McLean, 1992) | ✓ | ✓ | ✓ | ✓ | ||
| UTAUT (Venkatesh et al., 2003) | ✓ | ✓ | ✓ | |||
| DOI (Rogers, 1983) | ✓ | ✓ | ||||
| TPB (Ajzen, 1991) | ✓ | ✓ | ||||
| SST (Meuter et al., 2000) | ✓ | ✓ | ✓ | |||
| SCT (Bandura, 1989) | ✓ |