
Abstract
Car-sharing system users generally rent a vehicle for a brief amount of time, and they often do not take enough time to learn the controls and functions of a car that they are unfamiliar with.
The purpose of this study is to understand the difficulty of controlling a car’s functions while driving an unfamiliar car and to redesign controls to improve safety and usability. This study focuses on the secondary controls, such as those for the audio system and temperature system.
Fifteen participants were asked to perform simple tasks while driving two different cars: one was their own car and another was a car rented from Zipcar. The participants tended to glance at the controls more often (we counted how many times the participants’ glanced at a control) and spent more time completing the tasks in a car rented from Zipcar compared to their own car.
Two sets of prototypes (one set was for the center fascia and the other was for the steering wheel) were developed, and a usability study was conducted in a driving simulator to evaluate the usability of the prototypes. We used an eye-tracking device and conducted semi-structured interviews for both studies.
The results of the usability study indicate that the participants tended to have less difficulty completing tasks using the prototypes in their own personal car when compared to performing the same tasks using a rented Zipcar. Also, the location of controls on the steering wheel and center fascia is recommended for consideration when designing sharing-friendly vehicles. Recommendations regarding the location of controls, such as volume control on the steering wheel, are included in this paper. Pros and cons of using eye tracking and driving simulators are also discussed in this paper.
Keywords
car sharing, eye tracking, car interaction design, usability test, user preference, car interior, design research, industrial design, interface design
Introduction
The sharing economy, accessing goods and services that people need and paying short-term fees for that access, is growing rapidly and expected to outpace the traditional rental sector as shown in Figure 1 (Chen, 2009). Car sharing has become a worldwide phenomenon (Bardhi & Eckhardt, 2012). For more than 20 years, Switzerland and Germany have embraced car sharing, making it a popular alternative to car ownership (Bardhi & Eckhardt, 2012). According to the Transportation Sustainability Research Center at the University of California at Berkeley, there are approximately 4.8 million individuals sharing more than 104,000 vehicles across the globe (Lane, Zeng, Dhingra, & Carrigan, 2015). According to Navigant Consulting, global car sharing was predicted to be a $1 billion industry in 2013 and expected to grow to $6.2 billion by 2020.
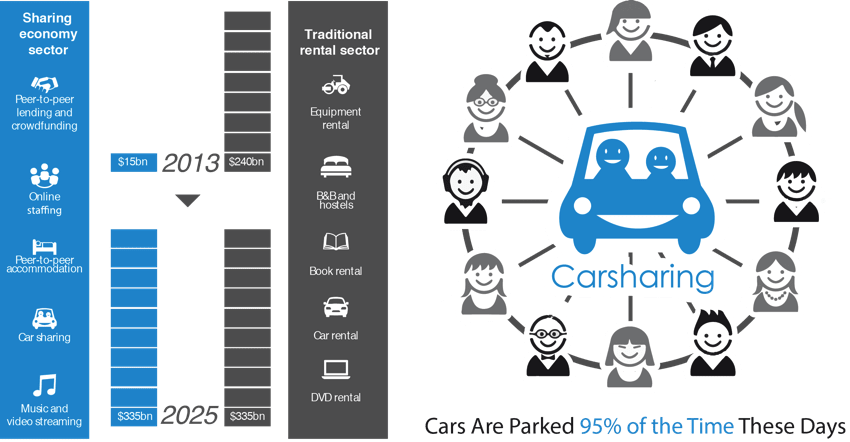
Figure 1. Importance of sharing economy and car sharing. Note: Data visualizations in Figure 1 were generated by Byungsoo Kim (2016) from data provided by original sources[1].
Previous Studies
There are a number of previous studies regarding interaction design for drivers. A recent trend in automotive in-vehicle design is the inclusion of touch screens. As the display in a vehicle becomes larger, it includes an “increasing amount of functionality” (Rümelin & Butz, 2013, p. 48). Touch screens were initially installed for navigations systems and were expanded to include in-vehicle information systems and now are being extended to integrate connected car information (Rümelin & Butz, 2013). Screens in cars have been effectively providing information and entertainment (infotainment systems; Demers, 2005). However, due to the nature of a screen instead of a tangible interaction method, the touch screen does not provide enough haptic feedback for the driver to easily find them by touch and control them without looking. The lack of tactile feedback associated with touch screens can have a negative effect on “mental load and interrupt ability” (Rümelin & Butz, 2013, p. 48).
Because of the distraction of controlling a touchscreen while driving, the car industry is now searching for alternative interaction designs. There are some studies related to improving usability of interaction designs for drivers. An experiment to minimize the visual attention during interactions to maintain the driver’s focus on the road found that physical elements around the screen space were useful in helping drivers control the associated functions (Rümelin & Butz, 2013). When assessing how older people and younger people performed several tasks in actual driving conditions, some design factors improved visibility and controllability by older drivers. As a result, several design guidelines were proposed including cluster color and font, display location, and HVAC control type (Ryu et al., 2009). There is a study examining how drivers experience haptic feedback in a car while they are engaged in different communication situations (Väänänen-vainio-mattila et al., 2014). The results indicated that vibration was the most pleasant and familiar type of feedback. Pneumatic feedback was perceived as “novel, interesting, and even fun, but not always interpretable” (p. 251) Because the participants in the study did not drive a car while performing tasks, future studies examining participants driving while performing tasks will be necessary. For participant’s safety and to prevent potential accidents, conducting a study in an empty parking lot or using a driving simulator would be the most appropriate method for future studies. Regarding driver distraction, reducing the number of steps for driver assistance systems and in-vehicle information systems by providing “preconfigured functions” based on personal preferences was found to be beneficial (Siegmund, Altmüller, Bengler, & Gmbh, 2013). It was summarized as a structure for “personalized situation-adaptive user interaction” which would be one of the most important emerging trends for car interaction design.
These reviews illustrate that various interaction design methods for drivers have been applied and studied in cars to help improve the usability of the secondary controls while driving. However, there has not been a study investigating interaction design focusing on the needs of the user/driver within the car sharing context.
Distraction While Driving a Car
There are many distractions for drivers while driving (Strayer, Watson, & Drews, 2011). The distractions can be categorized in the following three areas:
- visual distraction—tasks that require drivers’ attention to leave the road to visually obtain information
- manual distraction—tasks that require drivers to take their hands off the steering wheel in order to control a device or function
- cognitive distraction—tasks that include thinking about something other than driving (NHTSA, 2010)
Typically, distractions for drivers included talking to passengers, eating, drinking, lighting a cigarette, shaving, applying makeup, and listening to the radio (Strayer et al., 2011). Because car-sharing system users check out cars only when they need to drive, there is a chance that they will rent different cars each time. Also, because they check out a car for a short period of time, users may not take the time to familiarize themselves with the controls. Thus, they might start driving and figure out how to use the controls while driving; this may result in a combination of visual, manual, and cognitive distractions. These distractions for the drivers using car-sharing systems are in addition to traditional distractions.
This project consisted of two studies and a control design development. The first study assessed current conditions associated with driving cars from a car-sharing system and was conducted on the road. Based on the findings of the first study (Study 1), secondary car controls were redesigned and tested in a second lab-based study using a driving simulator (Study 2). The studies and redesigned controls are described in the following sections.
Purpose of Study 1
The purpose of Study 1 is to understand how drivers control the most frequently-used secondary functions while driving a car using a car-sharing system (that they are not familiar with). The secondary functions, such as those for the audio system and heating and cooling systems (HVAC), are located in different areas and have different types of controls; use of these controls are expected to cause distractions for car sharing users. For this reason, this study focuses on secondary controls.
Methods
This study adopted a 2 x 4 within-subject design. There were two factors: car type (two levels: own car and Zipcar) and in-vehicle task (four levels: turning on the radio/audio, selecting a radio station/music, controlling the audio volume, and controlling the HVAC). Both factors were varied by participant, meaning that each participant drove both types of cars and completed the four tasks in each car.
Study 1 involved completing two 5-minute driving tasks followed by a 10- to 15-minute interview. For each car type, the participant’s car and a car rented from Zipcar, there were 10 minutes of setup time (5 minutes to adjust mirrors, seat, etc. and 5 minutes for eye tracking device calibration). Two data collection methods were used in Study 1: direct observations and semi-structured interviews. Direct observations, also referred to as observational studies, allow the researcher to observe participants in an environment and collect data about their behaviors, actions, and activities (Holmes, 2013). Direct observations were conducted twice for each participant: in the participant’s car and in a vehicle rented by the experimenter. The purpose of the direct observation was to understand the difficulty the participants might have in controlling the secondary functions during an actual driving situation when in a car with which they were unfamiliar as compared to their own (familiar) car.
Eye tracking has been widely used to analyze eye movement—especially related to driving safety (Kapitaniak, Walczak, Kosobudzki, Jóźwiak, & Bortkiewicz, 2015). An EyeGuide eye tracking device, similar to a large set of headphones with a sensor located on the side of the participant’s face to record the driving situation, was used during Study 1. Eye tracking data was collected during the direct observations to record the participants’ eye movements.
After the participant had driven both cars, a semi-structured interview was conducted in the second car immediately after completing the final driving task so that the participants could vividly describe their experience. The interviewer generally followed an interview guide; however, when appropriate, the interviewer adapted questions to respond to the participant’s experience and description (Cohen & Crabtree, 2006).
Measurements
Two measurements were calculated from the eye tracking data: number of glances (NUMGLANCES) and task completion time (TASKTIME). These measurements were used to compare the result of direct observation. NUMGLANCES was defined as the number of times a participant moved his/her gaze away from the road and took a glance at the in-vehicle controls to complete a task. For instance, when the participant glanced three times at the interface to control the volume while driving, the NUMGLANCES for completing the controlling volume task was three.
TASKTIME was defined as the amount of time that a participant spent completing each task. More specifically, the TASKTIME was measured from the first moment that the participant glanced at the interface when starting a task until the last moment that the participant’s hand was removed from contact with the interface after completing the task. Sometimes participants took a glance even after completing the task. In that case, TASKTIME is calculated from the first glance to the final glance because the final glance may have been to verify that the task was accomplished correctly. The NUMGLANCES and TASKTIME for the same task between the two car types, driving their own car and driving a rented car, were compared.
Participants
While the suggested minimum number of participants for basic findings for usability studies is four or five (Robert, 1992), 15 participants were recruited from a university campus. The sample size was determined using a power calculation based on an initial data set with five participants. All participants had at least three years of driving experience, with no history of epilepsy, affirmed that they had not been drinking alcohol within the past 24 hours, were not taking medication that could result in sleepiness, and were not sleepy or too tired to drive at the time of the experiment. Every participant also affirmed that his/her car had passed inspection within the past year and had current insurance. Among the 15 participants, three did not complete some task conditions in their own cars, resulting in a total of 12 participants in the study with complete data. The participants were instructed to perform certain driving tasks before starting to drive their car. To mitigate interference with their natural driving routine, the researcher did not instruct the participants to perform the tasks while driving. Hence, some of the participants forgot to perform a few tasks. The researcher did note the tasks that were forgotten. After the participants did not complete a couple of the tasks in their own cars. These 12 participants were included in the final analysis. A summary of participant demographics is shown in Table 1.
Table 1. Demographics of Participants in Study 1 and Study 2
|
|
Study 1* |
Study 2** |
|||
|
Characteristics |
Frequency |
Percentage |
Frequency |
Percentage |
|
|
Gender |
Males |
7 |
58.3% |
8 |
61.5% |
|
Females |
5 |
41.7% |
5 |
38.5% |
|
|
Age |
24-32 |
9 |
75.0% |
9 |
69.2% |
|
33-39 |
1 |
8.3% |
2 |
15.4% |
|
|
40-46 |
2 |
16.7% |
2 |
15.4% |
|
|
Years of driving experience |
4-12 |
8 |
66.7% |
8 |
61.5% |
|
13-21 |
1 |
8.3% |
2 |
15.4% |
|
|
22-30 |
3 |
25.0% |
3 |
23.1% |
|
* n = 12 participants
**n = 13 participants
Note. Only participants with complete data were included in the analyses. Thus, while 15 participants were recruited for each study, only 12 of the 15 participants in Study 1 and 13 of the 13 participants in Study 2 had complete data sets.
Apparatus
Study 1 was conducted in a large empty parking lot. A rented Zipcar vehicle and the participants’ cars were used to compare the user experiences of performing tasks in a familiar car and in an unfamiliar car. An eye tracking device similar to a larger set of headphones with a sensor was used to record the participant’s eye movement while driving. Two GoPro cameras were used to document the usage of the secondary controls.
Procedure
The researcher rented a car, and the participant met the researcher at an empty parking lot with their own car at a scheduled time. The participant was required to present his/her valid driver’s license to the researcher. The researcher and the participant then got into either the participant’s car or the rented car parked in the empty parking lot and informed consent was provided by the participant.
After providing informed consent, two GoPro cameras were placed in the front and rear of the car using suction cups. These two cameras were positioned slightly overhead so that they did not obstruct the participant’s line of sight. To avoid sound isolation, the eye tracking device was positioned so that it did not cover the participant’s ear canal (see Figure 2).
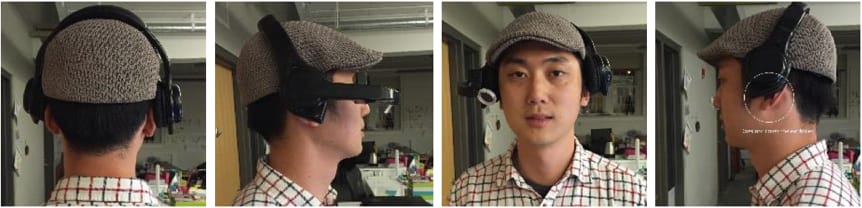
Figure 2. Images of how to wear the eye tracking device (Study 1).
Because participants were anticipated to rapidly move their heads (e.g., looking over their shoulder) for contextual awareness, a headband was used to secure the eye tracking device. The eye tracking device was calibrated in each car. After the calibration, the participants were instructed to perform the following four simple tasks while driving:
- turning on the radio/audio
- selecting a radio station/music
- controlling the audio volume
- controlling the HVAC
To replicate a natural driving experience, the participant was asked to drive naturally and perform the tasks based on the participant’s daily routine, regardless of the order. The participants were then asked to start driving the car in the parking lot. After the participant completed the first set of driving tasks with the car, the participant was asked to move to the other car. The two GoPro cameras were moved to the same front and rear locations in the second car; the participant was still wearing the eye tracking device. The eye tracking device was calibrated again once the participant was seated in the second car.
The participant was asked to perform the same simple tasks (turning on the radio, selecting the radio station, controlling the radio volume, and controlling the HVAC) as those completed while driving the first car. After the participant completed the driving task with the second car, the participant was interviewed regarding their driving experience (see Figure 3).
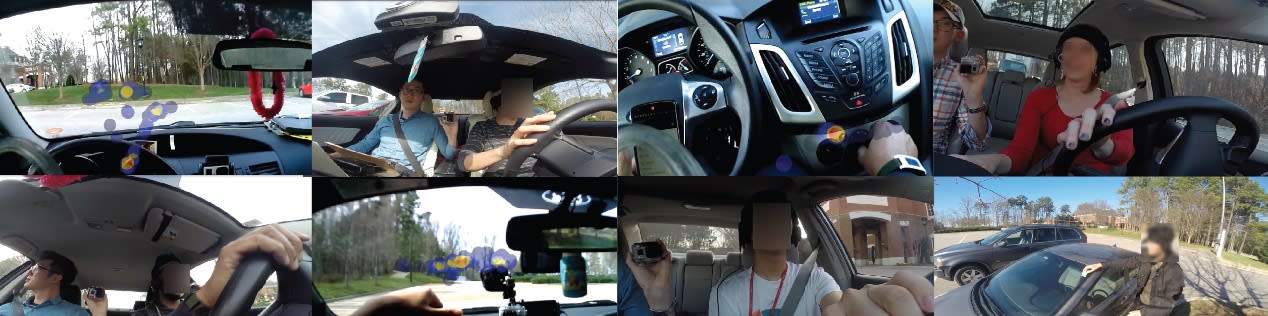
Figure 3. Snapshots of tasks, equipment, and a visual heat map in Study 1.
To mitigate order effects in Study 1, the order in which participants drove the cars (personal or rented) was randomized. This randomization did not result in a completely counterbalanced design. Therefore, the mean of the TASKTIMEs (using 1 standard deviation for the range of comparison) was assessed to compare the order of car use. No significant differences were found based on car use order. Participants chose to control some functions, such as the audio volume, either from the steering wheel controls or center fascia controls based on their preference, and the data from the chosen controls were collected.
After completing the driving tasks, participants were asked to participate in a 10- to 15-minute interview. During the interview, participants described the differences between the cars and the difficulty they experienced while performing tasks with the rented car.
Results
The same type of car (4-door sedan with automatic transmission) from three different car brands (Ford, Honda, and Hyundai) was rented from Zipcar for Study 1. For the participants’ own cars, there were two different types (4-door SUV and 4-door sedan both with automatic transmissions) from 7 different car brands (Ford, Honda, Hyundai, Jeep, Kia, Toyota, and Volvo).
SPEED (Inverse of TASKTIME)
To stabilize variance, TASKTIME was transformed into speed (SPEED) using an inverse transformation (SPEED = 1/task time; Whelan, 2008). A greater SPEED value indicates faster task completion. SPEED data was analyzed using a repeated-measure analysis of variances (rmANOVA). There were two within-subject factors: car type and task. There was a significant main effect of car type, F(1,11) = 35.81, p < .001, as participants were much faster in their own car (M = .35) than in a Zipcar (M = .16). Overall, SPEED did not vary significantly among tasks (turning on the radio/audio, .29; selecting a radio station, .20; controlling the audio volume, .29; controlling the HVAC, .23), F(3,33) = 1.61, p = .205. The interaction between car type and task was not significant, F(3,33) = .68, p = .570. A summary of means and data range of both TASKTIME and transformed SPEED are provided in Table 2. Illustration of data in its raw form, TASKTIME, is provided in Figure 4.
NUMGLANCES
Data on NUMGLANCES was analyzed using a repeated-measure analysis of variances (rmANOVA). There were two within-subject factors: car type and task. There was a significant main effect of car type, F(1,11) = 24.52, p < .001, as participants performed the tasks with many fewer glances in their own cars (1.60) compared to in the Zipcar (3.85). Overall, NUMGLANCES did not vary significantly among tasks (turning on the radio/audio, 3.17; selecting a radio station, 3.17; controlling the audio volume, 1.96; controlling the HVAC, 2.63), F(3,33) = 1.83, p = .160. The interaction between car type and task was not significant (Figure 5), F(3,33) = 1.51, p = .229. A summary of means and data range is provided in Table 2.
Estimated marginal means from rmANOVA are visualized to compare the different driving experiences (see Figure 4 and Figure 5).
Table 2. TASKTIME, SPEED, and NUMGLANCES in Study 1
|
Task |
Participant’s car** |
Rented car from Zipcar** |
||||
|
Avg. TASKTIME* [min, max] |
Avg. [min, max] |
Avg. NUMGLANCES [min, max] |
Avg. TASKTIME* [min, max] |
Avg. [min, max] |
Avg. NUMGLANCES [min, max] |
|
|
1. Turning on the radio/audio |
3.17 [1.00, 8.00] |
0.41 [0.13, 1.00] |
1.50 [1.00, 2.00] |
12.83 [3.00, 38.00] |
0.17 [0.03, 0.33] |
4.92 [1.00, 13.00] |
|
2. Selecting a radio station/music |
5.75 [2.00, 16.00] |
0.25 [0.06, 1.14] |
2.00 [1.00, 4.00] |
13.42 [4.00, 29.00] |
0.11 [0.03, 0.25] |
4.50 [2.00, 9.00] |
|
3. Controlling the audio volume |
3.92 [1.00, 7.00] |
0.33 [0.14, 1.00] |
1.50 [1.00, 3.00] |
6.00 [2.00, 19.00] |
0.23 [0.05, 0.50] |
2.50 [1.00, 7.00] |
|
4. Controlling the HVAC |
4.25 [1.00, 7.00] |
1.19 [0.14, 1.00] |
1.75 [1.00, 4.00] |
10.33 [4.00, 22.00] |
0.13 [0.05, 0.25] |
3.50 [1.00, 9.00] |
|
Average |
4.27 [1.25, 9.50] |
0.55 [0.12, 0.88] |
1.69 [1.00, 3.25] |
10.65 [3.25, 27.00] |
0.16 [0.04, 0.33] |
3.85 [1.25, 9.50] |
* Time presented in seconds
** n = 12 participants
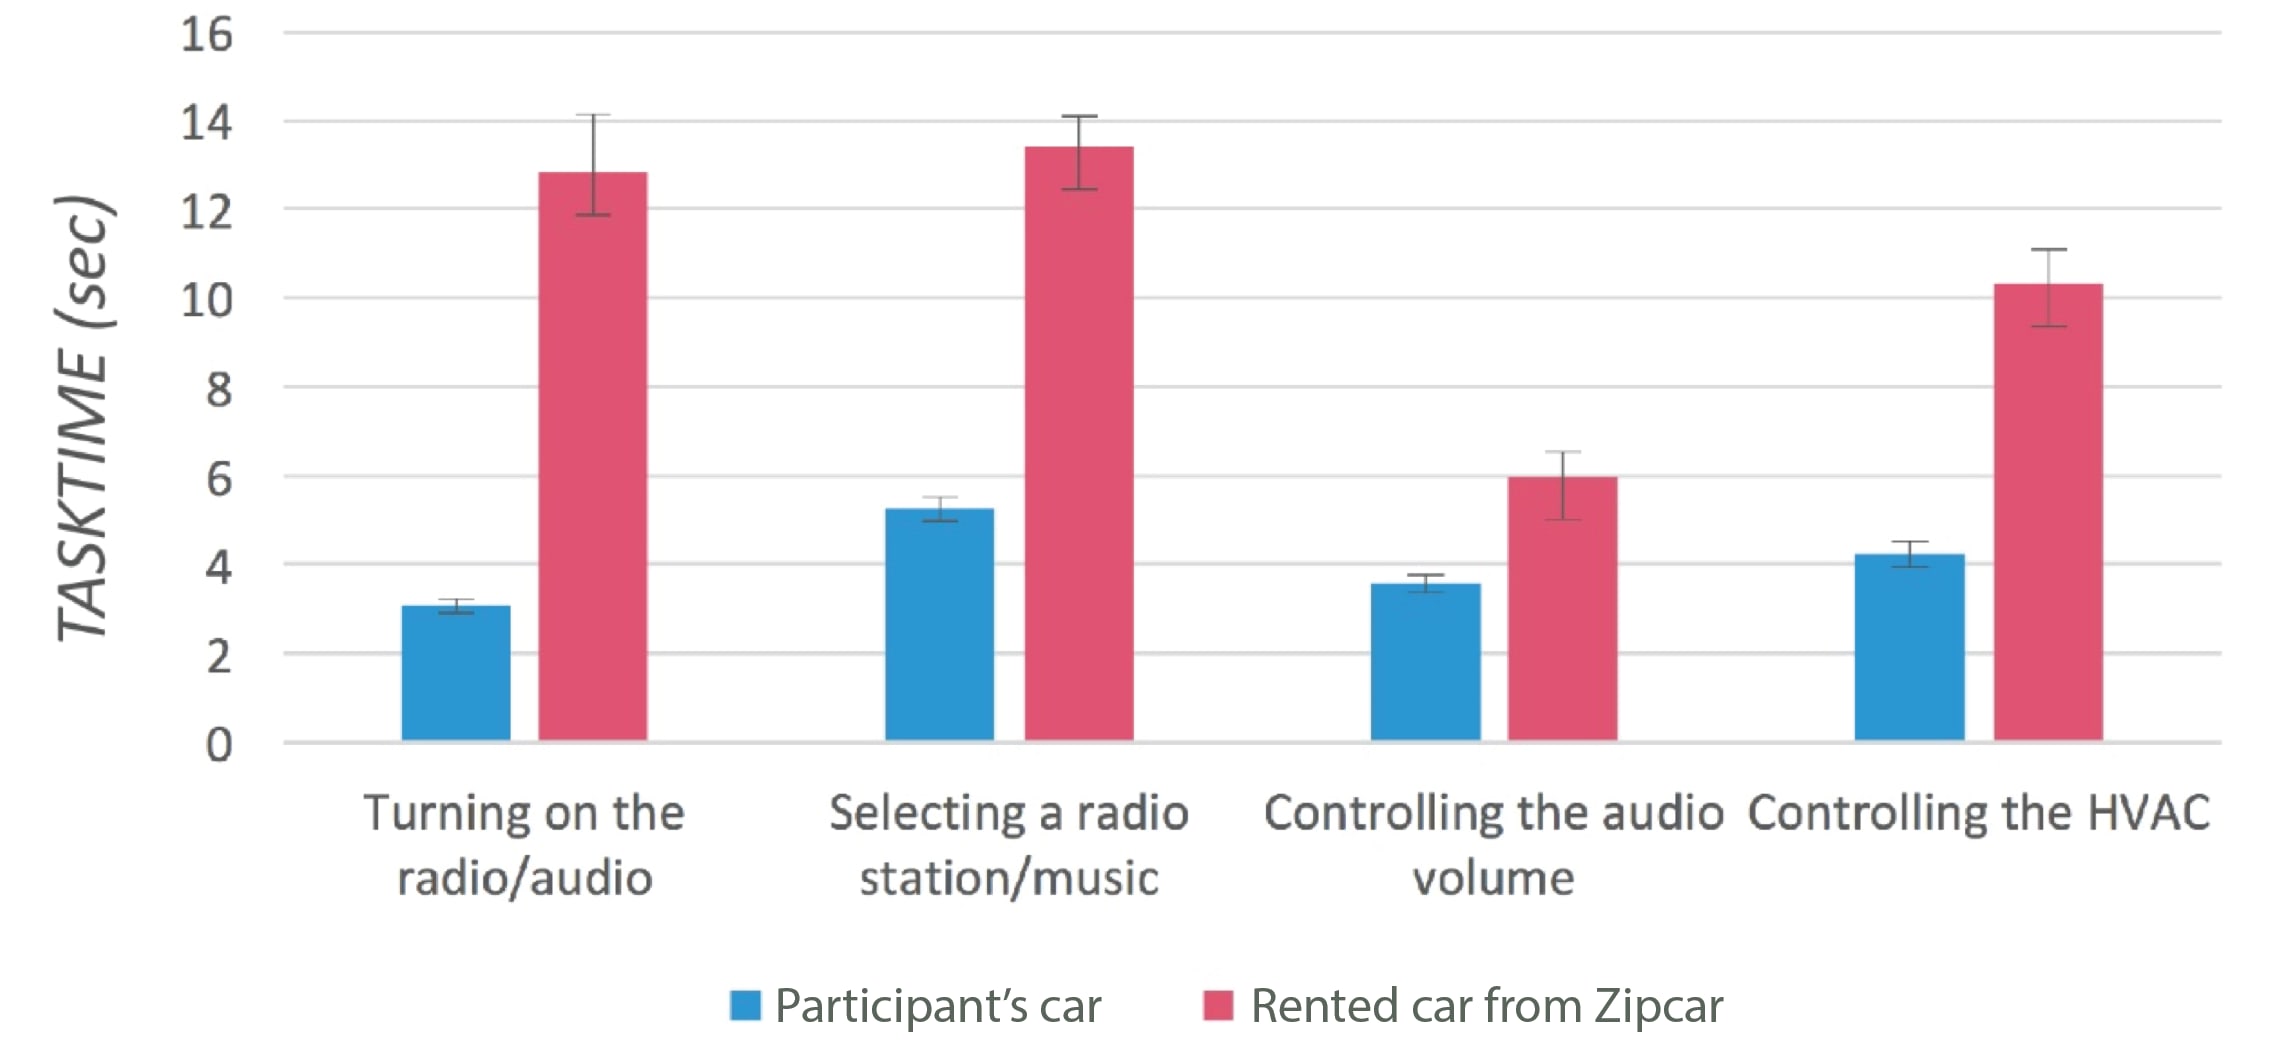
Figure 4. TASKTIME across four tasks in participants’ cars or rented cars in Study 1. Error bars represent +/- 1 standard error.
Figure 5. NUMGLANCES across four tasks in participants’ cars or rented cars in Study 1. Error bars represent +/- 1 standard error.
Based on the data presented in Table 2, the results from the direct observation indicated the following (because TASKTIME is easier to compare and understand than SPEED, TASKTIME is used to describe the differences between the two car types instead of SPEED):
- Averaging TASKTIME across tasks, the TASKTIME was 149.4% longer when participants were driving the rented car compared to their own car.
- Averaging NUMGLANCES across tasks, the average NUMGLANCES was 127.8% greater when participants were driving the rented car compared to their own car.
- The average TASKTIME for each of the tasks were longer (at least 53.1% more) with the rented car.
- The average NUMGLANCES for each of the tasks were greater (at least 66.7% more) with the rented car.
- For TASKTIME, there were several interesting differences that were observed at the participant level:
- Twelve participants showed an increase in TASKTIME in the rented car during the turning on the audio task compared to their car.
- Ten participants showed an increase in TASKTIME in the rented car during the selecting a radio station/music task compared to their car.
- Eight participants showed an increase in TASKTIME in the rented car during the controlling the audio volume task compared to their car.
- Ten participants showed an increase in TASKTIME in the rented car during the controlling the HVAC task compared to their car.
- For NUMGLANCES, there were several interesting differences that can be noted at the participant level:
- Nine participants showed an increase in NUMGLANCES in the rented car during the turning on the audio task compared to their car.
- Ten participants showed an increase in NUMGLANCES in the rented car during the selecting a radio station/music task compared to their car.
- Six participants showed an increase in NUMGLANCES in the rented car during the controlling the audio volume task compared to their car, while 5 participants had the same NUMGLANCES for their car and the rented car.
- Eight participants showed an increase in NUMGLANCES in the rented car during the controlling the HVAC task compared to their car.
While each participant’s driving experience was visualized to compare different driving experiences, Participant 2’s visualization most clearly depicts the difference between driving the participant’s own car and a rented car among all participants and thus was chosen for illustration in this paper for discussion (see Figure 6). In the visualization, each task, NUMGLANCES, and TASKTIME are depicted using icons, colors, and circles. Different kinds of tasks that the participant performed during direct observation are presented as simple icons. Changes in NUMGLANCES is represented by using different colors. For instance, if the participant glanced once or twice while performing a task, the color for the circle is gray. If the participant glanced three, four, or five+ times, the color of the circle is yellow, orange, or red, respectively. The amount of time that the participants spent completing the task is indicated by the diameter of the circle. This visualization highlights the merging of qualitative and quantitative data which help the design researchers understand the challenges faced by the participants, providing insights to inform the development of the prototypes. The development of the visualizations was a part of the data synthesis and prototype type development, enhancing the data-driven design-development process.
The visualization for Participant 2 indicates the following:
- It took more time for Participant 2 to start driving the rented car than her personal car. This implies she was in a learning phase. Quite a bit of this time was spent interacting with the HVAC controls.
- Participant 2 preferred to use steering wheel controls for certain functions in both of the cars.
- Besides controlling the HVAC, all of the tasks took more glances and required greater time to complete tasks while driving the rented car.
- Participant 2 chose to stop driving the rented car to adjust certain controls.

Figure 6. Visualized graph of Study 1 data for Participant 2.
Based on the observations during the driving task, participants tended to have similar control sequences of the functions that are closely related to each other. For example, when drivers controlled the audio system, most of the time they turned on the audio and adjusted the volume, especially in a rented car from Zipcar. Selection of previous/next songs happened after adjusting the volume. Most participants adjusted the audio system first. One participant accidentally activated the function which affected driving speed in a rented car from Zipcar.
The semi-structured interview results revealed that most of the participants preferred using steering wheel controls for certain functions, such as controlling volume, changing the media source, and selecting previous/next songs in their own cars. More specifically, only one of the participants who had steering wheel controls did not choose to use them. One participant commented that “I am focusing more on this [pointing at the steering wheel area] part [when I am driving].” Participants also mentioned that different labels for identical functions created confusion for them. For instance, the label for changing between media sources depends on the car brand (e.g., source, CD/AUX, and audio). Several participants also shared their previous experiences related to renting a car. The participants mentioned when they rented a car for a day or two, they used only a limited number of secondary functions because finding desired functions from center fascia controls that they were not familiar with was sometimes overwhelming.
Discussion
The overall results of Study 1 document the difficulty of users’ experience while controlling the secondary functions in an unfamiliar car when compared to a familiar car. In addition, during direct observation, some participants found that it was necessary to stop the rented car to locate the desired control(s). In addition to inconvenience, the unfamiliar locations and unfamiliar type of controls may have an effect on driving. The results of the semi-structured interview reinforce the findings from the observations. Because the interview was conducted immediately after the driving experience, there were many valuable comments and suggestions. During the interview, one participant mentioned the difficulty of controlling gear shifting function in a rented car. The participant accidently clicked the “grade assist button” and that affected the driving speed. The participant described that moment as a “very embarrassed moment and I would had been in trouble if I were on the road.” The “grade assist button” was not in the scope of Study 1 because it was a primary control which directly affects driving speed. However, this issue strongly addresses how unfamiliar controls affect the safety of drivers using a car-sharing system.
The use of eye tracking equipment during the observational study supported the calculation of TASKTIME and NUMGLANCES. The comparison of TASKTIME and NUMGLANCES between the two different driving experiences documents how much more time the participants spent and how many more glances were used to control the desired function in a car that they were not familiar with compared to their own car. Fixation time per glance and the distance between fixation locations were also intended measures. However, because the eye tracking device is light-sensitive and the data was collected outdoors, the time of day significantly impacted the eye tracking system. The time of day (affording consistent exposure to daylight) was not controlled by the experimenter; instead, the data collection sessions were scheduled to accommodate the participants. Thus, the calculation of fixation time and the distance between fixation locations were not feasible.
The correlation between TASKTIME and NUMGLANCE has been measured, and the result is fairly high but shows a different result in between participants’ own cars (0.47) and the rented cars from Zipcar (0.88). When the driving tasks were performed in the rented car from Zipcar, because participants were not familiar with the location of controls and interaction type, NUMGLANCES and TASKTIME were more likely correlated. However, in the participants’ own cars, the participants already know the location of controls and interaction type. This affects fewer NUMGLACES than with a rented car, but NUMGLACES did not always affect TASKTIME. For instance, Participant 1 presented two NUMGLANCES and 16 TASKTIMEs for adjusting the radio station. This implies that Participant 1 started adjusting the radio station with 1 to 2 NUMGLANCES and did not accumulate additional NUMGLANCES for the rest of the TASKTIMEs because of familiar tactile feedback from familiar interaction type. Hence, TASKTIME and NUMGLANCE are still meaningful to be presented separately.
Car Control Redesign
Before starting Study 2, an in-depth market review and data synthesis were conducted to understand the most common location of controls on the center fascia and the steering wheel in recent cars. Among 20 recent cars (2015–2017) from nine different car companies (see Table 3), 10 cars were chosen to present in this paper.
Table 3. Car Manufacturers for the In-Depth Market Review
|
U.S.A. |
Europe |
Republic of Korea |
Japan |
|
Ford General Motors |
Audi* Volkswagen Porsche* |
Hyundai Kia |
Toyota Honda |
Note. Seven chosen car manufacturers for the in-depth market review are from the top 10 car manufacturers based on the “OICA Correspondents Survey Report” (OICA, 2015). Two European cars manufacturers (indicated with *) were chosen for the in-depth market review.
The secondary controls from Study 1 were chosen to conduct an in-depth market review (see Table 4).
Table 4. The Secondary Controls for the In-Depth Market Review
|
Audio system |
Power on radio/audio system, radio station/music selection, and volume control |
|
Temperature system |
Temperature control |
All the images for the in-depth market review were collected from either car dealerships or online magazines, such as Motor Trend. To synthesize the collected data, the images of center fascia from each car were cropped 2 by 2 inches and marks, such as orange dots and steering wheel icons, were used (see Table 5). The orange dots indicate the location of a control on center fascia. If a function is controlled by both a center fascia control and a steering wheel control, a small image of a steering wheel control is presented on the bottom left side of the center fascia control picture. If the control is located on the left side of the steering wheel, an orange steering wheel shaped icon is indicated on the left side of the steering wheel control picture.
Table 5. Process of Synthesizing the Collected Data from an In-Depth Market Review (Power on Audio System/Control Volume, 2017 Buick)
|
Pictures |
Interpretation |
Result |
 |
The location of a volume control button is on the top middle of the audio system instrumentation group on the center fascia. |
 |
 |
The location of a volume control button is on the middle of the audio system instrumentation group on the steering wheel. |
 |
|
The result of synthesizing one car |
 |
|
After that, 10 images with orange dots and steering wheel icons were overlapped to synthesize the trend of the most common location. The example of synthesized images from the in-depth market review is shown in Figure 7.

Figure 7. Example of the in-depth market review synthesis (Powering on Audio System/Control Volume).
The synthesis of the most common location and interaction type for audio system controls for recent cars (2015–2017) is presented in Figure 8. The data shows that the most common location of powering on audio/radio system and controlling volume on the center fascia is bottom left, and the most common interaction type is knob type (10 out of 10). The most common location of powering on audio/radio system and controlling volume on a steering wheel control is left, and the most common interaction type is button type (button type: 8 and scrolling type: 2), but the layout of button types is different (vertical: 6 and horizontal: 2). There are no on/off buttons for audio system controls on the steering wheel. An instrumentation group does not have a single interaction type. The summary of the most common location and the interaction type for the most frequently used audio system controls in cars are shown in Table 6.

Figure 8. Visualization of the most common location and interaction type for audio system controls.
Table 6. The Most Common Location and Interaction Type for Audio System Controls
|
The most frequently used audio system controls |
Center fascia |
Steering wheel |
||
|
The most common location |
The most common interaction type |
The most common location |
The most common interaction type |
|
|
Audio system instrumentation group |
Above the temperature system instrumentation group |
–* |
Left |
–* |
|
Powering on audio/radio system |
Bottom left |
Knob type |
Left |
Button type |
|
Controlling volume |
Top left |
Knob type |
Left |
Button type |
|
Radio station/music selection |
Top middle |
Button type |
Left |
Button type |
* No common interaction type.
The synthesis of the most common location and interaction type for temperature system controls is shown in Figure 9. The data shows that the most common location of controlling temperature is bottom left/right, and the most common interaction type is the knob type (knob type: 8, button type: 2). There is no temperature control on the steering wheel. An instrumentation group does not have a single interaction type. The summary of the most common location and the interaction type for the most frequently used temperature system controls in cars are shown in Table 7.
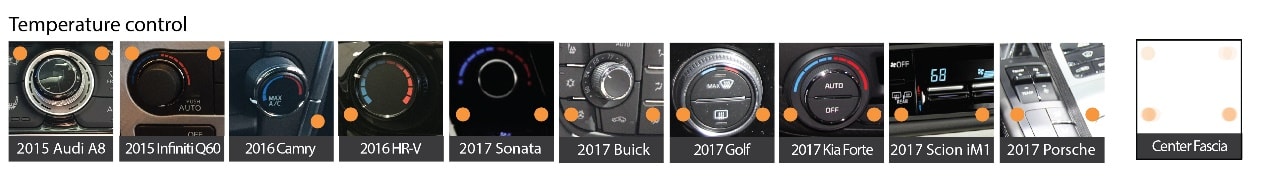
Figure 9. Visualization of the most common location and interaction type for temperature system controls.
Table 7. The Most Common Location and Interaction Type for Temperature System Controls
|
Temperature system controls |
The most common location |
The most common interaction type |
|
Temperature system instrumentation group |
Lower part of the audio system instrumentation group |
–* |
|
Temperature control |
Left, right |
Knob type |
* No common interaction type.
After the in-depth market review, a mini study was conducted with five participants. All of the controls were movable, and the participants were asked to choose the most frequently-used controls and arrange them in the participants’ preferred location (see Figure 10). After that, a semi-structured interview was conducted to understand why the participants configured the controls as they did. The result of the mini study indicated that some of the preferred location and the interaction types of controls were different from the result of the in-depth market review. For example, the mini study suggested that a scrolling type control for volume is the preferred interaction type, which is less common than the button type according to the in-depth market review. In this case, both directions were sketched, and the sketches were reviewed by other designers. Finally, the scroll type was chosen. Most participants from the mini study commented that they would like to have the most frequently used controls on the steering wheel on their dominant hand side. While there were a number of ideas regarding the construction of the steering wheel prototype, a remote-control device that can be installed on the steering wheel based on the participant’s preference was chosen for development.
Based on the results from the study, the in-depth market review, and the mini study, two sets of prototypes for the secondary controls (one each for the center fascia and the steering wheel) were developed to improve the usability and safety in the car sharing experience. All parts were 3D printed and were painted black with white text and icons to mimic actual controls (see Figure 11). Figure 11 presents the location and interaction type of prototypes compared to the result from the in-depth market review. The prototypes provided haptic feedback to users (knobs could be turned, buttons pushed, and scrolls rotated); however, they were not functional (e.g., they did not adjust the volume or change the temperature of the air).

Figure 10. Development of prototype of secondary controls.

Figure 11. The location and interaction type of prototypes comparing to the result of in-depth market review.
Purpose of Study 2
A lab-based usability study was conducted to evaluate the improvement of usability of the secondary controls prototype using a driving simulator. The use of the driving simulator was chosen to mitigate potential safety concerns of using a prototype in a real car while on the road.
Methods
The tasks completed in Study 2 were a set of three simulated driving tasks, each approximately 5 minutes in length. For the initial driving setup, participants spent 15 minutes in the simulator including in-simulator preparation (5 minutes), equipment calibration (5 minutes), and driving task (5 minutes). However, because the environment of the simulated driving did not change with each task (whereas in Study 1, participants were allotted time in each car to adjust mirrors, seat, etc. and equipment calibration time), participants did not need to spend 5 minutes of in-car preparation and another 5 minutes of equipment calibration time for the next the two sets of tasks. Similar to the methods in Study 1, direct observations were conducted while driving the simulator and participants’ opinions and feedback were collected during the interview.
Participants’ eye movement data was collected during the usability test using the same device as was used in Study 1. Because the participants were not in the field, they were not expected to move their head rapidly for contextual awareness; therefore, no additional headband was used to secure the eye tracking device.
A semi-structured interview was conducted immediately after the simulated driving experience so that the participants could vividly describe their experience.
Measurements
As in Study 1, NUMGLANCES and TASKTIME were calculated based on the eye tracking data. Thus, the NUMGLANCES and TASKTIME for the same tasks in two different situations, simulated driving experience and driving experience with rented car, were comparable.
Participants
Of the 15 people from Study 1, 13 participated in Study 2 (see Table 1).
Apparatus
Study 2 was conducted in a lab equipped with a STISIM 3 driving simulator. This simulator includes three 42-inch displays that spans across a 135-degree field of view, a driving wheel, pedals, and a driver’s seat. The same simulated driving environment was used for each participant to reduce variability. The eye tracking device and GoPro cameras described in Study 1 were used in this study (see Figure 12).

Figure 12. The STISIM 3 driving simulator used in Study 2.
Procedure
In preparation for the study, the prototype controls were installed on the simulator (the steering wheel prototype was mounted depending on each participant’s dominant hand), one GoPro camera was mounted on the driving simulator’s screen, and a second was placed behind the participant to record how they interacted with the simulator and the prototyped controls. After providing informed consent, the participant was fitted with the eye tracking device, sat in the driving simulator, and the device was calibrated.
After completing the calibration, the participant was briefly instructed on how to use the simulator and allowed to “drive” to become familiar with the simulator. Once the participant became comfortable (after approximately 3 to 5 minutes of driving), the participant was asked to stop using the simulator and was given instructions for the driving tasks that were to be completed. During the simulated driving tasks, the participant was instructed to complete the following four tasks (these were the same tasks as Study 1):
- turning on the radio/audio
- selecting a radio station/music
- controlling the audio volume
- controlling the HVAC
To replicate a natural driving experience, the participant was asked to use the driving simulator naturally and perform the tasks based on the participant’s daily routine, regardless of the order. The participants were then asked to start operating the simulator. The participant was asked to complete the four tasks three times using the prototyped center fascia controls, using the prototyped steering wheel controls, and using their choice of the prototyped controls—either the center fascia control or steering wheel controls. To mitigate order effects in Study 2, the order of using prototyped center fascia controls and using prototyped steering wheel controls was randomized. After the participants completed the simulated driving tasks, they were asked about the simulated driving experience using the different control prototypes. Their responses to the experience were audio recorded. The simulated driving tasks were videotaped while the interview was also audiotaped (see Figure 13).
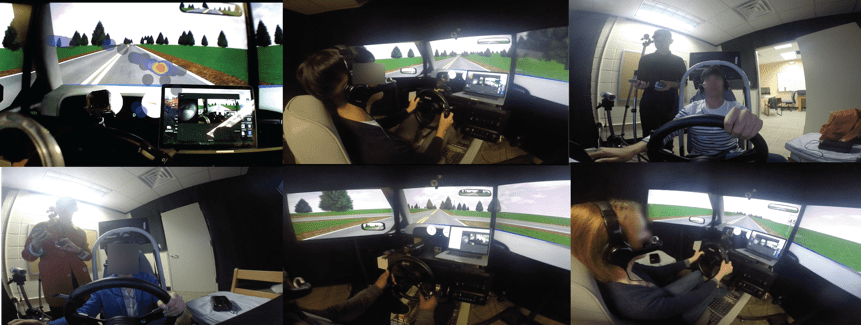
Figure 13. Snapshots of tasks, equipment, and a visual heat map in Study 2.
To mitigate order effects in Study 2, the order of presentation of the prototypes was randomized, which did not result in a completely counterbalanced design. Therefore, the mean of the TASKTIMEs (using 1 standard deviation for the range of comparison) was assessed to compare the order of prototype use. No significant differences were found based on the order of prototype use.
Results
The data from interfaces that were not familiar to the participants (including the Zipcar data from Study 1 and the steering wheel and center fascia prototypes from Study 2) were included in this data analysis. Thus, only the data from 13 of the 15 participants with complete data sets in Study 1 were used in this analysis. For brevity, variables used in Study 2 that were defined in Study 1 will not be redefined here.
SPEED (inverse of TASKTIME)
There were two within-subject factors: interface and task. There was a significant main effect of interface, F(2,24) = 3.72, p = .039. Subsequent pairwise comparisons with Bonferroni correction revealed significantly faster SPEED among participants when interacting with the steering wheel prototype (M= .24) than with the Zipcar interface (M = .18), F(1,12) = 3.53, p = .016. However, SPEEDs when using the center fascia prototype (M = .22) and a Zipcar interface (M = .18) did not differ significantly, F(1,12) = 3.53, p = .085. Participants’ SPEEDs were also comparable among the tasks (turning on the radio/audio, .23; selecting a radio station, .23; controlling the audio volume, .22; controlling the HVAC, .19), F(3,36) = 1.24, p = .310. There was an interaction between car type and task (Figure 14), F(6,72) = 2.56, p = .026. A summary of means and data range is provided in Table 8 and Table 9.
NUMGLANCES
NUMGLANCES was analyzed using a repeated-measure analysis of variances (rmANOVA) with two within-subject factors: interface and task. There was a significant main effect of interface, F(2,24) = 8.90, p = .001. Subsequent pairwise comparisons with Bonferroni correction revealed significantly greater NUMGLANCES among participants when interacting with the Zipcar interface (M = 3.48) than with the center fascia prototype (M = 2.33), F(1,12) = 8.50, p = .013, as well as with the steering wheel prototype (M = 1.98), F(1,12) = 10.56, p = .007. However, when using the center fascia prototype (M = .22) and a Zipcar interface (M = .18), the NUMGLANCES did not differ significantly, F(1,12) = 3.53, p = .085. NUMGLANCES were comparable among the tasks (turning on the radio/audio, 3.00; selecting a radio station, 2.44; controlling the audio volume, 2.31; controlling the HVAC, 2.64), F(3,36) = .79, p = .506. The interaction between interface and task did not reach significance either (Figure 15), F(6,72) = 1.86, p = .099. A summary of means and data range is provided in Table 8 and Table 9.
Estimated marginal means from rmANOVA are visualized to compare the simulated driving experience and driving experiences with the Zipcar (see Figure 14 and Figure 15).
Because the eye movement data (NUMGLANCEs and TASKTIME) were collected twice (once with the center fascia prototype and once with the steering wheel prototype) during the simulated driving task, the value from the selected prototype’s data was presented in Table 8. For instance, if a participant chose to control the radio by using the steering wheel prototype, the result of the data in TASKTIME and NUMGLANCES from the steering wheel prototype, not the center fascia prototype, was recorded (the data from each prototype is presented in Table 8). The data from the rented car from Zipcar and the participant’s car (from Study 1) were included for the descriptions of the comparisons in Table 8. This allows for comparison between controls available on the market (Zipcar and participant’s own cars–which also had steering wheel controls) to the alternative, prototype designs.
Table 8. TASKTIME, SPEED, and NUMGLANCES in Study 2.
|
Task |
Simulated driving preferred condition** |
Rented car from Zipcar** |
Participant’s car*** |
||||||
|
Avg. TASK [min, max] |
Avg. [min, max] |
Avg. NUM [min, max] |
Avg. TASKTIME* [min, max] |
Avg. [min, max] |
Avg. NUM [min, max] |
Avg. TASK [min, max] |
Avg. [min, max] |
Avg. NUM [min, max] |
|
|
1. Turning on the radio/audio |
5.23 [2.00, 13.00] |
0.19 [0.08, 0.50] |
2.23 [1.00, 6.00] |
9.85 [3.00, 38.00] |
0.10 [0.03, 0.33] |
3.93 [1.00, 12.00] |
3.17 [1.00, 8.00] |
0.41 [0.13, 1.00] |
1.50 [1.00, 2.00] |
|
2. Selecting a radio station/music |
3.92 [2.00, 8.00] |
0.25 [0.13, 0.50] |
1.31 [1.00, 3.00] |
12.15 [2.00, 29.00] |
0.08 [0.03, 0.50] |
4.50 [1.00, 9.00] |
5.75 [2.00, 16.00] |
0.25 [0.06, 1.14] |
2.00 [1.00, 4.00] |
|
3. Controlling the audio volume |
8.54 [2.00, 30.00] |
0.12 [0.03, 0.50] |
2.38 [1.00, 5.00] |
5.85 [2.00, 19.00] |
0.17 [0.05, 0.50] |
2.43 [1.00, 7.00] |
3.92 [1.00, 7.00] |
0.33 [0.14, 1.00] |
1.50 [1.00, 3.00] |
|
4. Controlling the HVAC |
5.85 [3.00, 13.00] |
0.17 [0.08, 0.33] |
2.31 [1.00, 4.00] |
9.85 [2.00, 22.00] |
0.10 [0.05, 0.50] |
3.21 [1.00, 9.00] |
4.25 [1.00, 7.00] |
1.19 [0.14, 1.00] |
1.75 [1.00, 4.00] |
|
Average |
5.88 [2.30, 16.00] |
0.18 [0.06, 0.44] |
2.06 [1.00, 4.50] |
9.42 [2.50, 21.75] |
0.11 [0.04, 0.46] |
3.52 [1.00, 9.30] |
4.27 [1.25, 9.50] |
0.55 [0.12, 0.88] |
1.69 [1.00, 3.25] |
Note. The data while controlling each of the prototypes is also presented in Table 9.
* Time presented in seconds
** Study 2, n = 13 participants
*** Study 1, n = 12 participants
Table 9. TASKTIME, SPEED, and NUMGLANCES while using two different prototypes in Study 2.
|
Task |
Center fascia prototype** |
Steering wheel prototype** |
||||
|
Avg. TASKTIME* [min, max] |
Avg. [min, max] |
Avg. NUMGLANCES [min, max] |
Avg. TASKTIME* [min, max] |
Avg. [min, max] |
Avg. NUMGLANCES [min, max] |
|
|
1. Turning on the radio/audio |
7.23 [2.00, 20.0] |
0.14 [0.05, 0.50] |
3.00 [1.00, 9.00] |
4.46 [2.00, 9.00] |
0.22 [0.11, 0.50] |
2.00 [1.00, 6.00] |
|
2. Selecting a radio station/music |
4.69 [3.00, 7.00] |
0.21 [0.14, 0.33] |
1.92 [1.00, 5.00] |
3.92 [2.00, 8.00] |
0.25 [0.13, 0.50] |
1.23 [1.00, 3.00] |
|
3. Controlling the audio volume |
5.15 [2.00, 11.00] |
0.19 [0.09, 0.50] |
2.00 [1.00, 5.00] |
8.62 [2.00, 30.00] |
0.12 [0.03, 0.50] |
2.38 [1.00, 5.00] |
|
4. Controlling the HVAC |
6.00 [3.00, 11.00] |
0.17 [0.09, 0.33] |
2.38 [1.00, 4.00] |
5.92 [3.00, 13.00] |
0.17 [0.08, 0.33] |
2.31 [1.00, 4.00] |
|
Average |
5.77 [2.50, 12.25] |
0.18 [0.09, 0.42] |
2.33 [1.00, 5.75] |
5.73 [2.25, 15.00] |
0.19 [0.09, 0.46] |
1.98 [1.00, 4.50] |
* Time presented in seconds
** n = 13 participants

Figure 14. TASKTIME across four tasks in Study 2. Error bars represent +/- 1 standard error.

Figure 15. NUMGLANCES across four tasks (Study 2). Error bars represent +/- 1 standard error.
Based on the data in Table 8, the results from Study 2 indicated the following (because TASKTIME is easier to compare and understand than SPEED, TASKTIME was used to describe the differences between the car types instead of SPEED):
- Averaging TASKTIME across tasks, the average TASKTIME was more than 60.2% longer when participants were driving the rented car compared to simulated driving.
- Averaging NUMGLANCES across tasks, the average NUMGLANCES was 70.9% greater than when participants were driving the rented car compared to simulated driving.
- Comparing the results from the simulated driving, the average TASKTIME for three of the four tasks were longer with the rented car. The average TASKTIME to complete the third task, controlling the audio volume, showed increased TASKTIME than when participants were driving the rented car. One participant (see max.) drove up the average for controlling the audio volume.
- The average NUMGLANCES for three of the four tasks were longer with the rented car compared to simulated driving.
- Averaging TASKTIME across tasks, the average TASKTIME was more than 37.7% longer when participants were driving their own car compared to simulated driving.
- While other tasks showed increased TASKTIME and NUMGLANCE than in the participant’s car, the second task, selecting a radio station/music, showed decreased TASKTIME (46.7%) and NUMGLACE (52.7%) than the participant’s car compared to simulated driving.
Based on the results presented in Table 9, the results from Study 2 indicated the following when participants driving the simulator were using the steering wheel prototype compared to using the center fascia prototype:
- The average TASKTIME and NUMGLANCES across tasks is similar for both prototypes.
- The average TASKTIME for controlling the volume was 65.3% longer with steering wheel control.
While each participant’s driving experience was visualized for comparison of the different driving experiences, the visualization for Participant 2, who is the same participant representing a visualized graph in Study 1, is presented in the following discussion (see Figure 16).

Figure 16. Visualized graph from the result of Study 2 for Participant 2.
The visualization for Participant 2 indicated the following:
- It took more time for Participant 2 to learn to use the steering wheel prototype than to learn to use the center fascia control prototype (on the second bar in Figure 16, the small red circle on the left indicates learning to use the center fascia control as compared to the large red circle on the right indicates learning to use the steering wheel control).
- Participant 2 took quite a bit of time to control the volume while using the steering wheel prototype.
- In general, Participant 2 took fewer NUMGLANCES while using the prototypes compared to the Zipcar.
In Study 2 in the driving simulator, participants were allowed to choose between the control prototypes; their preferences are presented in Table 10.
Table 10. Participants’ Preferences Between Prototypes During Study 2
|
Task |
Preferred center fascia prototype* |
Preferred steering wheel prototype* |
|
1. Turning on the radio/audio |
3 |
10 |
|
2. Selecting a radio station/music |
2 |
11 |
|
3. Controlling the audio volume |
1 |
12 |
|
4. Controlling the HVAC |
1 |
12 |
* n = 13 participants
Based on the data presented above, the results from Study 2 indicated the following:
- Across all tasks, participants generally preferred the steering wheel control prototype.
- Ten participants preferred the steering wheel control prototype for turning on the radio/audio.
- Eleven participants preferred the steering wheel control prototype for selecting a radio station/music.
- Twelve participants preferred the steering wheel control prototype for controlling the audio volume and controlling the HVAC.
During the driving task in Study 2, similar to the findings of Study 1, participants tended to have similar control sequences of the functions that are closely related to each other, first controlling the audio system, then adjusting the volume and then switching songs.
The semi-structured interview results underscored that the redesigned prototypes on the center fascia were easy to use. Also, most of the participants mentioned that they were satisfied with having the most frequently used secondary controls on the steering wheel. For instance, most participants commented that having the HVAC control on the steering wheel made them feel like they spent less time to control HVAC function than the control on the center fascia. Also, most participants mentioned that they liked having the volume control on the top part of the steering wheel controls (the bottom part of the steering wheel control prototype has an HVAC control). Participants also mentioned that the location of the steering wheel controls depending on their preference helped them control functions easier. However, the participants commented that the prototype on the steering wheel was too thick and might distract drivers when driving on a curved road. Participants also commented that when the volume control prototype was on the steering wheel, that specific control locations were not initially clear. Some participants also commented that the letters and the icons on the steering wheel prototype were not large enough to easily identify the control function.
Discussion
Overall, Study 1 helped in understanding the gap in the driving experience between driving a familiar car and an unfamiliar car, and Study 2 helped develop and evaluate the prototypes to reduce this gap. By utilizing the same participants for Study 1 and Study 2, data could be compared across studies to evaluate the usability of the prototypes in each task. Study 2 highlighted opportunities for improvement in the prototypes, such as the volume control on the center fascia prototype.
The overall result of Study 2 indicated that most of the participants’ NUMGLANCES and TASKTIMEs were reduced while using the prototypes (for both the center fascia and steering wheel controls) compared to the rented cars except for controlling the audio volume. While the participants performed well with and liked both prototypes, the participants provided more feedback regarding the steering wheel prototype.
Most participants preferred the steering wheel controls when selecting a radio station/music and suggested controlling the HVAC using the steering wheel (the steering wheel controls do not include the HVAC controls in any of the tested, current car models). This suggests that this is an opportunity to improve driving usability, and as a result safety, when drivers are using car-sharing systems by relocating/redesigning the controls embedded in the steering wheel. There are some interesting findings in Study 2. For instance, even though controlling volume on a center fascia prototype took less TASKTIME and fewer NUMGLANCE compared to the steering wheel control (the average TASKTIME was 65.3% longer and the average NUMGLANCE was 19% more with steering wheel control), most participants (11 out of 13) preferred using the steering wheel prototype. This implies that if a driver has two options of controlling volume, the steering wheel control and the center fascia control, the driver might choose to control volume on the steering wheel rather than the center fascia control. Participants preferred for the HVAC control to be a part of the steering wheel prototype, noting that “it felt closer and would take less time to control.”
Study 2 also indicated that even though the size of the volume scroll control on the steering wheel prototype was too thick, most participants preferred the control in that location rather than the center fascia control. The proximity of the control was more important to them than the shape or thickness. This implies that designers and car manufacturers should consider the location of the controls as the first priority of designing controls in a car sharing context. Again, the average TASKTIME for controlling the audio volume was longer with the steering wheel control. The possible reason of longer a TASKTIME with the steering wheel prototype over the center fascia prototype is the interaction type for the steering wheel; a scroll type volume control is an uncommon interaction type for this function. Because volume control is the second most frequently used secondary control while driving a car (Kim, 2016), the volume control location and interaction type (such as knob type and button type) should be given design priority—placement on the prime real estate of the steering wheel. In Study 2, because the steering wheel prototype was positioned to accommodate the participant’s dominant hand, this paper cannot make a recommendation regarding the optimal side for the location of the volume control on the steering wheel. However, because right-handed people are dominant throughout the world (Hardyck & Petrinovich, 1977), the most frequently used secondary controls on the steering wheel, including volume control, may be optimally located on the right side in a sharing-friendly car. However, controls placed on the driver’s dominant hand sides of the steering wheel to avoid the handedness issue is recommended if possible.
Study 2 also showed a positive respect of the prototypes, specifically selecting a radio station and music. The result indicates that selecting a radio station on the steering wheel prototype increased usability (reduced TASKTIME and NUMGLACE) even compared to the participant’s own car. This implies the location of the control to participant’s dominant hand could reduce the distraction from driving.
During the Study 1 interviews, several participants mentioned having rented a car for a day or two, and only using a limited number of secondary functions because finding desired functions within the unfamiliar center fascia controls was overwhelming. During the Study 2 interviews, the participants, again, mentioned feeling more comfortable with steering wheel controls, which were close at hand, rather than reaching for the center fascia controls. Because the HVAC is a frequently adjusted control, locating the HVAC control on the steering wheel is worth considering.
Although volume adjustment took more glances in the rental car and the steering wheel prototype was preferred over the center fascia location, there is still room for improvement. Additional labels (lettering or icons) could improve the identification of the volume control location; similarly, reducing the thickness of the control so that it is not a distraction, like the prototype, is recommended.
The test conditions in Study 2 were more repeatable because the simulator presented the same simulated driving environment to each participant under the same lab conditions (consistent illumination level, glare, lack of distractions). The consistent illumination levels not only improved data collection during the driving task, it also made calibration of the eye tracking device more accurate compared to the observation session conducted outside. The distractions while driving, requiring participants to look over their shoulder to avoid collisions, in Study 1 were not present in Study 2; therefore, the eye tracking device was more stable throughout Study 2 due to reduced jerky head movement. This repeatability in conditions, the consistency in the lab environment, and the decreased head jerks is believed to afford more reliable results in Study 2 when compared to Study 1. The NUMGLANCES and TASKTIME (calculated from the eye tracking data) helped assess the usability of the prototypes. In addition, affording better eye tracking data collection, the driving simulator enabled the researcher to control variables, such as the route and environment in the driving simulation, so that the participants experienced similar environmental settings.
In concert with good human factors design and based on the results of these studies, we recommend the following to designers to consider for the car-sharing context:
- Be informed by market conventions in selecting locations for controls on the steering wheel and the center fascia. The most common location of controls, including the location of the volume control on the steering wheel, as in Figure 11, may serve as a reference for designers and car manufacturers who are interested in designing sharing-friendly cars.
- As noted before, the world population of right-handed people is dominant (Hardyck & Petrinovich, 1977). The most frequently used secondary controls on the steering wheel may be optimally located on the right side in a sharing-friendly car. However, if possible, controls on the driver’s dominant hand sides of the steering wheel to avoid the handedness issue is recommended.
- Consider placing the HVAC temperature control on the steering wheel.
- Simplify the layout of controls on the center fascia by grouping controls, increasing the size of frequently used controls, and reducing the number of controls.
- Match user expectations for conventions of control type, shape, and movement.
This is one of the first studies to document the needs of car sharing users and the challenges faced by designers in meeting their needs. Pointing to driver distraction literature, these studies support our premise that safety (by reducing TASKTIME and NUMGLANCE away from the primary task of driving) could be improved by enhancing the usability of the most common secondary car controls in a car sharing context.
Limitations
There are some limitations associated with the studies. It was hard to recruit the same participants for Study 1 and Study 2 because of schedule conflicts. Based on our experience while conducting Study 1 in an outside environment (a parking lot), to collect more reliable data, we recommend that prior to sunset is an ideal time for using an eye-tracking device outside. However, because of the schedule challenges with participants, Study 1 was conducted at different times during the day. This affected the calibration of the eye tracking device, decreasing accuracy, which led to a less reliable fixation location and fixation time per glace during Study 1.
Initially, glance duration was considered as one of the measurements for the studies. However, due to the aforementioned challenges with fixation, NUMGLANCE was chosen to be a dependent measure instead. While there is guidance in the literature regarding gaze duration (e.g., the Alliance of Automotive Manufacturers recommends not to exceed 2 seconds in regards to in-vehicle glance duration (Horrey & Wickens, 2007), there is no absolute standard for driving distraction and NUMGLANCES.
Future field studies should be conducted during twilight hours to increase the researcher’s ability to calculate gaze (or glance) duration. Increasing the number of participants in future studies to define the connection between NUMGLANCES and usability may be beneficial in developing a similar standard for NUMGLANCES. While the participants were asked to drive “naturally” in Study 1, they were asked not to drive above the speed limit (25 mph) and to follow the predefined course in the parking lot. Because the participants were not asked to keep the same speed for Study 1, some of the participants slowed down or even stopped the car rented from Zipcar to perform certain tasks, and the variable, not controlling the speed, might have affected the result of TASKTIME and NUMGLANCE. However, the behaviors, such as stopping the rented car to control certain functions (which strongly implies the low usability of certain controls and TASKTIME and NUMGLANCE), probably would not have been observed if the participants were asked to keep the same speed.
The eye tracking device is a relatively expensive data collection device that required significant preparation time for calibration and data analysis time. Even though the mean of the TASKTIMEs (using 1 standard deviation for the range of comparison) was assessed to compare the order of car use and no significant differences were found based on car use order, a counterbalanced design for the order in which participants drove the cars (personal or rented) may have been a better choice than randomizing the order of presentation.
A limitation in Study 2 is associated with the use of a driving simulator and the simulation of the controls. First of all, there is different user experience between the actual driving and using a simulator. The distractions from a real driving experience versus driving a simulator may be different and this factor may have affected the results of the studies. Also, the researcher controlled the actions of the secondary controls while watching the participants to produce the simulation of the activity. While thought to have minimal impact, there may have been variability within the researcher’s performance of the simulation tasks that may have impacted that participants’ TASKTIME data. This is an interesting point; this researcher-related error would have resulted in delaying the recorded TASKTIME. If this was the case and if the researcher-related error could be removed, the differences between the tasks performed in the simulator would have been shortened. Thus, the TASKTIME recorded (minus researcher-related error) would increase the levels of statistical significance but not change the interpretation of the results.
This paper conducted an in-depth market review of 10 cars, which is not a large number. Future research is needed to be done with the vast number of cars from different brands and models. As one participant accidently activated the grade assist function and it affected driving speed in a rented car from Zipcar, future study regarding how drivers use primary controls in a car-sharing system needs to be conducted to improve safety and usability of car-sharing systems. Even though there were no noticeable difference of TASKTIME and NUMGLANCES between genders, there may be differences between age groups. Further research may compare individuals in their 20s and 30s to those in their 60s and 70s to understand if age or generation effects the car sharing experience. Because autonomous vehicles are likely to be more prevalent in the near future, upcoming investigations will need to consider the usability of interaction design in car-sharing systems in such vehicles.
Conclusion
This study introduces methods to evaluate and improve the usability of secondary controls in context of unfamiliar cars, such as short-term rentals with car-sharing systems. Study 2 was conducted with prototypes based on the most common location of controls and interaction types. The results from Study 2 demonstrated reduced TASKTIME and NUMGLANCE compared to the results from using controls in Zipcar cars. The designers and car manufacturers interested in designing sharing-friendly vehicles can use the prototype as a reference (see Figure 11). Designers and researchers may develop other prototypes than those suggested in this study; the results of this study underscore the benefit of having a standard layout and standard interaction type for the cars being used in a sharing system. The method introduced in this paper may be modified to evaluate and develop such alternative designs. Researchers and designers may explore using current or upcoming technologies to design customizable interfaces which might move with the individual between cars in a car-sharing system to improve the usability of short-term rentals.
Tips for Usability Practitioners
The designers and car manufacturers interested in designing sharing-friendly vehicles can use the prototypes and market review synthesis (see Figure 11) as references when determining the location and common interaction types for secondary controls. These new designs may benefit from evaluation using the methods and insights associated with those methods documented in this paper.
Eye Tracking Device
There are a couple of important considerations when collecting data outside. When sunlight is bright, such as around noon, the eye tracking device is not as accurate as during periods of moderate or low light such as in the evening. In low light conditions, participants’ pupils dilate (to let in more light) and are more easily recognized by the eye tracking device. Based on the experience during these driving sessions, prior to sunset is an ideal time for using an eye tracking device to collect more reliable data.
Pilot work was conducted to refine the data collection method. During pilot work, before conducting Study 1 and Study 2, participants moved their heads quickly to check their surrounding environment and driving conditions; this resulted in a slight shifting of the device on their head. After the rapid head movement and associated device shift, the calibration for certain locations moved resulting in inaccurate fixation spot identification. To improve reliability, an elastic hairband was used to provide a snug fit between the device and the participant’s head. The use of the hairband was a cost-effective solution which resulted in stable data. Only one participant mentioned not liking having their hair style “messed-up”; however, no one reported concern or discomfort with the use of the headband.
Semi-Structured Interview
It was beneficial to conduct the interview immediately after the two different driving experiences because the participants could vividly recall the difficulty they experienced while driving the rented car.
Simulated Driving
Even though the working prototypes were not functional, participants mentioned that it was more realistic when the control prototypes provided feedback while being used. For instance, when the participant started turning the radio/audio control, the music was adjusted by the researcher (and not the prototyped control).
For the driving simulator, it was important to explain to the participants to let the researcher know if they began to experience motion sickness so that they could take a break; only one participant reported feeling motion sickness during this study (note: the driving simulation was easy or light in intensity). Researchers may consider screening participants for susceptibility to motion sickness for investigations requiring intensive driving simulations.
Eye Tracking Device and GoPro Cameras
Given the complexity of the environment and real-world activities, recordings from GoPro cameras helped document participants’ subtle reactions that the researcher might have missed with real-time data collection, such as the participants’ facial expressions and sounds (note: the eye tracking device used in this study cannot record the sound). An alternative to front and rear GoPro cameras may be the use of 360° cameras; however, the video analysis may be challenging with this data format and requires further exploration.
References
Bardhi, F., & Eckhardt, G. M. (2012, December). Access-based consumption: The case of car sharing. Journal of Consumer Research, 39(4), 881–898. http://doi.org/10.1086/666376
Chen, Y. (2009). Possession and access: Consumer desires and value perceptions regarding contemporary art collection and exhibit visits. Journal of Consumer Research, 35(6), 925–940. http://doi.org/10.1086/593699
Cohen, D., & Crabtree, B. (2006). Semi-structured interviews recording semi-structured interviews. Qualitative Research Guidelines Project, 2. Retrieved from http://www.qualres.org/HomeSemi-3629.html
Demers, D. (2005). Dictionary of Mass Communication and Media Research: A guide for students, scholars and professionals. Spokane, WA, USA: Marquette Books.
Hardyck, C., & Petrinovich, L. F. (1977). Left-handedness. Psychological Bulletin, 84(3), 385–404. http://doi.org/10.1037/0033-2909.84.3.385
Holmes, A. (2013). Direct observation. In F. R. Volkmar (Ed.), Encyclopedia of Autism Spectrum Disorders (pp. 980–981). New York, NY: Springer New York. http://doi.org/10.1007/978-1-4419-1698-3_1758
Horrey, W., & Wickens, C. (2007). In-vehicle glance duration: Distributions, tails, and model of crash risk. Transportation Research Record: Journal of the Transportation Research Board, 2018, 22–28. http://doi.org/10.3141/2018-04
Kapitaniak, B., Walczak, M., Kosobudzki, M., Jóźwiak, Z., & Bortkiewicz, A. (2015). Application of eye-tracking in the testing of drivers: A review of research. International Journal of Occupational Medicine and Environmental Health, 28(6), 941–54. http://doi.org/10.13075/ijomeh.1896.00317
Kim, B. (2016). Interaction design guideline for car sharing system (Master’s final project report). North Carolina State University: Raleigh, North Carolina, USA.
Lane, C., Zeng, H., Dhingra, C., & Carrigan, A. (2015). Carsharing: A Vehicle For Sustainable Mobility In Emerging Markets? World Resourses Institute, Ross Center. Retrieved from http://www.wri.org/publication/carsharing
National Highway Traffic Safety Administration (NHTSA). (2010). Overview of the National Highway Traffic Safety Administration’s Driver Distraction Program, 1–32. Available at https://www.nhtsa.gov/sites/nhtsa.dot.gov/files/811299.pdf.
OICA (International Organization of Motor Vehicle Manufacturers). (2015). World Motor Vehicle Production OICA correspondents survey, Without Double Counts, 1.
Robert, A. (1992). Refining the test phase of usability evaluation: How many subjects is enough? The Journal of the Human Factors and Ergonomics Society, 34(4), 457–468.
Rümelin, S., & Butz, A. (2013). How to make large touch screens usable while driving. Proceedings of AutomotiveUI 2013 of the 5th International Conference on Automotive User Interfaces and Interactive Vehicular Applications (pp. 48–55). New York, NY: ACM.
Ryu, J., Song, G., Lee, S., Cho, Y., Kyung, G., Kim, H., & Baek, K. (2009). Improving in-vehicle display and control design for older drivers. Lecture Notes in Computer Science (Including Subseries Lecture Notes in Artificial Intelligence and Lecture Notes in Bioinformatics), 5624 LNCS, 170–176. http://doi.org/10.1007/978-3-642-02731-4_20
Siegmund, N., Altmüller, T., Bengler, K., & Gmbh, R. B. (2013). Personalized situation-adaptive user interaction in the car categories and subject descriptors. Proceedings of AutomotiveUI 2013 of the 5th International Conference on Automotive User Interfaces and Interactive Vehicular Applications (pp. 105–106).
Strayer, D. L., Watson, J. M., & Drews, F. a. (2011). Cognitive Distraction While Multitasking in the Automobile. Psychology of Learning and Motivation – Advances in Research and Theory (1st ed., Vol. 54). Elsevier Inc. http://doi.org/10.1016/B978-0-12-385527-5.00002-4
Väänänen-vainio-mattila, K., Heikkinen, J., Farooq, A., Evreinov, G., Mäkinen, E., & Raisamo, R. (2014). User experience and expectations of haptic feedback in in-car interaction. Proceedings of the 13th International Conference on Mobile and Ubiquitous Multimedia (pp. 248–251). New York, NY: ACM.
Whelan, R. (2008). Effective analysis of reaction time data. The Psychological Record, 58(3), 475–482. http://doi.org/10.1007/BF03395630
[1] https://www.pwc.co.uk/megatrends and http://fortune.com/2016/03/13/cars-parked-95-percent-of-time/