
[:en]
Abstract
Access codes are a series of numbers, letters, or characters provided to a user when there is a level of identification required to gain entry to an online service, such as the claim code for an online gift certificate. The challenge with access codes is that they need to be unique enough that someone does not access the wrong information by mistake, and they need to be easy enough to enter so that the user can succeed with reasonable effort. The research presented in this paper aims to identify characteristics of access codes that affect user experience. Two between-subjects experiments varied the characteristics of the access codes including the length, characters used, presentation, and case-sensitivity to better understand the impact of the characteristics on user experience. Findings suggest the code length does not affect user experience as much as whether the code is case sensitive or if the letters are presented in upper or lowercase. This paper presents findings from experiments comparing users’ error rate, speed of entry, and ease-of-use with different access codes.
Keywords
Claim code, authentication code, case-sensitive, usable security, U.S. Census
Introduction
To answer the 2020 Census online questionnaire, the respondent of each household was asked to enter a 12-character alphanumeric access code. A unique code was mailed to nearly all residential addresses in the U.S. After entering the code, the respondent was presented with a question confirming that the address associated with that code was the respondent’s address. Once confirmed, the respondent could answer the substantive questions on the census questionnaire and submit the information, in doing so that residential address was tagged as having completed the census. There were over 165 million unique codes created for the 2020 Census. Prior to the 2020 Census, research was conducted to determine whether the characteristics of the code, including its length, the characters used (letters and/or numbers), the capitalization of any letters, and the case sensitivity of the code, affected the user experience. The usability measures of efficiency, accuracy, and user satisfaction (International Organization for Standardization, 2018) associated with different access code entries were collected. This research aimed to answer whether shorter access codes improve usability; whether the addition of letters to a numeric-only access code affects usability; and, finally, whether the display (i.e., capitalization) or input (i.e., case-sensitivity) of the letters affects access code usability. This paper shares the results of that research.
Background
Access codes often come as strings of letters or digits or in alphanumeric combinations. Often they are used in gift cards, called a “claim code” or authentication code, where the user enters the code when they are ready to make an online purchase. The monetary amount associated with the code is then reduced automatically, like a debit card. Note that access codes are fundamentally different from passwords, in that the former are assigned by the entity providing the code, and the latter are typically user-defined. And, while access codes sometimes can be used multiple times, more often, they are for single-use (as was the case with the 2020 Census) and can be discarded without reservation after their usefulness is over. A password, on the other hand, often is associated with an application that will be used more than once, and individuals are instructed to protect passwords, even ones no longer in use. Unlike access codes, passwords can be reset if forgotten.
While there is research on password creation (Baekdal, 2011; Schneier, 2009; Thomas, 2016) and there are papers describing the growing field of usable security (Balfanz et al., 2004; Garfinkel & Lipford, 2014), those papers do not discuss the characteristics of access codes that improve usability, except to recommend that user-entered codes should not be case sensitive (Ahlstrom & Longo, 2001; Pane et al., 2002; Smith & Mosier, 1986; U.S. Department of Health and Human Services, 2006).
The U.S. Census Bureau uses access codes for most of its address-based online surveys. The code allows users to access a questionnaire for a particular address. In 2016, the American Community Survey’s (ACS) code was all numeric, specifically 10-digits in length, chunked into two 5-digit fields, and printed above the address on the mail material as shown in the example in Figure 1. Chunking a long string of numbers into smaller segments is well known to help users remember the number, as is the case with telephone numbers, social security numbers, lock combinations, and credit card numbers (Mathy & Felman, 2012; Miller, 1956). For the ACS, on the first page of the online questionnaire (see Figure 1), the respondent would enter the code (called a User ID) to gain access to the rest of the questionnaire for that address. After entering the first 5-digits, the field focus (i.e., the cursor) moves automatically to the next field. Usability testing results show that users have no problems with the automated tabbing between these two fields nor entering 10-digits chunked into two fields (Ashenfelter et al., 2013). Because of this success, the tabbing and chunking design was adopted in all Census Bureau online survey data collections.
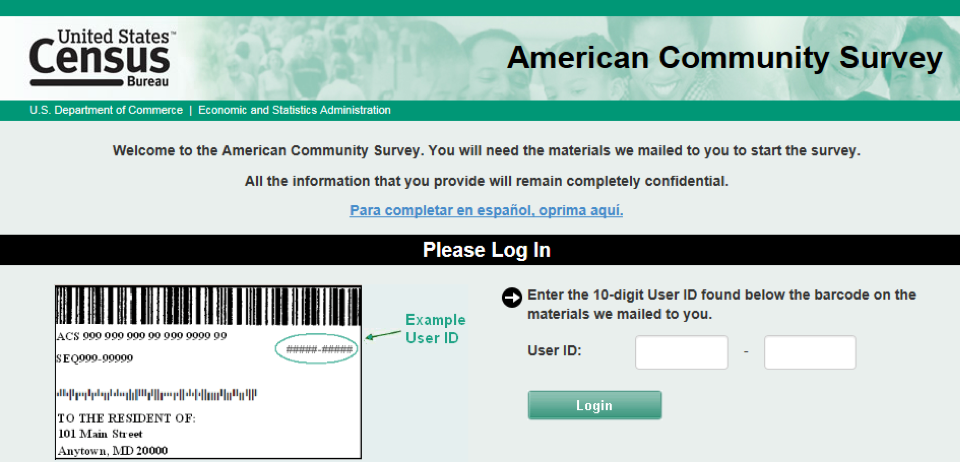
Figure 1. Screenshot of a section of the American Community Survey (2016) login page showing the location of the User ID (i.e., the access code) on the mail material. (Credit: U.S. Census Bureau)
During the decade of testing leading up to the 2020 Census, the Census Bureau conducted a series of tests. Codes used in those tests varied between 12 and 14 digits in length, with the final test in 2019 using a 12-character alphanumeric code.
Mid-decade, Census Bureau staff were concerned that a 14-digit code was too burdensome for users and would affect census response rates. This fear led to testing a shorter alphanumeric code in June 2016. In that test, the Census Bureau conducted a split-ballot test with a nationally representative sample of 8,000 residential addresses. Half the residences received an 8-character alphanumeric access code, and the other half received a 12-digit (all numeric) access code. The alphanumeric code included the following three features: all were case insensitive, commonly confused character pairs such as “0” and “o” were removed from the allowable character list, and the letters in the access code were displayed in lowercase on the mailing material. In an internal U.S. Census Bureau document, Coombs (2006) found no difference between treatments in the percent who entered the access code (called a User ID) and gained access to the survey (known as login rates). The 8-character alphanumeric code generated a 33.6% login rate, and the 12-digit code generated a 33.9% login rate.
The usability concern over the code length was the stimulus for the present research. Other than trying to avoid case-sensitive codes, we could not find much in the way of best practices for user-friendly access code creation. Our research goal was to investigate the characteristics that make access codes more or less usable for participants.
Methods
The following sections detail an overview of the study and the stimulus design, the study conditions, the sample distribution and participant characteristics, and analysis methods used on the data collected.
Overview of the Study and the Stimulus Design
This research involved in-person between-subjects experiments. The experiments were conducted to assess the usability of different characteristics of access codes including code length, character type (numbers only versus alphanumeric), case-sensitivity, and whether those characters were displayed in lowercase or in uppercase on the paper material provided to the user. These experiments only focused on usability attributes, not the security associated with different access codes.
Two separate but similar between-subjects experiments were conducted. Study conditions were the same across both experiments, with the only change being the characteristics of the access code. In both experiments, the task was to enter an access code into an online survey login screen, either on a PC or smartphone. Both devices were included because respondents take more time to complete surveys on smartphones than PCs (Couper & Peterson, 2015), and we wanted to be sure that usability findings held for both types of devices. To simulate a typical Census Bureau respondent experience, we gave participants the image of a postcard with a unique access code (Figure 2), printed on an 8.5 x 11 piece of paper, and a device (PC or smartphone) provided by the Census Bureau with the login screen open (see Figure 3 for the interfaces). On the postcard, the unique code was below the bar code but above the address block. The code was presented in Calibri 18pt black font. Participants were asked to enter that code onto the login screen and select submit. They could enter any characters into the login screen including uppercase or lowercase letters, numbers, or special characters. There were no instructions on the screen or on the piece of paper to indicate whether the entry should be case-sensitive.
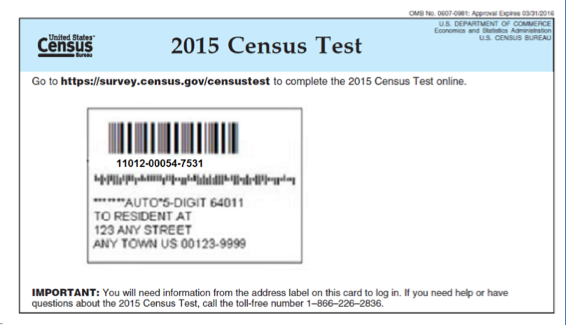
Figure 2. Example from the first experiment using the image of the postcard with one of the 14-digit access codes below the bar code. The paper design for the second experiment was identical except different access codes were tested. (Credit: U.S. Census Bureau)
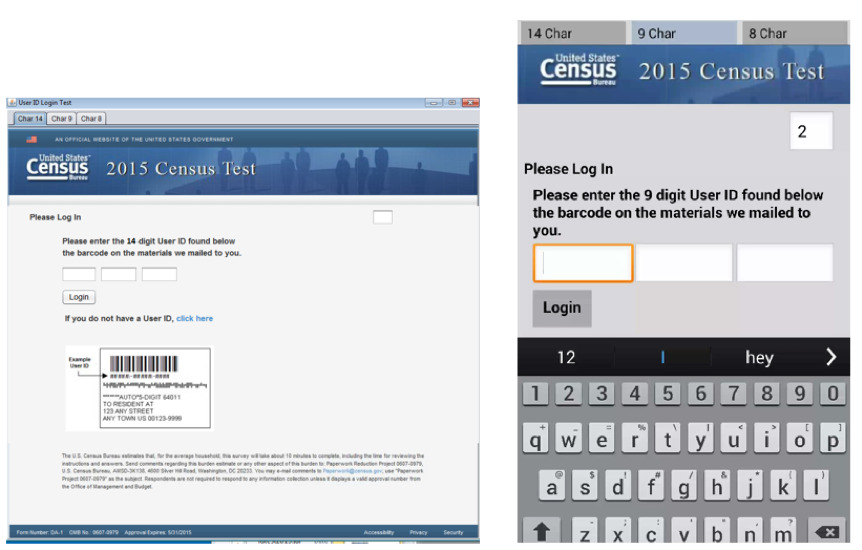
Figure 3. PC (left) and smartphone (right) interfaces for the access code entry. An image of where to find the access code on the paper material was shown just below the login button on both devices, but on the smartphone, once the keyboard was open the access code was covered, as shown. (Credit: U.S. Census Bureau)
Usability was measured as the time it took users to enter the code, whether the code was entered accurately or not, and user satisfaction with the code-entering experience was measured by an ease-of-use question. Time-on-task was measured by calculating the time between entering the first character into the field and the last character. The accuracy of the entered code was determined post hoc by comparing the submitted code to the assigned code. Participants were not notified if the code was entered inaccurately, and once submitted, participants could not change their response. After submitting the code, the participant was given a paper questionnaire with three questions. The first question asked the participant to rate how easy or difficult it was to complete the task using a 5-point rating scale with the endpoints labeled “Very easy” and “Very difficult.” The second question was “Are you male or female?”; the third question was “What is your age?” where the participant selected from predefined age ranges. The entire experiment took approximately 2 minutes to complete.
Study Conditions
The first experiment tested three access code conditions:
- 14-digit (numeric only) code (abbreviated to 14N)
- 9-character alphanumeric case-insensitive code with the letters displayed in lowercase (9AN_L)
- 8-character alphanumeric case-sensitive code (8AN_CS)
Twenty different access codes were created for each condition. Each access code was used at most one time on the PC and one time on the smartphone. By chance, each of the case-sensitive codes had letters in upper and lowercase.
Using the intercept method where researchers encouraged employees to take part in a quick experiment during lunchtime and during an employee fair, 119 Census Bureau employees at the DC-area headquarters participated between July and November 2015. Participants were randomly assigned to one of the three conditions and alternately assigned to complete the task on either a laptop or a smartphone. If the participant had no experience with sending texts using a smartphone, they were assigned to complete the task on a laptop.
The second experiment tested four access code conditions:
- 12-digit code (numeric only, abbreviated as 12N)
- 9-digit code (numeric only, 9N)
- 9-character alphanumeric case-insensitive code with the letters displayed in uppercase (9AD_U)
- 9-character alphanumeric case-sensitive code (9AN_CS)
We collected data from 156 general public participants from the Washington DC metro area in 2016. This 2-minute experiment was added onto the end of other Census Bureau cognitive or usability testing project sessions where the participants were recruited based on the other projects’ criteria. We recruited participants through Craigslist ads, word-of-mouth, and social media postings of Census Bureau employees. Similar to the first experiment, participants were randomly assigned to conditions and devices using the same smartphone check, and 20 access codes were created for each condition and used only once per device. And again, by chance, the case-sensitive codes had letters in upper and lowercase.
Across both studies and conditions, the access codes were randomly generated; the 20 actual codes for each of the seven conditions across the two experiments are shown in Figure 4 (a total of 140 unique access codes). For the alphanumeric codes, we eliminated numbers and characters that could be easily mistaken for each other: (L, I, 1), (2, Z), (B, 8), (5, S), (g, 9), (O,0), and we also removed the vowels A, E, U so that no words could be made. In spite of our efforts to avoid ambiguity in characters, we did not remove V, and in two of the 80 alphanumeric codes, the double V (“VV”) could have looked like a W to some participants. We also were somewhat constrained by census rules that dictated that the last two characters be digits ranging from 0 to 9.
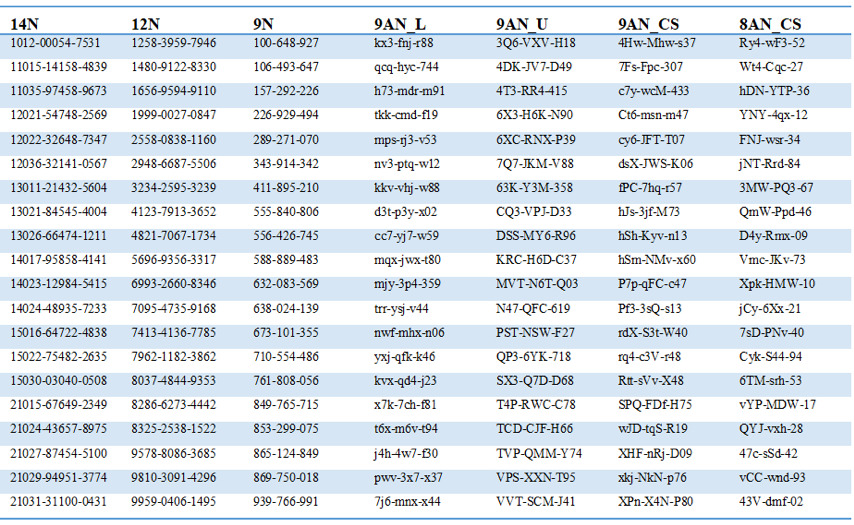
Figure 4. Screenshot of a table with the access codes used in the experiments. (Credit: U.S. Census Bureau)
Sample Distribution and Participant Characteristics
Table 1 shows the number of participants who completed each condition by device. Table 2 presents the sex and age ranges of the participants.
Table 1. Number of Participants Across Conditions and Devices
|
Condition |
Dell 15” laptop |
Samsung Galaxy S5 smartphone (5”) |
|
14N |
20 |
20 |
|
12N |
20 |
20 |
|
9N |
20 |
20 |
|
9AN_L |
20 |
20 |
|
9AN_U |
20 |
17 |
|
9AN_CS |
19 |
20 |
|
8AN_CS |
19 |
20 |
Table 2. Participant Demographic Characteristics Combined Across Experiments
|
Characteristics |
Total |
|
Age |
|
|
18-24 |
26 |
|
25-34 |
69 |
|
35-44 |
52 |
|
45-54 |
63 |
|
55-64 |
45 |
|
65+ |
20 |
|
Sex |
|
|
Male |
96 |
|
Female |
179 |
Analysis
The data across the two experiments were combined for analysis because the participant pool from the two experiments did not affect usability results. To arrive at this conclusion, we compared the overall time-on-task, accuracy and ease-of-use data between the two groups. We found no evidence that the participant pool affected the time-on-task (Pooled t-test = -.4, p = .7), accuracy (χ2 (1) = .4, p = .5), or ease-of-use (χ2 (1) = .1, p = .8). As such, we collapsed the data across the two experiments assuming that Census Bureau employees would not be that different from the general population.
Testing different 9-character designs across both experiment 1 and 2 allowed us to compare if and how user experience differed based on the attributes of character type, that is, numeric only compared to alphanumeric (examples shown in Figure 4; 9N vs. 9AN_L, 9AN_U, 9AN_CS), case-sensitivity (9AN_CS vs. 9AN_L, 9AN_U), and whether the letters were displayed in lowercase or in uppercase on the paper material (9AN_L vs. 9AN_U), controlling for access code length. Likewise testing different access code lengths including 14N, 12N, and 9N and then 8AN_CS and 9AN_CS allowed us to assess whether the length affected user experience.
Where appropriate, mixed models were used because each access code was used by two different participants, and the repeats were unbalanced in a few of the conditions because of operational errors.
To measure efficiency, we ran a linear regression model on the log of the time data with the independent variable of condition and fixed effect for the device type, participant’s sex, and a recode of the age variable (55+, <55). We recoded age because older adults perform tasks on devices more slowly than younger adults (Sultana & Moffatt, 2019).
To measure accuracy, we ran a mixed logistic model on the accuracy data (accurately entered/not accurately entered) with the independent variable of condition, fixed effects for the device type, participant’s sex, participant’s age (recoded to 55+, <55), and a random effect on the residuals for the access code. We had no expectation that the covariates would be significant in the model.
To measure satisfaction, we used the participant-reported ease-of-use data. In the first experiment, over 75% of the participants selected “Very easy” no matter the condition they received, and only one participant selected “Very difficult.” In the second experiment, a similar phenomenon happened. Ease-of-use data were recoded into a binary variable (Very easy/All other responses) because of small cell sizes. We ran a mixed logistic model on these data (Very easy/All other responses) with the independent variable of condition, fixed effects for the device type, participant’s sex, participant’s age (55+, <55), and a random effect on the intercept for the access code. While we expected no significant effect of sex, literature has shown that older adults are more satisfied with experiences than younger adults (Reed et al., 2014).
Results
The following sections present the results for efficiency, accuracy, and ease-of-use.
Efficiency
Figure 5 contains the mean time taken to enter the access code by condition with 95% confidence intervals (CI). Results of the linear model showed that condition was a significant predictor of time (F = 7.65, p < .0001). As expected, the covariates device type (F =52.56, p < .0001) and age (F = 65.8, p < .0001) were significant in the expected direction, that is, it took more time to enter the code on mobile devices and among older participants. We found no evidence that the sex of the participant influenced time (p = 1.0). Adjusting for multiple comparisons, using the Bonferroni method, the least square means results comparing the individual conditions showed the following:
- For all-numeric codes, there was no evidence of participants taking any more or less time to enter longer or shorter codes (9N vs. 12N, p = 1.0; 9N vs. 14N, p = .2; 12N vs. 14N, p = 1.0).
- For the case-sensitive alphanumeric codes, there was no evidence of participants taking more or less time to enter longer or shorter codes (8AN_CS vs. 9AN_CS, p = 1.0).
- For the case-insensitive access codes, the codes presented in lowercase took participants significantly less time to enter than the codes presented in uppercase (9AN_L< 9AN_U, p = .006).
- Comparing all the access codes with nine characters (alphanumeric/digit), we found the following:
- no evidence of a time difference between 9N and 9AN_L (p = 1.0)
- 9N took participants less time to enter than 9AN_CS (p = .002) and 9AN_U (p = .03)
- 9AN_L took participants less time to enter than 9AN_CS (p = .0003)
- no evidence of a time difference between 9AN_CS and 9AN_U (p = 1.0)
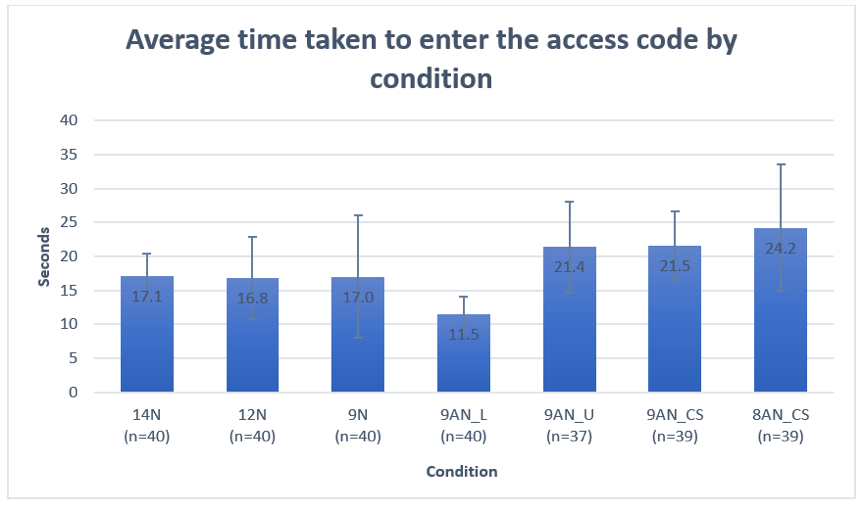
Figure 5. Average time taken to enter access code condition with 95% CI. (Credit: U.S. Census Bureau)
Accuracy
Figure 6 shows the percent of accurate codes entered by condition with 95% confidence intervals. Results of the mixed logistics model showed that condition was a significant predictor of accuracy (F = 3.8, p = .002). Device type (F = 4.0, p = .05) was significant in an unexpected direction with mobile phones being more accurate than laptops, but age (F = .7, p = .4) and sex (F = 0, p = .9) were not significant in the model. Adjusting for multiple comparisons using the Bonferroni method, the least square means results at the α = .1 showed
- no evidence that the accuracy rate of two alphanumeric case-sensitive access codes differed from each other at the α = .1 level (8AN_CS vs. 9AN_CS, p = 1.02), but
- the accuracy of entering the 9-character case-sensitive access code was lower than many of the other codes tested, including all of the numeric-only codes: 9AN_CS<14N, p = .1; 9AN_CS<12N, p = .1; 9AN_CS<9N, p = .1; 9AN_CS<9AN_L, p = .1.
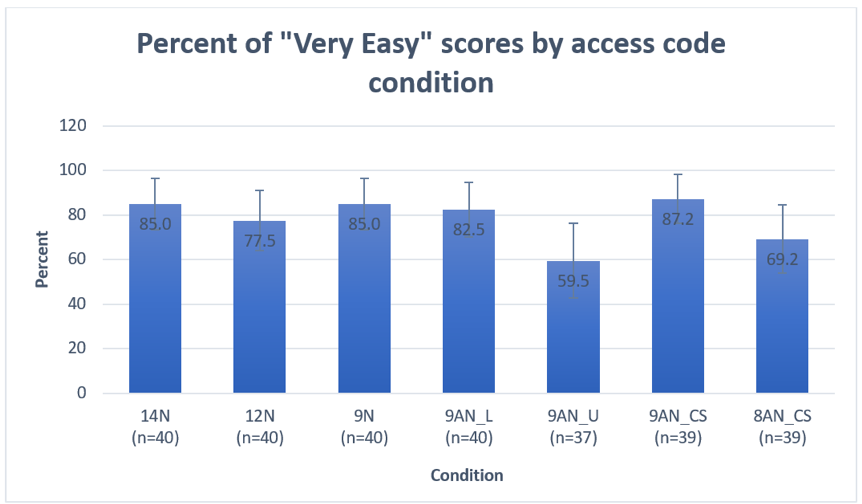
Figure 6. Accuracy rate for each access code condition with 95% CI. (Credit: U.S. Census Bureau)
Ease-of-use
Figure 7 shows the percent of participants who selected “Very easy” to the ease-of-use question by condition with 95% confidence intervals. Results of the mixed logistics model showed that condition was a significant predictor of ease-of-use (F = 2.3, p = .04) as was age, in the expected direction (F = 4.0, p = .05) with older adults more often reporting that the task was very easy compared to younger adults. Device type (F = 1.4, p = .2) and sex (F = 2.4, p = .1) were not significant. Adjusting for multiple comparisons, using the Bonferroni method, the least square means results at the α = .1 showed only one significant difference in ease-of-use between conditions: 9AN_U received significantly fewer “Very easy” ratings compared to the 9AN_CS (p = .1), even though we found that participants were more likely to enter the case sensitive code incorrectly.
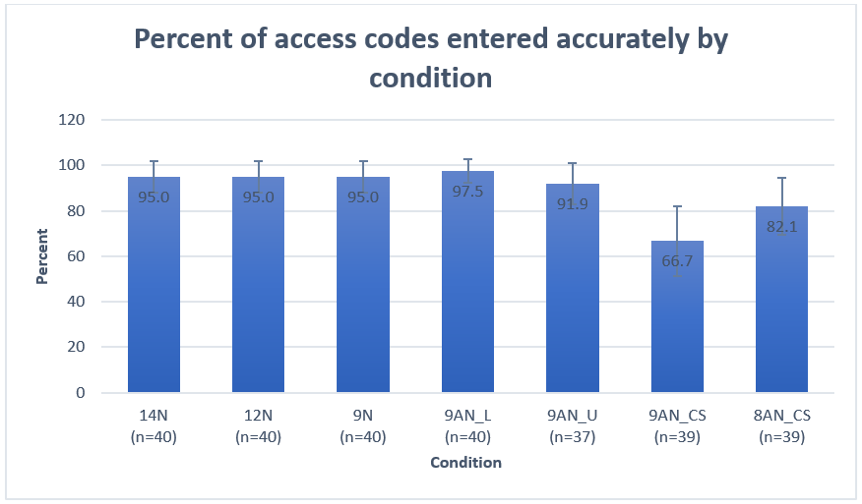
Figure 7. Satisfaction as measured by ease-of-use score associated with each access code condition with 95% CI. (Credit: U.S. Census Bureau)
Recommendations
When possible, using all numeric access codes is a good solution based on the user-experience data collected through this research. All numeric codes generate low task times, high accuracy, and high ease-of-use. Depending upon the security needed, this research suggests that increasing the number of digits to enter might not negatively affect user experience, as we did not find significant user experience differences when the number of digits increased by two, three, or five digits when using chunking. This finding suggests that user experience degradation is not linear as the numeric entry task increases.
If an alphanumeric code is needed (e.g., in order to increase the number of possible combinations for security reasons), this research suggests presenting the letters in lowercase to the user, instead of uppercase, and making entry of the code case insensitive. This research confirms the difficulty users have with case-sensitive access codes, which other researchers have also found (Ahlstrom & Longo, 2001; Pane et al., 2002; Smith & Mosier, 1986; U.S. Department of Health and Human Services, 2006).
Regarding case display for case insensitive codes, while uppercase is currently conventional, we found evidence that lowercase was both more efficient and easier to use. Future research should further explore the pros and cons of presenting alphanumeric access codes in all uppercase versus all lowercase letters. It would also be useful to determine whether and how instructions about case sensitivity affect time-on-task, accuracy, or ease-of-use. The present study did not instruct users whether the access codes were or were not case-sensitive.
One avenue of research that was not investigated in the present study was the effect of chunking. For these experiments, the codes were chunked into three fields with automated tabbing between the fields. Future research could also investigate the effect of chunking on user experience. For example, would two fields of six characters each be easier or more difficult to use than three fields of four characters each? And, would the usability of that design be different dependent on the age of the user?
Finally, in the present study, the device was provided to the participant. Replication of the study with participants answering on their own devices would make the findings more robust.
Conclusion
We found evidence that the characteristics of access codes can affect user experience. Specifically, we found indication that all-numeric codes take less time to enter than most alphanumeric codes of the same length. For codes of nine characters in length, chunked into three parts, all-numeric codes took less time to enter than either case-sensitive alphanumeric codes or case-insensitive alphanumeric codes displayed in uppercase. We did not find a time difference between the 9-digit code and an alphanumeric code in lowercase. Reducing a code by one, two, three, or five characters in length did not significantly reduce the time needed to enter the code and did not improve the accuracy rate of entering the code as demonstrated by the reduction of 14 to 12 digits, 12 to 9 digits, 14 to 9 digits, and the 9 to 8 case-sensitive alphanumeric codes tested. As for accuracy, participants were more likely to enter case-sensitive alphanumeric codes incorrectly than either case-insensitive alphanumeric codes or numeric-only codes, which supports the general usability advice of the U.S Department of Health and Human Services: “Do Not Make User-Entered Codes Case Sensitive.”
In the present study, the case-insensitive alphanumeric code displayed in lowercase performed well, with low time-on-task, high accuracy, and ease-of-use. This could be a solution for situations when security concerns require a more challenging code (e.g., concerns that digit-only code strings could inadvertently be used by multiple users).
Some participants experienced issues with case-insensitive alphanumeric access codes when the codes were presented in uppercase. Participants took longer to enter this type of code and rated the experience as more difficult than other types of codes.
The difficulty with the all-uppercase alphanumeric codes was a somewhat surprising finding because this style is currently conventionally used. Participants provided with the alphanumeric access code in lowercase did not seem to have the same issues as those who were presented with the characters in uppercase.
Perhaps the fact that the characters were in lowercase suggested that they were not case sensitive, but when characters were in uppercase there was some question as to whether entry needed to be case sensitive, and the slight pause to consider whether to enter the code using capitalization led to the increase in time-on-task and the more negative ease-of-use rating. Providing instructions about the case sensitivity or insensitively either on the screen or on the paper might have improved the participant’s experience in these two experiments. However, it should be noted that there are many instances of respondents not reading instructions (Brosnan et al., 2019).
If participants assumed that the uppercase access code was case sensitive, the additional time or lower ease-of-use ratings could be because some of them may not like to use or know about the caps lock function on their devices. The keyboard default is lowercase and more work is required to match the case, for both PCs and mobile devices.
Finally, there is some advice about not using all capitalization in Smith and Mosier (1986), but their guidelines reference the difficulty in reading words in all capitals. That would not be the issue with the access codes tested in the present study as they did not spell anything. However, perhaps some of the same principles exist even when reading letters. The all-uppercase access codes have a block type look, while the lowercase access codes appear to be easier to distinguish because of the descenders (g, j, p, q, y) and ascenders (b, d, f, h, i, j, k, l, t) that gives the access codes more shape variety and perhaps allows users the ability to keep their place when transcribing the characters from the paper to the device.
2020 Census Access Code
Ultimately, the 2020 Census used a 12-character alphanumeric case-insensitive code presented in uppercase on the mail material as shown in Figure 8. The security of the 2020 Census was paramount. The access code needed to be complex enough so as to minimize any chance that someone would inadvertently or overtly complete the wrong census form. The number of access codes needed to cover the entire nation was the driver for the alphanumeric code. With the letters and numbers used, the likelihood of entering an access code for the wrong address was one in over several million. To achieve the same odds, an all-numeric code would have to have been much longer. The letters of the code were printed in all uppercase because uppercase is conventionally used in access codes. As the alphanumeric uppercase decision was made only one year out from the census, there was not enough time to do more testing of lowercase.
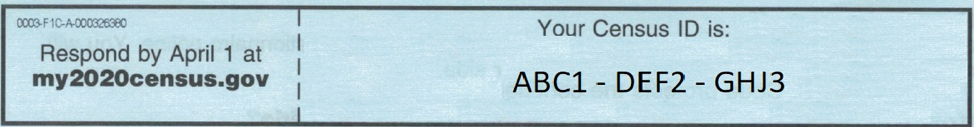
Figure 8. Snapshot of a 2020 Census faux access code from the initial letter. The example Census ID (i.e., access code) is ABC1-DEF2-GHJ3. (Credit: U.S. Census Bureau)
Tips for Usability Practitioners
Do not require case-sensitive access codes for entry.
This research confirms that requiring case-sensitive access codes increases the number of data entry errors.
There are always trade-offs between operations and usability.
Small gains in usability always have to be weighed against operational issues, as illustrated by the security concerns with the access code design for the 2020 Census. Timing and sample size also come into play. As is often the case with usability findings, our sample sizes were relatively small and there was not enough time to do a larger study to confirm the advantages of lowercase while insuring there were no unforeseen problems with it in a production setting prior to the actual census.
Conduct quick data collection projects with an intercept method or at local fairs.
One challenge for our research questions—to measure the usability of different types of access codes—was how to collect the data. The experiment itself took 2 minutes. We did not want to recruit participants only for this study as that would be a waste of their time, our time, and any incentive payment.
Fortunately, our timetable lined up beautifully with an employee fair at the Census Bureau headquarters. At the innovation fair, our usability lab team sponsored a table (we won first place that year!), and we lured employees in by having an eye-tracking demo. Another “station” at our table was to participate in a short 2-minute experiment—this experiment. We were able to run about 60 participants over the course of a day. The remaining participants we ran by sitting in the cafeteria and using the intercept method to gather the remaining data needed.
Add quick research projects onto other longer user sessions as “piggy-back” projects.
For our second experiment, we didn’t want to use Census Bureau employees as our participants in the event they behaved differently than the general public. Fortunately for us, our center at the U.S. Census Bureau conducts a lot of qualitative pretesting. Over the course of a year, we were able to tack this study onto other projects. This was our first usability “piggy-back” project. The study was cleared independently under the Office of Management and Budget (this is similar to an IRB but focuses on respondent burden), and we made sure to add the 2-minute study onto projects where the following was true:
- The sponsor of the other project was agreeable.
- The test administrator was also agreeable.
- It would not increase the time burden for the primary study beyond what they had already told the participant.
Use detailed instructions and record keeping for test administrators when using the “piggy-back” strategy.
Because the test administrator varied across all staff in our group, we had a set of detailed instructions on how to run the experiment, with precise language to read aloud to participants. We also had a record keeping system in case we needed to follow up with a test administrator on where the consent form or the ease-of-use questionnaire was. Imagine that!
“Piggy-back” projects are still quite unusual in our center because they require more time to collect the data, but they offer some advantages if time is not of the essence.
For A/B testing, recruit participants from all appropriate age groups and conduct experiments on different devices.
While many usability projects are qualitative in nature, if you are conducting A/B experiments measuring time-on-task or satisfaction, be sure to conduct your study with a variety of devices and a variety of participant ages. The present study replicated findings from other research concerning how device type and age affect user experience. In our study, participants took longer to answer on smartphones compared to laptops, which matches the Couper and Peterson (2015) research. Older adults took longer to complete the task than younger adults, which matches Sultana and Moffatt’s (2019) findings. And, older adults were more satisfied with the experience than younger adults, which matches Reed et al. (2014).
Acknowledgments
We thank Luke Larsen, Michael Bentley, Julia Coombs, Kristen Hearns, Joanne Pascale, and Paul Beatty for their reviews of earlier drafts of the paper; David Lee for programming the app for the smartphone; and all our test administrators for collecting the data.
Disclaimer
This report is released to inform interested parties of research and to encourage discussion. The views expressed are those of the authors and not necessarily those of the U.S. Census Bureau. The disclosure review number for this paper: CBDRB-FY20-437.
References
Ahlstrom, V., & Longo, K. (2001). Human factors design guide update: A revision to Chapter 8—Computer human interface guidelines (Report Number: DOT/FAA/CT-96/01). Atlantic City International Airport: Federal Aviation Administration William J. Hughes Technical Center. http://www.tc.faa.gov/its/worldpac/techrpt/ct01-8.pdf
Ashenfelter, K., Holland, T., Quach, V., & Nichols, E. (2013). Final Report for the usability evaluation of ACS 2011 online instrument rounds 4a and 4b. U.S. Census Bureau. SSM:2013/04. https://www.census.gov/content/census/en/library/working-papers/2013/adrm/ssm2013-04.html
Baekdal, T. (2011). The usability of passwords—FAQ. https://www.baekdal.com/insights/the-usability-of-passwords-faq
Balfanz, D., Durfee, G., Smetters, D. K., & Grinter, R. E. (2004). In search of usable security: Five lessons from the field. IEEE Security & Privacy, 2(5), 19–24. doi:10.1109/MSP.2004.71
Brosnan, K., Babakhani, N., & Dolnicar, S. (2019). “I know what you’re going to ask me”: Why respondents don’t read survey questions. International Journal of Market Research, 61(4), 366–379.
Coombs, J. (2017). 2020 research and testing: Analysis report for the small-scale mailout testing program June 2016 test on the placement and length of the user ID for an online census bureau survey. U.S. Census Bureau. 2020 census program internal memorandum series: 2017.2.i
Couper, M. P., & Peterson, G. (2015). Exploring why mobile Web surveys take longer. Presentation at the General Online Research Conference 2015 Conference. http://www.gor.de/category/gor-15
Garfinkel, S., & Lipford, H. R. (2014). Usable security: History, themes, and challenges (synthesis lectures on information security, privacy, and trust). Morgan & Claypool. https://doi.org/10.2200/S00594ED1V01Y201408SPT011
International Organization for Standardization. (2018). Ergonomics of human-system interaction—Part 11: Usability: Definitions and concepts. (ISO Standard No. 9241-11:2018). https://www.iso.org/standard/63500.html
Pane, J. F., Myers, B. A., & Miller, L. B. (2002). Using HCI techniques to design a more usable programming system. Proceedings IEEE 2002 Symposia on Human Centric Computing Languages and Environments, Arlington, VA, USA. pp. 198–206. https://doi.org/10.1109/HCC.2002.1046372
Mathy, F. & Feldman, J. (2012). What’s magic about magic numbers? Chunking and data compression in short-term memory. Cognition, 122(3), 346–362.
Miller, G. A. (1956). The magical number seven, plus or minus two: some limits on our capacity for processing information. Psychological Review, 63(2), 81–97.
Reed, A. E., Chan, L., & Mikels, J. A. (2014). Meta-analysis of the age-related positivity effect: Age differences in preferences for positive over negative information. Psychology and Aging, 29(1), 1–15. http://dx.doi.org/10.1037/a0035194
Schneier, B. (2009). The secret question is: Why do IT systems use insecure passwords? The Guardian. https://www.theguardian.com/technology/2009/feb/19/insecure-passwords-conflickerb-worm
Smith, S. L., & Mosier, J. N. (1986, August). Guidelines for designing user interface software. The MITRE Corporation Technical Report (ESD-TR-86-278). https://rauterberg.employee.id.tue.nl/lecturenotes/DA308/MITRE(1986)smith-mosier.pdf
Sultana, A., & Moffatt, K. (2019). Effects of aging on small target selection with touch input. ACM Transactions on Accessible Computing, 12(1), 1–35. https://doi.org/10.1145/3300178
Thomas, D. (2016). The current state of authentication: We have a password problem. Smashing Magazine. https://www.smashingmagazine.com/2016/06/the-current-state-of-authentication-we-have-a-password-problem/
U.S. Department of Health and Human Services. (2006). Research-based web design and usability guidelines. https://www.hhs.gov/sites/default/files/research-based-web-design-and-usability-guidelines_book.pdf
[:]