
Abstract
When survey respondents have nothing to report for questions asking for a quantity, they should report a lack of quantity instead of skipping the question. Reports of zero can be collected by asking respondents to check a None box. However, the effectiveness of this design has not been supported and, with the growing prevalence of web surveys, new design options are available. This study on data quality and user experience tested a web survey and the impact of three designs for reporting zero: a None box, instructions to enter “0” if respondents had nothing to report, and a Yes/No filter question preceding a write-in quantity. We administered the online survey to an opt-in panel of respondents in the U.S. Respondents were randomly assigned one of the three designs. They received a four-question survey with expected high rates of reporting zero. After controlling for demographic variables, we found that the None Box design resulted in significantly more item nonresponse than the Enter 0 design and nominally more than the Filter Question design. Additionally, the None Box design was the least efficient as it took more time on average to answer, and respondents who received that design rated the survey as less easy to answer. These findings align with previous literature that the None Box design is problematic. This research supports the use of alternative question designs in web surveys such as entering “0” or using filter questions when respondents may not have anything to report.
Keywords
None box, questionnaire, web survey, survey design, data quality, filter questions, item non-response
Introduction
Web-based surveys have become a dominant mode of collecting survey data. According to the European Society for Opinion and Market Research (ESOMAR) (2018), web survey use in 2018 was more than double that of 2007. With around 93% of adults in the U.S. using the internet (Pew, 2021), it is no surprise that web surveys are an increasingly popular way to collect responses. In fact, for the first time in U.S. history, the 2020 decennial census could be completed online—a change that proved to be a success. Over 80% of self-responders answered the web survey instead of the paper form or phone option (U.S. Census Bureau, 2020). Over the past 2 decades, web surveys have changed from a novelty to the norm. With this shift has come the recognition of the importance of good web instrument design as it can affect respondent behavior. Therefore, it is imperative to optimize web survey design for user experience (Groves et al., 2011).
Historically, web surveys were designed to mimic pen and paper surveys, which led to the design of many web surveys as carryovers from their paper-based predecessors. However, some design components unique to web surveys have shown an advantage over paper designs, such as predictive text (Couper & Zhang, 2016), item-missing checks (DeRouvray & Couper, 2002), conditional branching (Nichols et al., 2018), and edit/error checks (Conrad et al., 2006, 2009; Kunz & Fuchs, 2019; Peytchev & Crawford, 2005). Web survey design continues to evolve as researchers work to reduce the amount of measurement error caused by the design features within a survey (Tourangeau et al., 2013). Therefore, it is important to reassess design standards that were grandfathered in from pen and paper surveys. One such feature, which has little supporting evidence for its effectiveness, is the None box.
Establishment and household surveys often include questions asking for quantities, such as how many employees work at firm X, or how many doctor visits a person had, etc. None boxes are a response option that allows respondents to indicate that they have none, or zero. This is different than a question not being applicable to a respondent; the question applies but their answer is that they have nothing, or zero, to report.
Figure 1 provides an example of a question that includes a None box. The question asks respondents how much they paid in electricity last month. There are two ways to answer this question: check the None box on the left, or provide an amount in the write-in field on the right. Some people have electricity in their residences that they pay for. These respondents would enter the amount they were charged in the write-in field. However, not every home has electricity, and respondents in those homes would therefore check the None box to indicate they did not pay for electricity and, therefore, do not have an amount to report.

Figure 1. Example of the None box format.
Including a None box provides a response option for all respondents, even if they do not have a substantive response, with the aim of reducing item nonresponse and measurement error (Jenkins, 1992). Take, for example, the question asking how much you paid for electricity last month. Respondents who paid for electricity can enter the dollar amount in the write-in field. However, if someone did not pay for electricity, it may not be clear that they should enter “0” in the write-in field. The None box provides a clear indication of where that response should be entered. By providing an applicable response option for each question, it can avoid teaching respondents that leaving questions blank or unanswered is acceptable response behavior (Dillman et al., 2005). If questions are left blank, survey analysts are required to make assumptions, either that blank equals zero or that blank is missing, yet both of which could be wrong and could skew survey results. Therefore, None boxes are designed to elicit a response from all respondents and reduce measurement error. However, None boxes may not fulfill these goals; evidence suggests they can be problematic for respondents in both paper and web surveys.
Although research on None boxes is scant, the literature that is available provides little evidence that this design feature functions as intended. In an ideal world, respondents who have a quantity to report would enter it in the write-in field, and those who have nothing to report would select the None box. However, in practice, this does not regularly happen and, in fact, the None box is often ignored, or not noticed.
Although it is not particularly problematic if respondents enter “0” in the write-in field, it is not the most effective way to collect data. For example, in cognitive testing of the paper-based School and Staffing Survey, Jenkins (1992) observed that—for questions asking about quantities—respondents often did not notice the None box and instead entered “0” in the write-in field. The author believed that respondents were not expecting the None box and responded to the question as they had other questions in the survey: by providing their answer in the space provided. This phenomenon was also seen by Grondin and Sun (2008) in the Canadian Census. In the paper version, respondents occasionally entered “0” in the entry field instead of checking the None box when asked how many hours they worked last week. In these cases, the final data are the same regardless of how the indication of zero was communicated by the respondent.
From a usability perspective, the None box does not provide additional value. The web version of the Canadian Census included a None box but did not allow respondents to enter “0 hours” in the write-in field; respondents who entered “0 hours” received an error message saying the reported value must be between 1-168 hours. The authors found respondents were more likely to report 1 hour worked compared to paper reporters. To explain this discrepancy, Grondin and Sun (2008) reasoned that confusion around the None box was to blame. Respondents who received the error but were unclear on how to indicate they did not work likely entered “1 hour” instead of checking the None box. Forcing respondents to use the None box and not allowing them to enter “0” in the write-in field was an untraditional design choice, but the fact that respondents still did not use the None box after receiving the error message again puts its usefulness into question.
While the scenarios described above are not problematic from a data quality perspective, misuse of the None box can become an issue if respondents skip the question entirely. Specifically, in the Norwegian Census paper survey, researchers found that the most common questions left unanswered were those using a None box (Haraldsen et al., 2002). These questions asked for the number of rooms of a particular size in the household. In cognitive testing, the questionnaire did not have a None box, and they found that respondents did not write in “0” when they had nothing to report. Based on these findings, a None box was included in the final questionnaire. However, there was still item nonresponse, with respondents neither checking the box nor writing in “0.” The authors speculated that the question was not answered because the respondents did not have any bedrooms of the size in question, yet they should have checked the None box.
Another study of a paper questionnaire experimented with making the None box visually evident to respondents to avoid it being unintentionally overlooked. After adding a highlight around the None box, Moore et al. (2016) found that respondents’ use of None boxes increased and the rate of writing in “0” decreased compared to the non-highlighted design. Highlighting the None box, however, also resulted in a higher percentage of item nonresponse for 12 of the 13 questions. This suggests that the design confused respondents and data quality may actually decrease if respondents notice the None box.
One reason respondents may struggle with providing a zero response to survey questions is because they are asked in a way that assumes the respondent has something to report. For example, “How much did you pay for electricity last month?” or “How many bedrooms are in your house?” assume the respondent paid for electricity and has at least one bedroom, respectively. This leaves respondents in a position where they must discern how to report a response that is not implied in the question, which can be difficult for respondents and increase error (Dillman et al., 2005; Groves et al., 2011).
Most of the research on None boxes is from paper questionnaires and is not experimental. Therefore, the behavioral impact of None boxes in web surveys is, to this point, speculative. Web surveys offer more flexibility than paper, allowing for alternative designs to elicit responses from those who have nothing to report for numeric response questions. For example, to avoid the implied quantity issue, a Yes/No filter question can be asked to determine whether the respondent has something to report before asking the quantity. Alternatively, question stems can include an instruction to enter “0” if respondents have nothing to report for that question. That way, all respondents are instructed to provide an answer even if they have nothing to report. It is possible that these alternative designs could perform better in a web survey than the None Box design in collecting quality data and providing a positive user experience. However, there is no empirical evidence to support their use. Thus, there remains a need to empirically test the utility of None boxes in web surveys and explore how alternative designs compare in the resulting data quality and user experience.
Method
The purpose of this study was to test the impact of a None Box design on data quality and user experience for household web surveys while exploring alternative designs for eliciting responses to questions that might not apply to all respondents. The goal was to identify the most effective design to elicit a numeric response from every respondent, even if some respondents had nothing to report. To do this, we conducted an online experiment testing three different designs. In this paper, “reporting zero” refers to responses that indicate the respondent had nothing to report, which they can enter differently depending on the question design.
Experimental Design
We conducted a split-panel survey experiment with three designs to explore the optimal design for survey questions that ask respondents to provide a numeric answer when the question might not apply to all respondents. The first design employed the traditional None Box design (Figure 2). The second design, the Enter 0 design, employed a short instruction after the question stem that directed respondents to enter “0” in the entry field if they had nothing to report (for example, “If none, enter ‘0’”) (Figure 3). The third design, the Filter Question design, asked a filter question first to determine if the quantity question applied to the respondent for the specific topic (“Are there any children or youth age 20 or younger living in this household?”). If they selected Yes, a follow-up question appeared so they could enter a quantity for the topic in question (“How many children or youth age 20 or younger live in this household?”). If they selected No, the follow-up question did not appear (Figure 4).
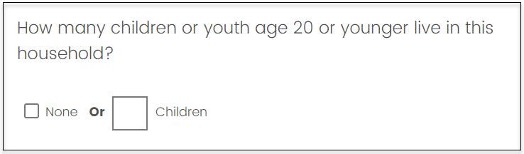
Figure 2. Example of the None Box design.
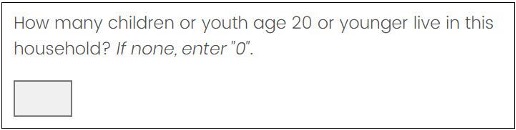
Figure 3. Example of the Enter 0 design.
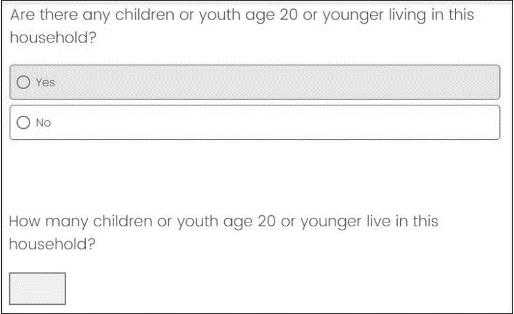
Figure 4. Example of the Filter Question design. (The second question appears only if the respondent selects Yes.)
We employed a between-subjects experimental design in which the respondents were randomly assigned to one of the three designs. In the treatment groups, 150 respondents were in the None Box group, 150 respondents were in the Enter 0 group, and 150 respondents were in the Filter Question group (see Appendix 1 for the distribution of respondent characteristics across the experimental group). Our counts were rounded in accordance with the Census Bureau disclosure policy. Each survey consisted of four questions of the same design (None Box, Filter Question, or Enter 0); the four questions were placed throughout a larger survey that contained 20 questions total. The four experimental questions asked the following: a) how many children are in the household, b) how many meals were eaten alone last week, c) the cost of water and sewer for the household last month, and d) the cost of gas for the household last month. Because we wanted to evaluate how respondents reported not having something, we selected these four questions because they have previously resulted in a relatively high proportion of zero or non-substantive reports.
Every question in the survey was programmed on its own screen, except follow-up questions in the Filter Question design which appeared below the filter question on the same screen if respondents indicated they had something to report.
Programming each question on its own screen also allowed us to observe respondent behavior, such as mouse clicks and timing, to specific questions.
Respondents
Data collection was facilitated through Qualtrics™. The company recruited respondents through an online, non-probability opt-in panel. A recruitment quota was set so that respondents were evenly represented from the four geographic U.S. Census regions (West, Midwest, South, and Northeast). Another quota was set to have respondents evenly represented across four age groups: 18-30, 31-45, 46-60, and 60 and older. Approximately 500 adults (rounded in accordance with Census Bureau disclosure policy) completed the survey and received an incentive paid through the panel provider. Completed surveys were defined as reaching the end of the survey, not by responding to each question. Most questions in the survey did not require respondents to provide an answer before moving to the next question.
All study respondents were English-speaking and had access to the internet as well as a computer that connected to the internet. No mobile device responses were included in this study because some design aspects being tested did not render acceptably on mobile devices. Furthermore, any respondents whose completion time was less than half of the median time it took pre-testers to complete the survey were also removed given their suspected inattentiveness.
Respondent age ranged from 18-98 years old with a mean age of 46.5 years. Forty-seven percent of the respondents were male, and 52% were female. Less than 3% of the respondents did not provide their sex (percentages do not sum up to 100% due to rounding). Racially, respondents were similar to the U.S. population (U.S. Census Bureau, 2019), with 71% White, and 29% mixed or another race (including Hispanic ethnicity). Most respondents, 61%, reported receiving education beyond high school.
Data Collection
For the purposes of this study, we developed a survey using questions mostly from previous Census Bureau questionnaires, such as the American Community Survey and the National Household Education Survey. The entire survey consisted of 20 questions on topics such as demographic characteristics, wages, and features of the housing unit. Additionally, there was an attention check question at the beginning of the survey as well as preference and satisfaction questions to evaluate respondents’ opinions on the three design options.
The survey was designed and developed on the Qualtrics platform. Before launching the survey, it was pre-tested with Census Bureau staff as well as participants from the target population to ensure comprehension, instrument functionality, and design consistency across different browsers and computers. The panel of respondents completed the survey using their own computers and were then compensated. All survey data were collected within a 4-day period in September 2020.
Evaluation Metrics
After the survey questions, a post-survey questionnaire collected data on the perceived difficulty of the entire survey (“How easy or difficult was it to complete this survey?”). The questionnaire also gathered respondent preferences between the different designs (see Appendix 2). To measure preference, respondents were presented with screenshots of the three designs and asked to select their preferred design. The order of screenshots was randomized across respondents to mitigate order effects.
Response data and paradata were collected for the four questions. To evaluate the impact of the designs on data quality, we looked at the distribution of reports of zero through checking the None box, entering “0,” or selecting No on the filter question. And we looked at item nonresponse. To evaluate the user experience, we looked at the occurrence of format misuse, or not answering the question in the intended manner, as well as click counts, time spent on the page, perceived difficulty, and design preference. Because timing data tend to be skewed, we removed outliers above the 99th percentile and also used the natural log of time spent on the page to approximate normality.
Analytic Approach
To account for repeated measures across respondents, we used hierarchical random effects models. Separate models were used to compare the designs across each data quality parameter (reporting frequency, item nonresponse, and format misuse) versus user experience metrics (click count and response time). Specifically, formula [1] was used to model the data quality metrics, formula [2] was similarly used to model click count, and formula [3] was used to model response time.
[1] πijk = β0jk + β1[design]ijk + β2[demographics]ijk + eijk,
where π is the success probability for the data quality indicator k, β0j = γ00 + µ0j, i = respondent level indicator, and j = question level indicator
[2] ClickCountij|eij = β0j + β1[design]ij + β2[demographics]ij + eij,
where ClickCount ~ Pois (λ), β0j = γ00 + µ0j, i = respondent level indicator, and j = question level indicator
[3] ln[ResponseTimeij] = β0j + β1[design]ij+ β2[demographics]ij + eij, where β0j = γ00 + µ0j, i = respondent level indicator, and j = question level indicator
In each model, we use the same control variables: Hispanic origin (yes/no), race (White only/non-White), sex (Male/Female), education (high school or less/more than high school), and age. These control variables were selected because there could be differences in these metrics based on the demographic characteristics, particularly age and education. We calculated the differences of the least squares means to make comparisons between all three designs, taking into account all control variables and a Bonferroni adjustment for three comparisons. In the item nonresponse and format misuse models, the cell sizes were too small for t-test comparisons between the least squares means, which violated the normality assumption. In these cases, we used bootstrap sampling to create enough observations to have a normal distribution. Specifically, we selected at least 500 samples from each treatment group, with replacement, and calculated the grand least squares mean and standard deviation from all the samples. We then used t-tests to compare the least squares means across the treatment groups.
Much of the literature focused on the lack of use or misuse of the None box, which we refer to as format misuse. We operationalized format misuse in this paper as responses that did not adhere to the intended function of the design. These misuses do not have a negative impact on data quality but do put the utility of the design into question. A format misuse for the None Box design involved the respondent performing the following: a) checking the None box and writing “0” in the entry field, b) not checking the None box and writing “0” in the entry field, or c) writing a non-numeric response in the entry field. A format misuse for the Filter Question design involved the respondent performing the following: a) selecting Yes to the filter question and entering “0” in the follow-up question, or b) entering a non-numeric response in the entry field. A format misuse for the Enter 0 design involved the respondent entering a non-numeric response in the entry field. Respondents could make a maximum of 4 format misuses (1 for each of the four questions) and a minimum of 0. Non-answered questions did not constitute a format misuse. If a question was left unanswered, it counted toward the item nonresponse metric. While the number of possible format misuses for each design was not the same, this was an accurate representation of misuses respondents could make within each design.
Item nonresponse was operationalized differently in the three designs. In the None Box design, item nonresponse was present if both the None box and the write-in field were blank. In the Enter 0 design, item nonresponse was present if nothing was entered in the write-in field. Finally, item nonresponse in the Filter Question design focused on the second question asking for an amount rather than the preceding Yes/No question. This means that item nonresponse was present in all cases in which Yes was selected on the filter question, but there was no amount provided in the write-in field on the follow-up question. Fewer than 15 responses were missing to the Yes/No filter across all four survey questions, resulting in a complete dataset for measuring item nonresponse in the second question about quantity. Our values were rounded in accordance with Census Bureau disclosure policy.
Results
Here we investigate any differences between the three question designs in terms of data quality and the user experience. For each measure investigated, we first report the point estimate of interest. These point estimates are not used for statistical testing because they do not take the repeated measures or demographic variables into account, although they do provide a summary of the data. The point estimates are followed by statistical testing from the least squares means results from the random effects models, which do take repeated measures and demographic variables into account.
Data Quality
Across the three designs, the majority of respondents reported zero (they reported None, entered “0,” or selected No on the filter question) for at least one of the four questions (Table 1). Further, there was little variation in the overall number of zero reports across designs. Specifically, respondents indicated they had nothing to report between 41–46% of the time across the three designs (Figure 5).
Table 1. Respondents Providing at Least One Zero Report in the Survey
| Design | Mean | Standard Deviation |
|---|---|---|
| None Box | 83.43% | 0.373 |
| Enter 0 | 90.64% | 0.292 |
| Filter Question | 77.78% | 0.417 |
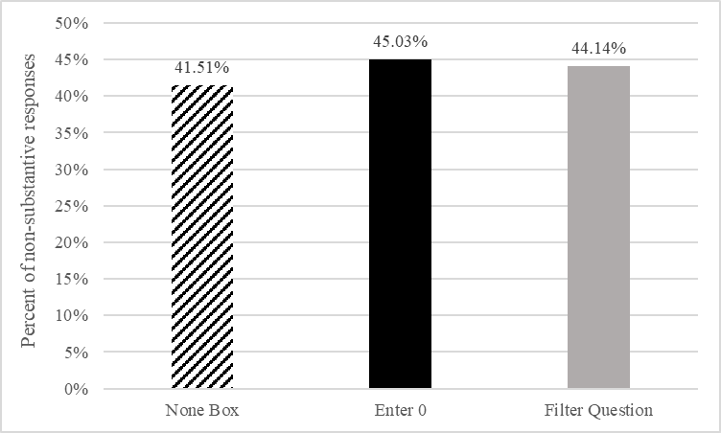
Figure 5. Percent of zero reports by design across the four survey questions.
In comparing across designs (Table 2), we do not see any significant differences between any of the designs after controlling for the demographic variables, which suggests that the question design is not related to the frequency of reporting zero (see Appendix 3 for full model information).
Table 2. Comparison of Least Squares Means Reporting Frequency
| Design Comparison | Difference | Std Error | p-Value |
|---|---|---|---|
| Enter 0 versus Filter Question | 0.032 | 0.126 | 0.7984 |
| Enter 0 versus None Box | 0.149 | 0.130 | 0.2519 |
| Filter Question versus None Box | 0.116 | 0.129 | 0.3668 |
We also see very little variation when looking at item nonresponse across question designs. Specifically, less than 3% of responses were missing in each of the three designs. Additionally, item nonresponse was very low overall with less than 2% of all cases having a missing value. Although item nonresponse was low overall, the None Box design had the highest item nonresponse rate across the three designs (Figure 6).
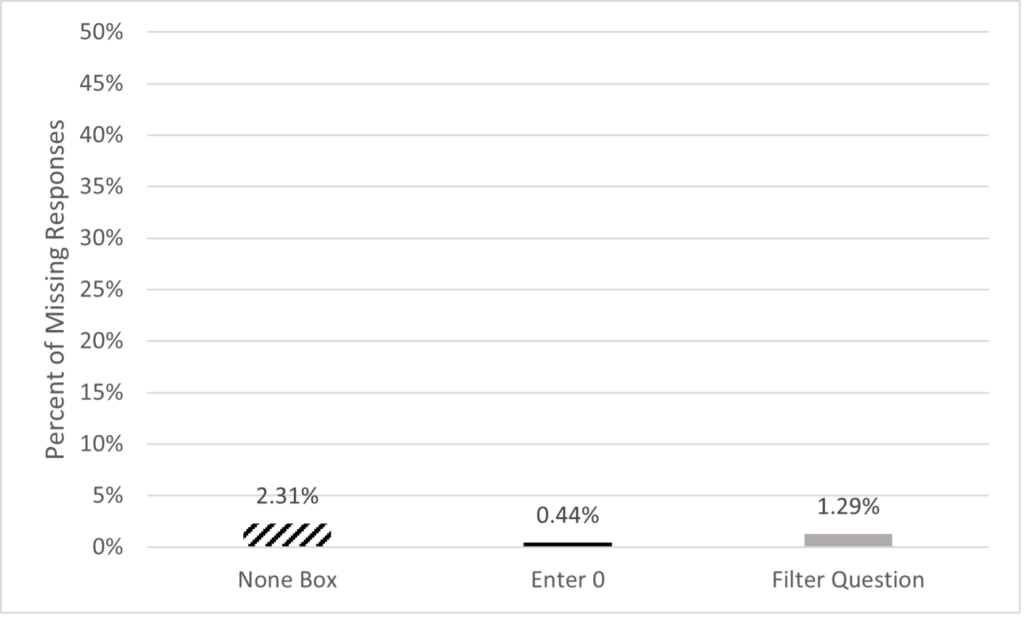
Figure 6. Percent of missing responses by design across the four questions.
When looking at the least squares means comparisons between each question design for item nonresponse, the differences for each of these comparisons (Table 3) is significant at the p < .01 level after controlling for the demographic variables (see Appendix 4 for full model information).
Table 3. Comparison of Least Squares Means for Item Nonresponse
| Design Comparison | Difference | Std Error | p-Value |
|---|---|---|---|
| Enter 0 versus Filter Question | -1.746 | 0.027 | < 0.0001* |
| Enter 0 versus None Box | -0.776 | 0.027 | < 0.0001* |
| Filter Question versus None Box | -0.969 | 0.027 | < 0.0001* |
The User Experience
To focus on the survey’s ease of use, we measured format misuses, which suggest the design is not intuitive to respondents and could increase overall survey burden. We also measured the number of clicks required to respond, the time to respond, and perceived difficulty. Overall, format misuses were low. Specifically, across all respondents and the four survey questions, there were fewer than 30 total misuses. Of all the misuses, the vast majority were in the None Box design (checking the None box and entering a number or entering “0” in the write-in field). A small minority were in the Filter Question design (selecting Yes to the filter question and entering “0” in the write-in field or writing a non-numeric entry in the write-in field). The only possible format misuse in the Enter 0 design was to type a non-numeric entry in the write-in field, which no respondents did (Figure 7). Format misuse occurrences across the four questions were binarily coded: made one or more, or made none.
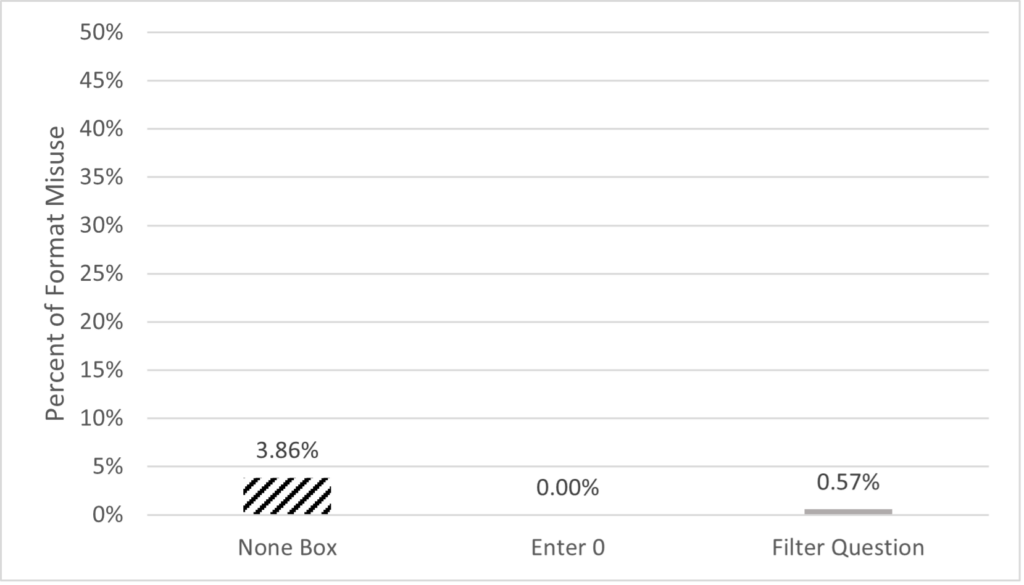
Figure 7. Percent of format misuse by design across the four questions.
When looking at the least square means comparison between the Filter Question and None Box design, the None Box design was found to have significantly more misuses than the Filter Question design (p < 0.01) (Table 4). We could not make any comparisons of the Enter 0 design since there were no format misuses measured.
Table 4. Comparison of Least Squares Means for Format Misuse
| Design Comparison | Difference | Std Error | p-Value |
|---|---|---|---|
| Filter Question versus None Box | -1.993 | 0.027 | < 0.0001* |
We then ran a separate model with the hypothesis that the percentage of format misuses in the Filter Question was equal to zero. Parameter estimates showed the Filter Question design was significantly different from zero (p < .01) (see Appendix 5 for full information on both models). Putting these two analyses together, we see that the Enter 0 design, with no format misuses, performed significantly better than both the None Box and Filter Question designs, and the None Box design performed the worst.
Mouse clicks are another measure of respondent burden, which survey designers often aim to minimize to help respondents move through a web survey more easily. The average number of clicks taken to answer all four questions ranged from just fewer than 5 clicks (about 1 click per question) for the None Box and Enter 0 designs to almost 8 clicks for the Filter Question design (Figure 8).
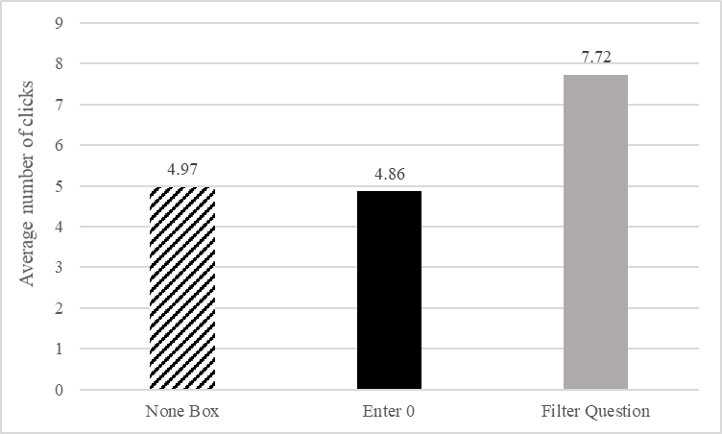
Figure 8. Average number of clicks by design.
The least squares means from the random effects model shows that respondents had significantly more clicks in the Filter Question design than in the other two designs (Table 5) (see Appendix 6 for full model information). This result is intuitive, considering there is an additional question to answer. Although there were more mouse clicks in the Filter Question design overall, when we remove respondents who selected Yes on the filter question, that effect disappeared. In this scenario, respondents only answered one question, like in the other designs. When we focused only on cases in which Yes was selected and both questions were presented, the average number of clicks in the Filter Question design was approximately twice that of the other two designs.
Table 5. Comparison of Least Squares Means Mouse Clicks
| Design Comparison | Difference | Std Error | p-Value |
|---|---|---|---|
| Enter 0 versus Filter Question | -0.458 | 0.044 | < .0001* |
| Enter 0 versus None Box | -0.030 | 0.050 | 0.5456 |
| Filter Question versus None Box | -0.427 | 0.045 | < .0001* |
Although the Filter Question design resulted in significantly more clicks, that does not translate to significantly more time spent on each question (p = 0.9260) (see Appendix 7 for full model information). In fact, Figure 9 shows that the Filter Question design only had the longest response time for the question “How many children are in the household.” Alternatively, the None Box design took longest for three of the four questions, whereas Enter 0 was nominally faster for three of the four questions. Looking at the overall timing for the Filter Question design is an insufficient measure because some respondents answered two questions while others only answered one. When respondents selected No on the filter question, such that they did not see the follow-up question, response times were significantly faster than both the None Box and Enter 0 designs. Alternatively, when respondents had a substantive answer to report and saw both questions in the Filter Question design, response times were significantly higher than both of the other designs. This suggests that the Filter Question design is more efficient when respondents have nothing to report, whereas the Enter 0 and None Box designs are more efficient when respondents do have a quantity to report.
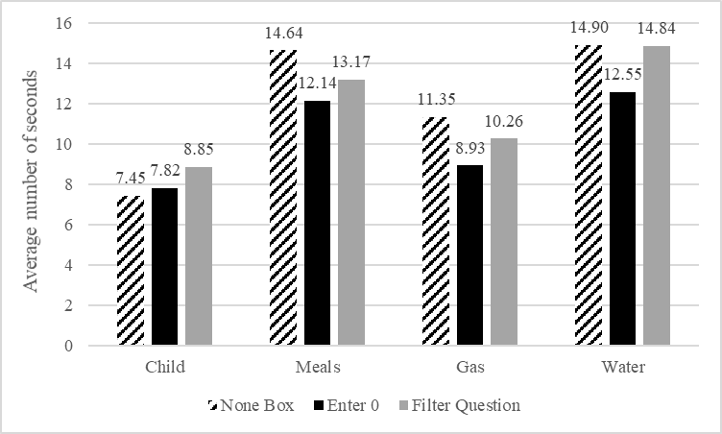
Figure 9. Average number of seconds per question by design for the four survey questions.
Overall, respondents did not have difficulty responding to the survey. Over 90% of respondents reported the survey was either very easy or somewhat easy, and there was no significant difference between perceived difficulty across question design (χ2 = 10.14, p = 0.2551). When we combine very easy and somewhat easy categories, we see slightly fewer respondents in the None Box design; approximately 29% reported that the survey was very or somewhat easy compared to the other two designs at approximately 32%. Conversely, the majority of respondents who did not report that the survey was easy were in the None Box group (Figure 10).
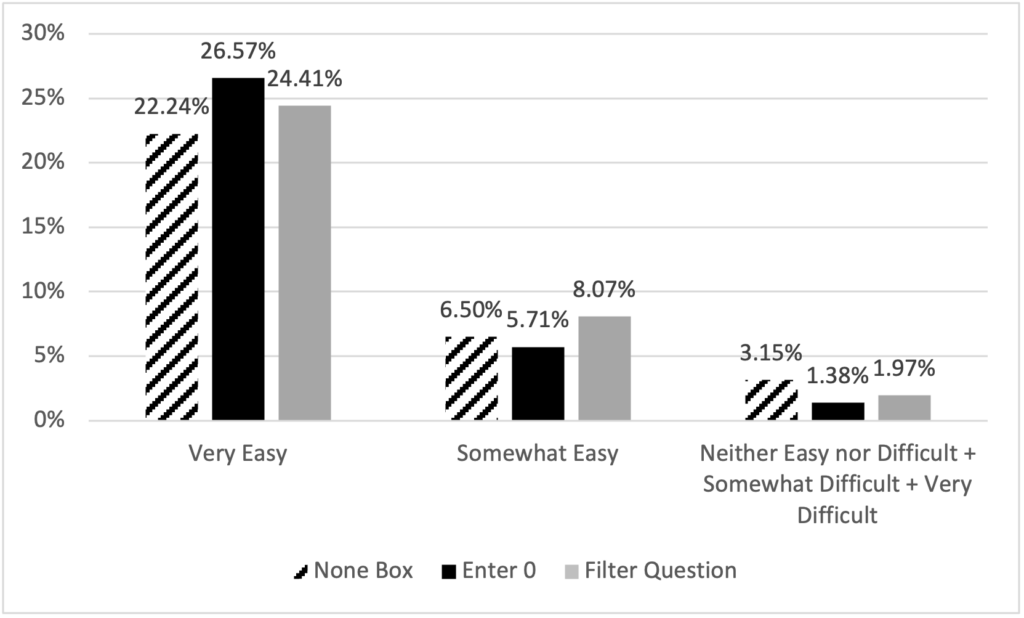
Figure 10. Respondent-reported difficulty by design.
Respondent preference appears to be related to their perceived difficulty; only 22.64% of respondents preferred the None Box design compared to 27.17% and 27.95% who preferred the Enter 0 and Filter Question designs, respectively (χ2 = 11.59, p = 0.0715). Additionally, 22.24% of respondents reported not having a preference. (“No preference” is not displayed in the bar chart.)
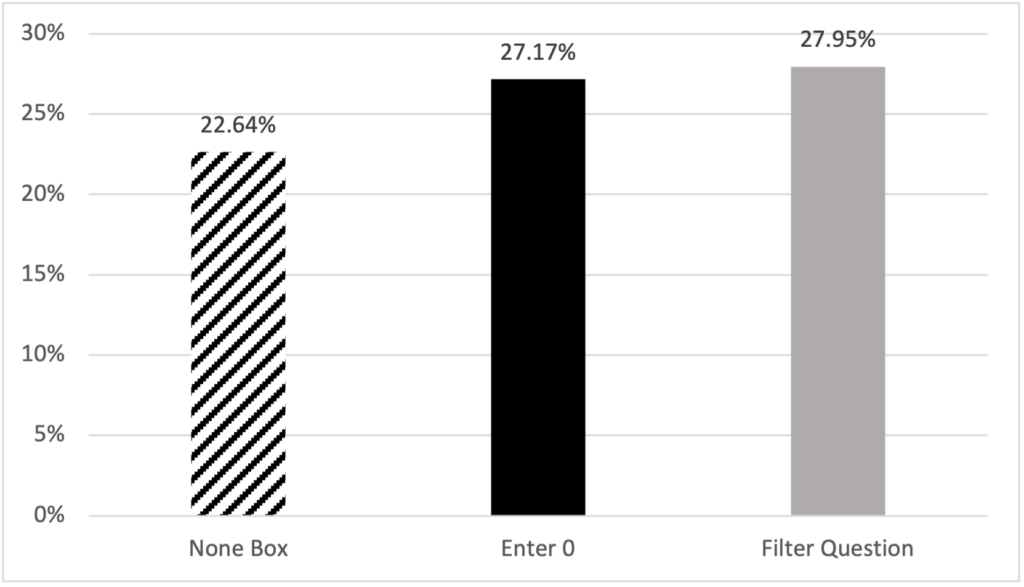
Figure 11. Respondent-reported design preference.
Discussion
Asking respondents to enter “0” in surveys has historically been avoided due to concerns regarding postprocessing of the data. Moore et al. (2016) suggested that a written zero on a paper survey may not be able to be optically scanned and would therefore lead to increased costs and resources as compared to the None box selection. However, these concerns are not relevant for web surveys. Zeros require no more data cleaning than a checked None box, and moreover, the Enter 0 design requires less programming than the None Box design when developing the survey. Other web functions can also be utilized to ensure data quality for open entry fields, such as validation checks to ensure only numeric values can be entered. Therefore, the only reason to use a None box in web surveys is if it yields higher data quality and a better respondent experience compared to other designs.
To evaluate the effectiveness of each design, we investigated their impact on data quality (through distributions of zero responses and item nonresponse) and the user experience (through format misuses, number of clicks, question response time, and perceived difficulty). Overall, this study demonstrates that the design of these questions does impact the data quality and ease of use of a web survey.
In terms of data quality, respondents successfully reported none or zero in all designs without much variation. However, the None Box design resulted in the highest percentage of item nonresponse compared to the other designs. On average, the Enter 0 design had the lowest percentage of item nonresponse across all three designs.
Not only was there more item nonresponse in the None Box design, but respondents also did not interact with it as intended, resulting in more format misuses compared to the other two designs. This suggests that the design was not intuitive, and it was not clear how to report a lack of quantity. This also suggests that the missing data may not be missing at random. While the overall proportion of nothing to report was similar across designs, it is possible that certain types of respondents struggled more with the format and were more likely to skip the question. This could introduce bias into estimates if item nonresponse is not well understood and result in incorrect imputation assumptions (De Leeuw et al., 2003).
In addition to data quality, a goal of survey design is to make surveys as easy for respondents as possible. The main format misuse found was that some respondents both selected the None box and entered a number or “0” into the write-in field. This suggests that not only is the design unintuitive (because respondents are not interacting with it as intended), but it is actually leading respondents to make more effort than is necessary by answering two questions instead of one.
We also found that, although the None Box design did not result in more clicks compared to the Filter Question design, which required answering two questions, the None Box design did have the longest average response time for three of the four survey questions. Also, respondents found the survey to be less easy compared to respondents in the other designs. Additionally, respondents indicated the None Box design was more difficult compared to the Enter 0 and Filter Question designs, although it was non-significant. The None Box design was also less preferred than the other two designs.
Together, these findings are consistent with past research and suggest that the None Box design leads to lower data quality and is not user-friendly. Given the flexibility of web surveys, other designs can alleviate both issues and provide a better user experience while delivering higher quality data.
Limitations and Future Research
Notwithstanding the contributions of this paper, future research could seek to overcome certain limitations that exist. Although this study did include respondents that were regionally diverse across the country, the panel of respondents that opted-in to our study were not sampled from a population, and therefore generalizations of the results are limited. Future research should look to replicate these findings with a randomly selected sample that is representative of the population.
Although web surveys can be completed using either a PC or a mobile device, the current research only tested the designs with respondents using PCs, thus any conclusions for smartphone surveys are constrained. For smartphone survey design, researchers recommend question designs that reduce clutter and are optimized for a smaller, narrow screen (Antoun et al., 2018). The None Box design does not conform to these recommendations in that it requires more screen space than other designs, and the placement of the None box likely cannot be next to the entry field as is recommended for paper surveys (Dillman et al., 2005). Similarly, the Enter 0 design requires a numeric keypad to pop up, which reduces the viewing area on the screen, potentially covering up part of the question. The Filter Question design, on the other hand, can easily be adapted to smaller screens and would likely result in improved data quality and user experience when compared to the other two designs. However, these predictions should be tested with experimentation.
Conclusion
The user interface of a web survey can impact respondent burden and influence how people respond to survey questions (Tourangeau et al., 2013). According to Groves et al. (2011), the job of survey designers is to minimize total survey error, or the sources of error that can occur at each step in the life cycle of survey. Our current research revealed that such error can be found in the way respondents are asked to report zero in web surveys if they have nothing to report. The design of questions that might elicit zero quantities has implications on the survey data and respondents’ experiences. The widely used None Box design appears to be inadequate in minimizing total survey error within web surveys. Our findings align with previous literature that the None Box design is, at best, not functioning as intended and the box is being ignored or, at worst, is causing respondent confusion and negatively impacting data quality.
On the other hand, both the Enter 0 design and the Filter Question design improve the respondent experience and lead to higher quality data for questions in which there is a likelihood that respondents may not have anything to report. The Enter 0 design yielded the lowest item nonresponse, but it still assumes the question applies and the respondent has something to report, which they may not. The Filter Question design is a cleaner option in that the respondent only sees questions that are applicable to them and does not need to imagine how to respond to a question that does not apply. Future research using mobile devices and different samples can help disentangle the benefits and drawbacks of these two designs, but both are shown to provide higher data quality and a better respondent experience compared to the None Box design. As surveys continue to shift from paper to web, researchers must continue to reassess the elements of each question and work to ensure design decisions are evidence-based.
Tips for Usability Practitioners
Implement only question structures that are familiar to users in various survey and questionnaire application settings. Introducing novel or rare question structures may introduce confusion and lower data quality.
Providing multiple methods to answer a survey question (such as checking a box and entering a numeric value like the None box) can be confusing to the user. When possible, respondents should be provided only one method to answer an individual survey question completely.
The None box worked well in paper questionnaires, however with new technologies available in web, entering “0” and using filter questions proved to be more intuitive and user-friendly. As new technologies emerge, the way we currently do things should be regularly reassessed to determine whether there is a better way.
Acknowledgements
The authors would like to thank the following individuals for their valuable input on this study: Elizabeth M. Nichols, Erica Olmsted Hawala, Temika Holland, Sabin Lakhe, Alda Rivas, Joanne Pascale, Stephanie Coffey, and Thomas Mathew.
Disclaimer
This report is released to inform interested parties of research and to encourage discussion of work in progress. Any views expressed are those of the authors and not those of the U.S. Census Bureau. The paper has been reviewed for disclosure avoidance and approved under CBDRB-FY21-CBSM001-003. In general, some of these numbers may not sum up to 100% or the overall total due to rounding.
References
Antoun, C., Katz, J., Argueta, J., & Wang, L. (2018). Design heuristics for effective smartphone questionnaires. Social Science Computer Review, 36(5), 557-574.
Conrad, F. G., Couper, M. P., Tourangeau, R., & Peytchev, A. (2006). Use and non-use of clarification features in web surveys. Journal of Official Statistics, 22(2), 245-269.
Conrad, F. G., Tourangeau, R., Couper, M. P., & Kennedy, C. (2009). Interactive Interventions in Web Surveys Can Increase Respondent Conscientiousness. Annual Meeting of the American Association for Public Opinion Research, Hollywood, FL, USA.
Couper, M. P., & Zhang, C. (2016). Helping respondents provide good answers in web surveys. Surv Res Methods, 10(1), 49-64. [NIH Public Access]
De Leeuw, E. D., Hox, J. J., & Huisman, M. (2003). Prevention and treatment of item nonresponse. Journal of Official Statistics, 19(2), 153-176.
DeRouvray, C., & Couper, M. P. (2002). Designing a strategy for reducing “no opinion” responses in web-based surveys. Social Science Computer Review, 20(1), 3-9.
Dillman, D. A., Gertseva, A., & Mahon-Haft, T. (2005). Achieving usability in establishment surveys through the application of visual design principles. Journal of Official Statistics, 21(2), 183-214.
ESOMAR. (2018). Global market research report 2018: An ESOMAR industry report.
Grondin, C., & Sun, L. (2008, August). 2006 census internet mode effect study. Section on Survey Research Methods, American Statistical Association, Joint Statistical Meeting.
Groves, R. M., Fowler Jr., F. J., Couper, M. P., Lepkowski, J. M., Singer, E., & Tourangeau, R. (2011). Survey methodology (Vol. 561). John Wiley & Sons.
Haraldsen, G., Dale, T., Dalheim, E., & Stromme, H. (2002, August). Mode effects in a mail plus internet designed census. International Conference on Improving Surveys, Copenhagen, Denmark.
Jenkins, C. R. (1992, August). Questionnaire research in the schools and staffing survey: A cognitive approach. American Statistical Association, Joint Statistical Meetings.
Kunz, T., & Fuchs, M. (2019). Dynamic instructions in check-all-that-apply questions. Social Science Computer Review, 37(1), 104-118.
Moore, D., Ott, K., & Gertseva, A. (2016). Developing and evaluating a short form: Results and recommendations from tests of a form designed to reduce questionnaire length. Proceedings of the Fifth International Conference of Establishment Surveys, American Statistical Association. Geneva, Switzerland.
Nichols, E. M., Kephart, K. M., & Malakhoff, L. A. (2018). Implementing branching logic by enabling and disabling questions in the online version of the national sample survey of registered nurses: Results of a usability evaluation. Research and Methodology Directorate, Center for Survey Measurement Study Series (Survey Methodology #2018-13), U.S. Census Bureau.
Pew Research Center. (2021). Internet/broadband fact sheet. Retrieved November 2, 2023, from https://www.pewresearch.org/internet/fact-sheet/internet-broadband/
Peytchev, A., & Crawford, S. (2005). A typology of real-time validations in web-based surveys. Social Science Computer Review, 23(2), 235-249.
Tourangeau, R., Conrad, F. G., & Couper, M. P. (2013). The science of web surveys. Oxford University Press.
U.S. Census Bureau. (2019). American community survey 1-year estimates detailed tables. www.data.census.gov
U.S. Census Bureau (2020). Self-response rates. https://2020census.gov/en/response-rates/self-response.html
Appendix 1. Distribution of Respondent Characteristics by Design
| Characteristics | None Box | Enter 0 | Filter Question |
|---|---|---|---|
| Age | 48.58 | 45.84 | 45.38 |
| % Female | 48.45 | 54.71 | 53.45 |
| % Hispanic | 5.56 | 10.53 | 8.57 |
| % Non-White Only | 26.54 | 28.07 | 32 |
| % High School or Less | 40.12 | 39.18 | 37.14 |
Appendix 2. Preference Question
The design preference question responses presented to respondents.
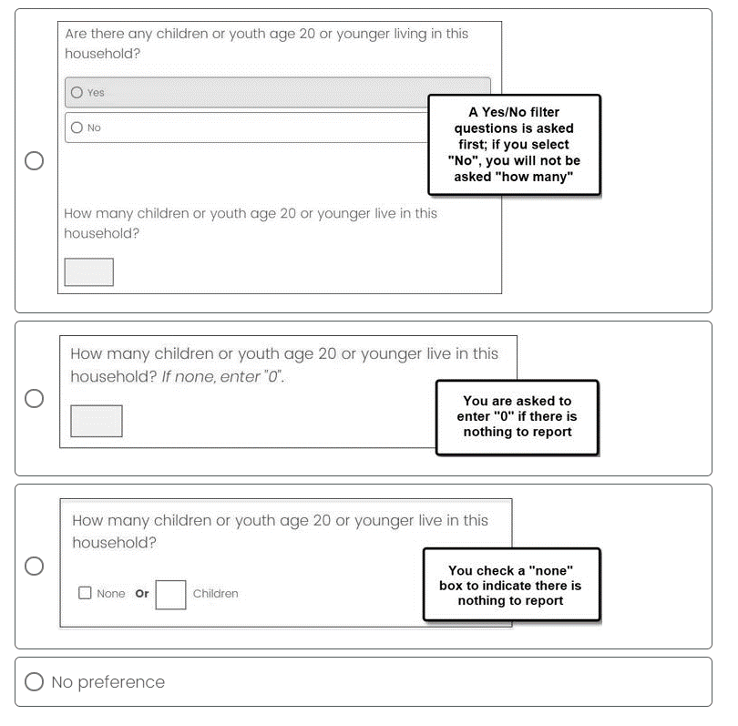
Figure 12: Respondent design preference question.
Appendix 3. Model Information Responding None
| Fit Statistics | |
|---|---|
| -2 Res Log Pseudo-Likelihood | 8693 |
| Generalized Chi-Sq | 1878 |
| Generalize Chi-Sq/DF | 0.93 |
| Effect | Estimate | Std Error | p-Value |
|---|---|---|---|
| Intercept | -1.042 | 0.307 | 0.0008 |
| Enter 0 (Ref = None Box) | 0.201 | 0.131 | 0.1231 |
| Filter Q (Ref = None Box) | 0.174 | 0.129 | 0.1785 |
| Hispanic Origin (Ref = Hispanic) | 0.141 | 0.217 | 0.5157 |
| Sex (Ref = Female) | -0.079 | 0.106 | 0.4567 |
| Race (Ref = White Only) | 0.191 | 0.140 | 0.1734 |
| Education (Ref = Less Than HS) | -0.526 | 0.108 | < 0.0001 |
| Age | 0.017 | 0.003 | < 0.0001 |
Appendix 4. Model Information Item Nonresponse
| Effect | Estimate | Std Error | p-Value |
|---|---|---|---|
| Intercept | -3.615 | 0.028 | < 0.0001 |
| Enter 0 (Ref = None Box) | -1.746 | 0.025 | < 0.0001 |
| Filter Q (Ref = None Box) | -0.776 | 0.021 | < 0.0001 |
| Sex (Ref = Female) | -0.436 | 0.018 | < 0.0001 |
| Race (Ref = White Only) | -0.467 | 0.021 | < 0.0001 |
| Education (Ref = Less Than High School) | 0.476 | 0.020 | < 0.0001 |
| Age | -0.011 | 0.001 | < 0.0001 |
Appendix 5. Model Information Format Misuse
Model with None Box and Filter Question Designs
| Effect | Estimate | Std Error | p-Value |
|---|---|---|---|
| Intercept | -1.998 | 0.029 | < 0.0001 |
| Filter Q (Ref = None Box) | -1.993 | 0.025 | < 0.0001 |
| Race (Ref = White Only) | -0.595 | 0.020 | < 0.0001 |
| Education (Ref = Less Than High School) | -0.383 | 0.018 | < 0.0001 |
| Age | -0.030 | 0.001 | < 0.0001 |
Model with Filter Question Designs
| Effect | Estimate | Std Error | p-Value |
|---|---|---|---|
| Intercept | -5.264 | 0.023 | < 0.0001 |
| Race (Ref = White Only) | 0.212 | 0.028 | < 0.0001 |
| Education (Ref = Less Than High School) | -0.080 | 0.034 | 0.0189 |
| Age | -0.008 | 0.001 | < 0.0001 |
Appendix 6. Model Information Clicks
| Fit Statistics | |
|---|---|
| -2 Res Log Pseudo-Likelihood | 8368 |
| Generalized Chi-Sq | 1372.2 |
| Generalize Chi-Sq/DF | 0.68 |
| Effect | Estimate | Std Error | p-Value |
|---|---|---|---|
| Intercept | 0.113 | 0.226 | 0.6176 |
| Enter 0 (Ref = Filter Question) | -1.535 | 0.124 | < 0.0001 |
| None Box (Ref = Filter Question) | -1.336 | 0.119 | < 0.0001 |
| Hispanic Origin (Ref = Hisp) | -0.068 | 0.063 | 0.6781 |
| Sex (Ref = Female) | 0.080 | 0.086 | 0.3548 |
| Race (Ref = White Only) | -0.134 | 0.110 | 0.2198 |
| Education (Ref = Less Than HS) | 0.232 | 0.092 | 0.0113 |
| Age | -0.019 | 0.003 | < 0.0001 |
Appendix 7. Model Information Timing
| Fit Statistics | |
|---|---|
| -2 Res Log Pseudo-Likelihood | 4253 |
| Generalized Chi-Sq | 791.2 |
| Generalize Chi-Sq/DF | 0.39 |
| Effect | Estimate | Std Error | p-Value |
|---|---|---|---|
| Intercept | 2.123 | 0.118 | < 0.0001 |
| Enter 0 (Ref = None Box) | 0.013 | 0.050 | 0.8031 |
| Filter Q (Ref = None Box) | 0.019 | 0.050 | 0.6978 |
| Hispanic Origin (Ref = Hispanic) | 0.004 | 0.083 | 0.9634 |
| Sex (Ref = Female) | -0.001 | 0.041 | 0.9889 |
| Race (Ref = White Only) | -0.081 | 0.054 | 0.1317 |
| Education (Ref = Less Than High School) | -0.022 | 0.042 | 0.5915 |
| Age | 0.001 | 0.001 | 0.2798 |