
[:en]
Abstract
Personas can be an effective means of communicating and synthesizing design ethnographic field data by helping designers maintain focus on users and make sense of complex needs. Personas have however been criticized on scientific grounding and methodological weakness in their creation. Furthermore, few detailed examples of their creation have been published. It is also evident from the literature that there is a methodological gap in creating personas from ethnographic studies.
Using a grounded theory approach, this paper offers a systematic and detailed process of creating personas post fieldwork and compares the approach against best practice. Through a case study of design ethnography in product development for people over 65, we reflect on and describe the process in three phases: 1. Post Fieldwork Data Management, 2. Coding and Grounded Theory, and 3. Data Reduction and Data Display, which leads to the final design of the persona. We conclude that using qualitative and grounded theory approaches can assist to strengthen the process of creating personas; however, the time to create and manage the personas increases.
Keywords
Design, personas, grounded theory, ethnography, design ethnography, design research, fieldwork, product design, older adults, qualitative
Introduction
Design ethnography has been heralded for its ability to uncover depth of knowledge into the unmet needs of users. However, analyzing and communicating the large quantities of data produced from fieldwork into a “design language” can be a complex task. Personas are commonly used to do this; however, they have been criticized on scientific grounding and methodological weakness. In reviewing processes of creating personas, it is apparent that there is a lack of detailed knowledge of how they are created, and in many cases, an ad hoc process is encouraged. It is evident from the literature that there is a methodological gap in creating personas from ethnographic studies.
In this paper, we intend to help strengthen methods for creating personas. We describe a case study of using a grounded theory approach to create personas from a design ethnographic study, and we offer methods and frameworks for their creation. Finally, we compare the approach against best practice processes and reflect on the advantages and disadvantages of using a grounded theory approach.
Firstly, we discuss the advantages of using personas within design ethnographies and outline methodological shortcomings in their creation.
Why Design and Ethnography
The marriage between design and ethnography has evolved greatly throughout the 20th century through studies in material culture, consumerism, and the anthropological study of object in culture. In the early 20th century, ethnographers strove to understand the role of artefact in socio-culture and what it reflected about culture, gender, race, and beliefs. The role of the ethnographer changed when introduced into industry in the 1980s to address matters of design in technology (Blomberg et al., 2003).
Ethnographic approaches are intended to be used in natural settings to deeply understand users and are said to offer a more holistic and descriptive approach over traditional design approaches (such as focus groups and questionnaires; Blomberg et al., 2003; Blomberg et al., 2017). R. J. Anderson suggested that ethnographic methods provide designers with a more reflective and holistic approach to problem solving (1994) and, according to Plowman, can investigate future complex issues for humanity creating powerful, democratizing, and radical effects (2003).
For business and economic reasons, design ethnography is considered an increasingly attractive research option. Salvador et al. asserted that design ethnographers are “…designing technology that consumers want and need” (1999, p. 37). A study by Cooper and Edgett strengthened this statement, ranking ethnography as the strongest method to foster innovation in new product research and development. This study compared proven methods such as focus groups, lead user analysis, and brainstorming and showed that it had the greatest depth of knowledge into users unmet and unarticulated needs (2008).
Personas and Design Ethnographic Fieldwork Analysis
After ethnographic fieldwork is completed, analyzing and communicating large quantities of qualitative data for design purposes can be difficult. Data has to be displayed in a concise, visual, and reliable means, one that is closely representative of consumer groups. Blomberg et al. suggested the creation of profiles using “personas” to represent and communicate ethnographic data (2003). Personas have been successfully used by many companies conducting ethnographic research; recent examples include work by Spotify Music (Torres de Souza et al., 2019). Personas are representative “characters” of end-users that were first introduced by Alan Cooper as a design tool in computer software development. According to Cooper, “Personas are not real people, but they represent them throughout the design process” (1997, p. 124). In past ethnographic studies, these were also known as “composite characters” (Scheper-Hughes, 1979, p. 19), which were usually a representation of a population made up of multiple characters.
Personas can communicate ethnographic data for design purposes and satisfy the functions required in qualitative data analysis in many ways:
- Maintaining focus: To create theory from qualitative data, it is important to reduce the data into actionable insights. For this, maintaining focus on the actual insights rather than digressing off topic is important. Goodman et al. suggested that personas help a designer to focus attention directly on end-users and thus creates empathy with them (2006). Furthermore, Adlin and Pruitt stated that personas engage design teams by maintaining a meaningful and deep focus on the important users in a project (2010).
- Making sense of complexity: Personas can communicate complex cultural archetypes with deep idiosyncrasies in a succinct manner. By doing this, they can help build consensus and commitment in design teams (Cooper et al., 2012).
- Generating more original ideas: So and Joo concluded that personas significantly improve the originality of design ideas and have a positive effect on brainstorming (2017).
- Supporting confidentiality: Creating fictional personas from the data conceals actual individual identities (Pruitt & Adlin, 2006).
- Improving validity and reliability: It is important for validity and reliability in analysis to share finding and gain other interpretations and points of view from the data. Using personas in this regard can focus other viewers to understand and interpret needs (White, 2012).
Methodological Weakness
Advantages aside, personas often fail (Salazar, 2018) and have been criticized on scientific grounding and methodological weakness in creation. Chapman and Milham stated that there are difficulties in verifying if personas are accurate and asked for methods to create personas to be more thoroughly researched (2006). The methods and process in which personas are created were also criticized by De Voil, stating that Cooper was adamant that persona[s] must be defined in great and specific detail; however, clear-cut examples of the level of detail were not offered (2010). A point acknowledged by Copper himself stating that a “how-to” on personas has not been written (Cooper, 2008). A literature review by Nielsen and Storgaard Hansen found that a challenge in the persona method was the lack of guidance of use adding that “…few have conducted literature studies to identify and discuss the different understandings of the method. Fewer still have reported on ethnographic studies of practice” (2014, p. 1665).
Looking at best practice in generating personas, Adlin and Pruitt (2010) offered a 6-step process in creating personas and Cooper et al. (2012) offered a 7-step guide. Table 1. compares these stages of creating personas and places them into early, middle, and late phases of development.
Table 1. Best Practice Stages of Creating Personas Compared in Early, Middle, and Late Phases of Development
|
|
Cooper et al. (2012) 7 Steps in Constructing Personas |
Adlin and Pruitt (2010) 6 Stages of Persona Development |
|
Early |
Step 1: Identify behavioral variables. |
Stage 1. Finding data sources |
|
Middle |
Step 2: Map interview subjects to behavioral variables. |
Stage 2. Creating “factoids” from data |
|
Step 3: Identify significant behavior patterns. |
Stage 3. Affinity diagramming of factoids |
|
|
Late |
Step 4: Synthesize characteristics and relevant goals. |
Stage 4. Creating persona skeletons |
|
Step 5: Check for completeness and redundancy. |
Stage 5. Prioritizing persona skeletons |
|
|
Step 6: Expand the description of attributes and behaviors. |
Stage 6. Creating the persona foundation documents |
|
|
Step 7: Designate persona types. |
Comparing both these stages, it shows that during the early stage of creating personas the researcher goes about finding data sources and broadly understands the behavioral variables in the data. During the middle stage of development, understanding behavior patterns of personas are achieved by making notes from the data. Finally, at the late stage of development, profile categories and characteristics emerge and persona profiles are refined.
These processes offer an understanding of the persona process; however, an ad hoc approach to creation is still required and encouraged in both cases. It is evident from the literature that there is a methodological gap in creating personas from ethnographic studies. This is where qualitative and grounded theory approaches can assist. Research by Faily and Flechais (2011) found that using grounded theory approaches can assist in making personas more valid; additionally, that data analysis associated with creating personas is analogous to the qualitative data analysis and grounded theory.
Aim and Objectives
The aim of this paper is to help strengthen methods in creating personas by offering designers and researchers a case study from ethnographic fieldwork. The following are the objectives:
- Offer methods and frameworks in which designers can create personas from a design ethnographic study.
- Describe how a designer could use a grounded theory approach in developing personas.
- Compare the approach against best practice examples to understand the advantages and disadvantages of the approach.
Therefore, this paper seeks to answer the question: Can using qualitative and grounded theory approaches assist to strengthen the process of creating personas?
Overview of Case Study Methods and Phases
The case study is based on an ethnographic study of cooking and heating products needs for people over the age of 65. For an ageing population, these products assume important health and wellbeing roles within the home. They fulfill fundamental needs by providing a means of heat and preparation of food. Designers can create positive independent living experiences by redesigning features to meet the evolving requirements for older people (Marston et al., 2020; Vrkljan et al., 2019; White et al., 2020). In this case study, researchers conducted design ethnographic fieldwork to understand requirements to consider for future domestic cooking and heating products. Forty older adults participated in this study over a 12-month period (January to December).
The researchers purposefully selected the participant sample from urban and rural locations throughout the Republic of Ireland, ensuring diversity from differing socio-economic backgrounds. This sample consisted of 15 males and 15 females who were single participants, and five male/female married or cohabitating couples. Each participant was over the age of 65 years and of varying health status. Data collection methodologies were conducted through ethnographic interviewing, observation, and participatory techniques. These were collected through audio recording, photography, and sketch field notes.
After ethnographic fieldwork is completed, data is typically analyzed through a grounded approach in several stages. These range from data management, coding, and finally to data reduction and display (Miles & Huberman, 1994). Little research has been conducted on how personas can be created through these systematic stages.
By reflecting on and describing the process, this case study focuses on post ethnographic fieldwork methods in three phases:
- Post Fieldwork Data Management: The is the first phase that contains post fieldwork of documentation and data management through screening, editing, and creating fieldwork documents.
- Coding and Grounded Theory: This second phase is about “sensemaking” through coding processes.
- Data Reduction, Data Display, and Design of Personas: This final phase is for data synthesis and designing the process of representing personas for design use.
Figure 1 illustrates the overall process of creating personas in this case study, from data analysis of interviews to personas.
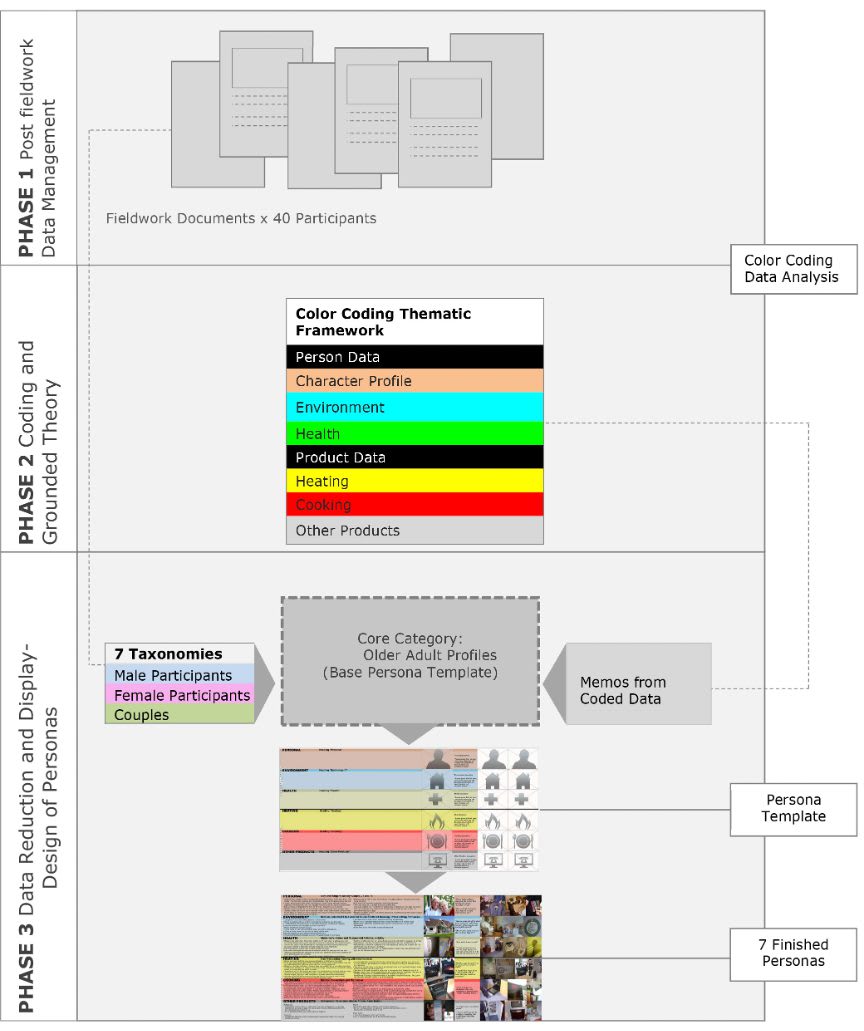
Figure 1. Overview of process in creating personas in the case study.
Results and Reflection of the 3 Phases
The following sections describe the process of each phase of this case study.
Phase 1: Post Fieldwork Data Management
Managing and organizing physical fieldwork data was the first step in data management. Physical fieldwork data consisted of MP3 audio recordings, photographs, and sketches. The greater amount of data consisted of digital photographs and audio material. In total, this accumulated to over one thousand digital photographs and approximately 80 hours of audio. Due to the quantity of this collected data and the breadth of its content, a process of attaining primary understanding was required. Details of each stage are outlined below, from screening and editing audio and photographs to creating fieldwork documents. This process typically occurred within 48 hours of an interview to ensure all data had been captured while fresh to the researcher.
Stage 1. Screening and Editing of Audio
When consent was given to do so, on-site recording of field interviews occurred via a digital recording application. Editing of audio occurred off-site, firstly by listening to the individual interview in its entirety and deleting any large non-essential voids, for example, silence during the interview. These edited recordings were then replayed and transcribed verbatim into an individual Microsoft Word document per participant. The process of replaying, listening, and transcribing notes was a recursive and iterative one, replaying and listening to the audio multiple times while understanding the context and meaning of the dialogue.
Stage 2. Screening and Editing of Photographs
Digital photographs were taken in the field to document observations. The overall approach to photography was primarily to attain quantity rather than quality of images with the intent of editing this stock post fieldwork. Photographic observations were divided into categories: (a) observations of direct interest to the study and (b) observations of possible relevance to the study. All photographic data was firstly filed and edited based on the quality of images and image replication. The screening and editing process was similar to that of the audio data whereby photographs were viewed multiple times in detail and edited on the relevance to the study. This process included scanning the foreground and background of images for what was considered relevant information, either specific to a participant or of a reoccurring trend in the fieldwork. Concise notes were taken of images to document (a) why the photograph was taken, (b) its perceived relevance, and (c) any broad theories attached to the image.
Stage 3. Fieldwork Documents
The documentation and writing of the fieldwork were the first step in making sense of occurrences in the field. This was achieved by organizing and placing data into order to ascertain sense and meaning and to document a true and fluid account of proceedings. Synchronizing both the audio and photographic data into manageable and meaningful order relevant to the interview was the most efficient and evident means of doing this.
Emerson et al. stated that in writing up ethnographic fieldwork researchers should describe the social world and its people by characterizing dialogue from the field (1995). In writing field documents, the first action was to characterize the participants. A profile of the participant and the environment in which they lived was constructed. Descriptions of “who they were” were included, for example, demographic details, daily routines, and all details that gave a descriptive construct of the participant. Following this, a transcription of the interview and dialogue from the field was accounted for. This transcription of dialogue was a construct of both the participant’s actions and narrative and the researcher’s views and interpretations of occurrences. Once the first draft of these documents was produced, they were printed and read line by line. Brief handwritten annotations and mental notes were documented as “description codes” (Saldaña, 2009, p. 3). An example of this process is shown in Figure 2.
To put further physical order to field documents, transcripts and text were placed in order relevant to the sequence of the interview. Relevant photographic data was then positioned in sequence within this transcript. This resulted in concise and visual documentation of all fieldwork data.
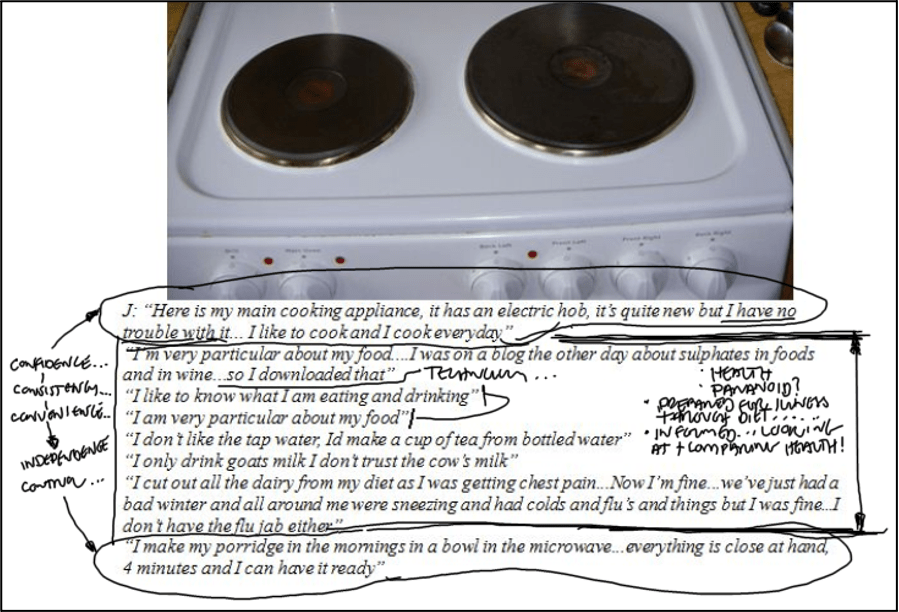
Figure 2. The act of transcription showing rough work descriptive codes in progress.
Phase 2: Coding and Grounded Theory
In its most simplistic form, qualitative data analysis is described as a process of collecting things, noticing things, and thinking about things (Seidel, 1998). Broadly speaking, in qualitative analysis, the researcher endeavors to seek out reoccurring themes to form valid theory from field data. In ethnographic analysis, researchers look for patterns of thought and behavior with patterns being a form of reliability (Fetterman, 1989).
To rigorously analyze and to develop true patterns and theories from the fieldwork, a structured approach was used in the interpretation of all fieldwork documents. Charmaz and Mitchell recommended a grounded theory approach to ethnographic analysis, stating that this “can sharpen the analytic edge and theoretical sophistication” of the research (2001, p. 161). Here they argue that grounded theory offers the required analytical structure while remaining true and open to developing humanistic narrative and theory. Grounded theory uses analytical processes to review data into patterns, categories, and themes. A fundamental process in grounded theory is a process called “coding” described by Corbin and Strauss as “deriving and developing concepts from data” (2008, p. 65).
In the process of coding, the researcher reads, understands, and identifies important phenomena within the collected data, and then goes about attaching codes to phenomena with the view to making sense of the data. Miles and Huberman defined codes as “tags or labels for assigning units of meaning to the descriptive or inferential information compiled during the study” (1994, p. 56).
Manual Open Coding Process
Open coding is the first step in analysis, in which the researcher creates initial categories of the phenomenon within the collected data (Robson, 2002). Open coding, according to Corbin and Strauss, is “breaking data apart and delineating concepts to stand for blocks of raw data” (2008, p. 165). The act of open coding data in this research evolved following the transcription and documentation of approximately eight interviews. In an attempt to maintain coherence and order to fieldwork documents, data was positioned in meaningful “chunks” within a semi-structured fashion on each document. This structure was iteratively revised as each interview progressed, with the researcher developing a more refined means of eliciting information and through building developing theories. Through this organization of data, “descriptive codes” as previously mentioned were edited according to these emerging theories. Final field documents were ordered into the following chunks:
- the character profile of the participant
- details of their environment
- specifics on cooking and heating products
- all other transcription
Following this organization of field documents, a process of manual open coding ensued. Manual coding was chosen as the most rigorous method to code the collected data. Computer-assisted qualitative data analysis software (CAQDAS) such as NVivo were considered at this time; however, a manual open coding approach was chosen to enhance the researcher’s control of the analysis process. Research by Zamawe stated that “…unlike statistical software, the main function of CAQDAS is not to analyze data but rather to aid the analysis process, which the researcher must always remain in control of” (2015). Albeit a slower process, manually reading and scanning data allowed for control and understanding as themes emerged.
Color Coding and the Color-Coding Thematic Framework
To commence manual-open coding, text within each document was carefully read and re-read line by line, with each image interpreted for further meaning. In the process of doing so, text and images were repositioned accordingly, and handwritten notes were fully transcribed. Coding in detail commenced in this process of reading and interpretation, with emerging categories and subcategories assigned.
Saldaña recommended that designers code qualitative data in a format that has instant visual impact (2009). A color-coding strategy was developed as the most appropriate method. Its principal virtue being the clear visualization and illustration it provides for the design ethnographer. Color codes were commenced firstly to distinguish between emerging categories and themes and the relationships between. When progressed through several documents, it offered a highly visual representation and an at-a-glance appraisal of emerging themes.
The researchers used the highlighter pen and the color pallet from Microsoft Word to facilitate the color code process (Figure 3). To ensure reliability in the coding process, Bengtsson recommended that coding should happen repeatedly and that researchers should “…use a coding list, including explanations of the codes, to minimize a cognitive change during the process of analysis” (2016, p. 12). For this, a color-coding thematic framework was simultaneously created in a separate Excel sheet to record colors and themes emerging.
For interrater reliability in the process of creating coding schemes, Belotto recommended “reliability checks” by triangulating and reviewing with independent researchers (2018). This was achieved by conducting peer-review sessions with three independent senior academics experienced in the area of qualitative analysis. The review sessions focused on the suitability and reliability of the color-coding process and the rigor of the process.
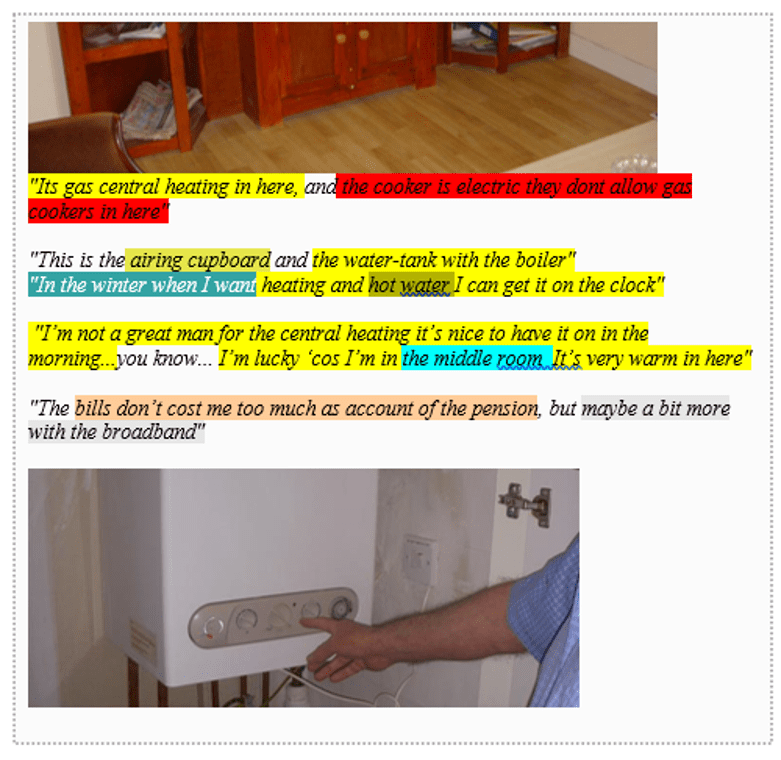
Figure 3. An example section of color-coded transcript.
The final revision of the color-coding thematic framework (see Table 2 and Table 3) consisted of three columns. The tables consist of two “central or core categories” (Corbin & Strauss, 2008, p. 104) that were “Person data” and “Product data.” Each table contained three subcategories:
- Table 2: Person data table has the following data subcategories: Character profile, Environment, and Health.
- Table 3: Product data table has the following data subcategories: Cooking product, Heating product, and Other product (White, 2012; 2013a; 2013b; 2018 White & Devitt, 2011).
Table 2. The Color-Coding Thematic Framework of the Core Category: Person Data (see PDF to view colors used)
|
Highlighted Color Legend |
Sub-Categories |
Description |
|
Color Title |
1.1 Character Profile |
|
|
Orange 1 |
1.1.1 Personal |
Age, general demographic, family, friends, stakeholders / work / profession |
|
Orange 2 |
1.1.2 Religion |
Spirituality, thoughts on religion, death, religious possessions, relics |
|
Orange 3 |
1.1.3 Pass-times |
Hobbies, daily recreation, music, etc. |
|
Orange 4 |
1.1.4 Money |
Wealth, financial status |
|
Orange 5 |
1.1.5 Pension |
Pension money |
|
Orange 6 |
1.1.6 Pets |
Domestic pets, animals (stories of) |
|
Brown 1 |
1.1.7 Independence |
Statements of independence, importance of independent status |
|
Brown 2 |
1.1.8 Socializing |
Socializing, getting out and about |
|
Brown 3 |
1.1.9 Loneliness / isolation |
Loneliness / isolation |
|
Brown 4 |
1.1.10 Holidays |
Why, where, when, how |
|
Brown 5 |
1.1.11 Public transport |
Why, where, when, how |
|
Brown 6 |
1.1.12 Private transport |
Why, where, when, how |
|
|
1.2 Environment |
|
|
Cyan 1 |
1.2.1 Environment-home |
House / home / extended living environment |
|
Cyan 2 |
1.2.2 Weather/ seasons |
Weather |
|
Cyan 3 |
1.2.3 Safety in environment |
Safety |
|
Cyan 4 |
1.2.4 Possessions |
Material possessions, ornaments (meanings of) |
|
Cyan 5 |
1.2.5 Lighting |
Lighting in context, locations, usage |
|
Cyan 6 |
1.2.6 Household chores |
Domestic chores, washing up, cleaning, etc. |
|
Cyan 7 |
1.2.7 Ergonomics |
Posture, reach / dexterity issues |
|
|
1.3 Health |
|
|
Green 1 |
1.3.1 Injury |
When, where the injury happened, falls, burns, operations, hospitals |
|
Green 2 |
1.3.2 Good health / illness / medical conditions |
Type of illness, medication usage |
|
Green 3 |
1.3.3 Forgetfulness / cognitive functioning / memory |
Any mention of memory / loss dementia |
|
Green 4 |
1.3.4 Orthopedic issues |
Hips, knees, breaks, surgery |
|
Green 5 |
1.3.5 Sleeping habits |
Sleeping habits |
|
Green 6 |
1.3.6 Cigarettes / alcohol |
When, where, why |
|
Green 7 |
1.3.7 Physical abilities |
Mobility issues, mobility aids |
Table 3. The Color-Coding Thematic Framework of the Core Category: Product Data see PDF to view colors used)
|
Highlighted Color Legend |
Sub-Categories |
Description |
|
Color Title |
2.1 Heating |
|
|
Yellow 1 |
2.1.1 Heating products |
Stoves, radiators, blow heaters, timers, open fires, etc. |
|
Yellow 2 |
2.1.2 Water / shower / bath |
Showers, baths, means of heating water, hygiene |
|
Yellow 3 |
2.1.3 Clothes drying |
Dryers, clothes lines, means of drying |
|
Yellow 4 |
2.1.4 Fuel heating cost |
Types of fuels, uses and opinions, bills and payments |
|
|
2.2 Cooking and Food |
|
|
Red 1 |
2.2.1 Cooking products |
Cookers, microwaves, stoves, pots, pans, utensils |
|
Red 2 |
2.2.2 Food / drink / meals |
Breakfast, dinner, lunch, tea supper, eating habits |
|
Red 3 |
2.2.3 Cooking / baking / grilling / frying |
Any means of cooking—why, when, and how |
|
Red 4 |
2.2.4 Eating out |
Dining outside of the home—why, what, how, and with whom |
|
Red 5 |
2.2.5 Shopping / cooking / food cost |
Shopping habits—where, how, why, costs |
|
Red 6 |
2.2.6 Meals on Wheels, food centers |
Meals on Wheels, opinions, etc. |
|
|
2.3 Other Products |
|
|
Gray 1 |
2.3.1 Television / radio |
Television/radio usage—what is watched, when, where, why, how often, etc. |
|
Gray 2 |
2.3.2 PC / internet |
Internet usage—when, why, where, how often, opinions |
|
Gray3 |
2.3.3 Phone |
Phone usage—when, where, how often, house / mobile |
|
Gray4 |
2.3.4 Refrigerator / freezer |
Fridge usage—when, where, how often, what is stored |
|
Gray5 |
2.3.5 Other products / gadgets |
Other appliances / products / gadgets |
Phase 3. Data Reduction, Data Display, Design of Personas
Once the researchers finalized open coding, all the fieldwork data was fully organized into manageable categories. However categorized, the data set remained large in volume, and a means of creating personas was very difficult. To continue with the analysis and creation of personas, a process of data reduction was required.
However, data reduction held difficulties for the researcher at this point. The main difficulty was with reducing data while retaining the many essential and nuanced insights within the categories. It was felt that reducing data would lead to losing real, subjective human insights, where one would prefer (albeit unrealistically) to retain all insights collected. Objectively though, a form of data reduction was essential before progressing with the design of the personas. To continue reducing data, an iterative process was required to address the concerns outlined; to do so, the following steps were implemented.
Creating a Base Persona Template: Deciding on a Core Category
Reducing data brought to light critical questions in creating personas: What data is core and essential to the research? Which overarching categories should not be reduced or reduced the least? In answering these questions, the obvious core category of “people” particularly “older people” emerged, with the conclusion not to compromise their value in the research. To achieve this, it was important to protect the essential older person “profile” when reducing data, maintaining the human essence and not to dilute or to cut any essential elements of their culture when doing so. Therefore, here, the process of selective coding was appropriate to be used.
Selective coding is selecting the central category within the data and relating all other categories to it (Silverman, 2006). According to Charmaz and Mitchell, selective coding “…not only serves to synthesize large amounts of data but also to organize earlier codes into a coherent framework” (2001, p. 167). Within this method, one may adopt a solution whereby data reduction occurs while maintaining the human-centric approach of the research.
The researcher decided on the core category of “older people profiles” requiring a means of placing and reducing the previously open coded categories into this core category (Figure 4). This acted as a means to create a base persona template. The following steps of Creating Memos of the Coded Data and Creating Taxonomies were used to bring the personas to the next stage.
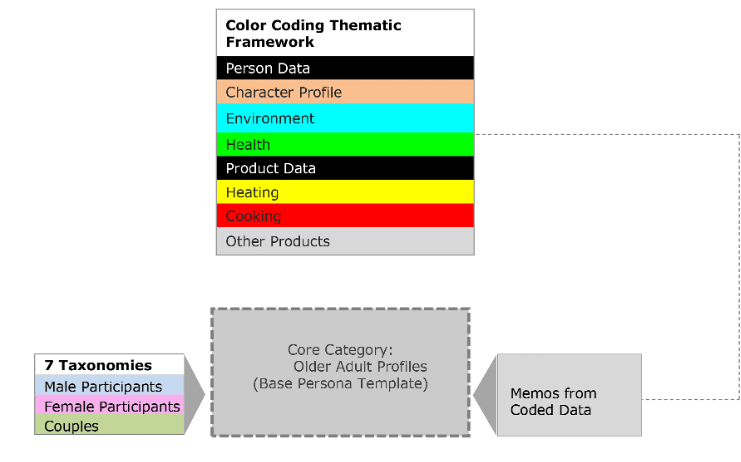
Figure 4. Proposed means of data reduction through selective coding.
Creating Memos of the Coded Data
To create the core category of older adult profiles, a separate method was required to further reduce coded data in the color coding thematic framework. Fieldwork data was condensed into the “main personal insights” from each participant. These insights were documented by using bullet-pointed short memos on separate Word documents. This consisted of extracting a list of
- core personal insights per participant and
- core issues a participant had in daily life.
This list also included phenomena and/or causal conditions where appropriate. For the purposes of reduction and concision, each participant memo list was restricted to a one bullet-pointed sheet no more than 400 words per sheet.
Creating Taxonomies
Reducing the data into profiles representative of the participant sample required an appropriate means of categorizing them into certain classifications. McCurdy et al. used taxonomies of people in society to gain meaning of a culture (2005). In developing a core category, grouping all the participants into similar taxonomies facilitates in both data reduction and in portraying a rich description of the culture. The development of taxonomies in this instance was a further coding exercise, one which classified participants into cultural archetypes.
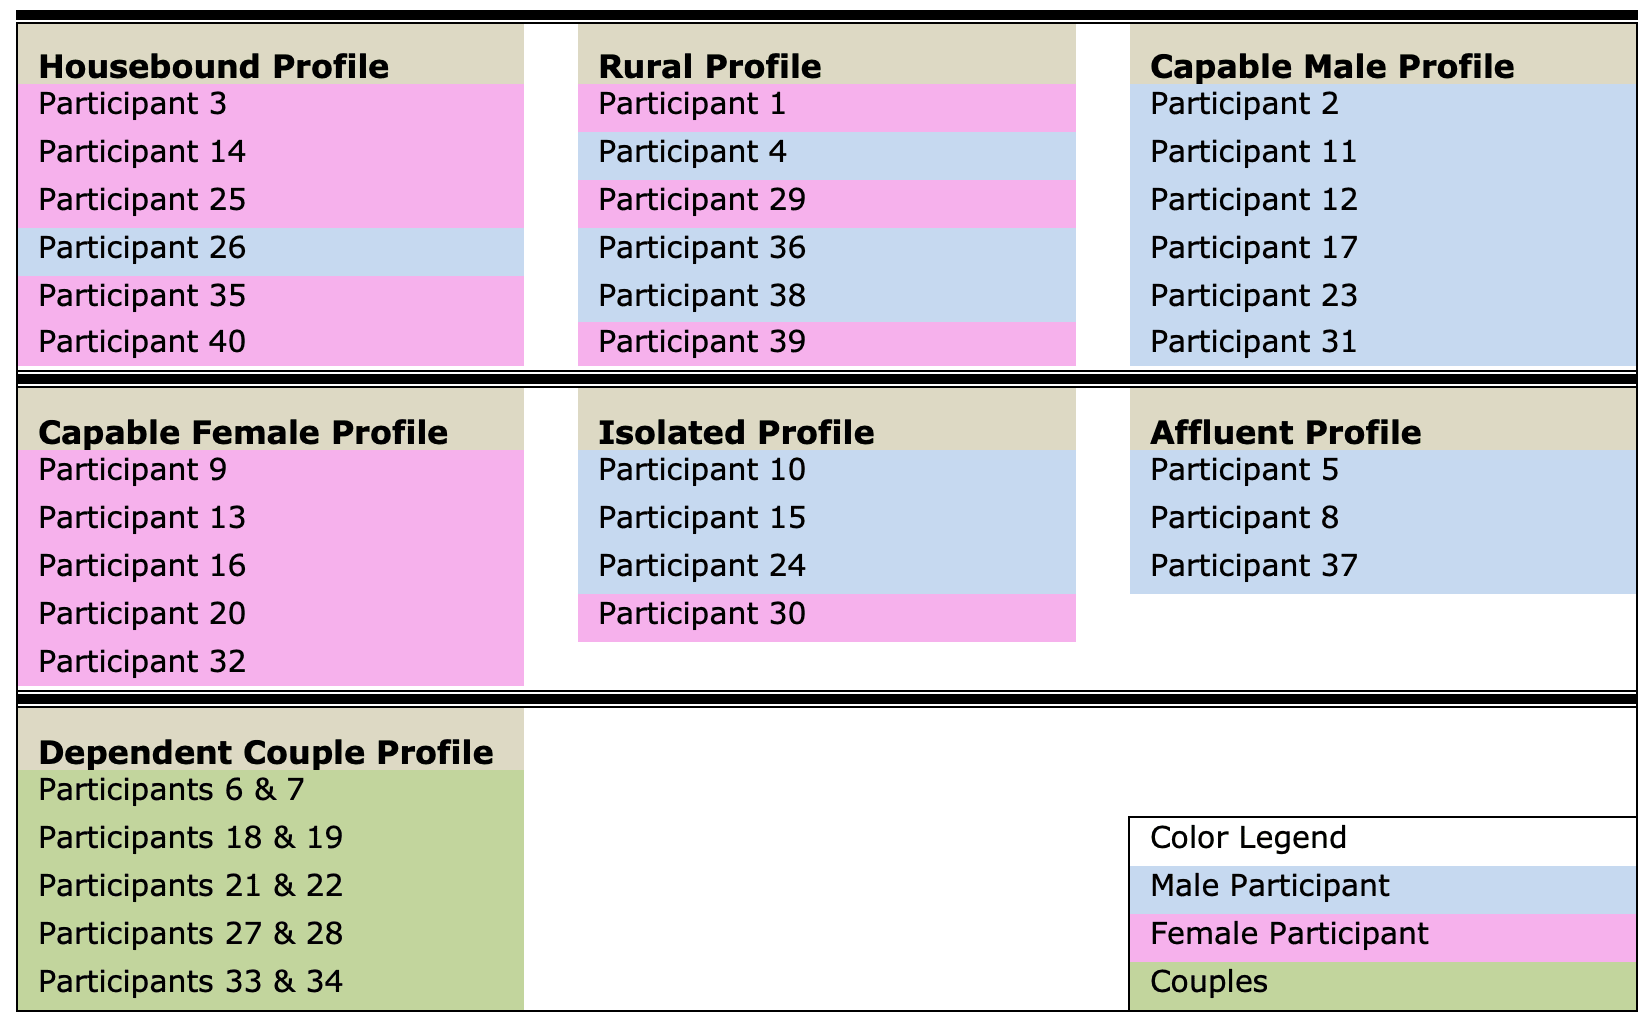
To create taxonomies, the created memo lists were firstly collated and categorized into broad category files; firstly split into three categories: i. Male, ii. Female, and iii. Couples. The researcher proceeded in building taxonomies within these groups, seeking to uncover main archetypal profiles. Participant memos were compared and contrasted to identify similar character traits with participants, and these were grouped accordingly. Seven main taxonomies with similar character traits emerged; seven archetypal profiles representative and reduced from the 40 participants interviewed. These were then categorized into the following taxonomies:
- Taxonomy #1: Dependent couple profile. Taxonomy characteristics are older couples with a good support network with certain dependencies on this network.
- Taxonomy #2: Capable male profile. Taxonomy characteristics are independent males capable of managing most elements of their lifestyle. These participants may have some but no major health concerns.
- Taxonomy #3: Capable female profile. Taxonomy characteristics are independent females capable of managing most elements of their lifestyle. These participants may have some but no major health concerns.
- Taxonomy #4: Housebound profile. Taxonomy characteristics are male or female participants displaying high levels of dependency on others. These participants remain indoors for long periods, display serious health concerns, and may be socially isolated.
- Taxonomy #5: Rural profile. Taxonomy characteristics are male or female participants living in rural environments or participants from an agricultural background.
- Taxonomy #6: Socially isolated profile. Taxonomy characteristics are male or female participants that are largely socially isolated, typically with a very small support network.
- Taxonomy #7: Affluent profile. Taxonomy characteristics are participants who are financially comfortable and have high levels of independence with a good support network.
Table 4. The “Genetic” Makeup of Participants within the Seven Taxonomies
Data Display: Design of Personas
Following the qualitative methods of Miles and Huberman, the step following data analysis is “Data display” (p. 11). They defined data display as “…an organized, compressed assembly of information that permits conclusion drawing and action” (1994, p. 11). Silverman described data display as a stage where the researcher is further analyzing to demonstrate how coded elements are linked together (2005).
As they are visual and descriptive in nature, personas can fulfil an intrinsic role in the data display stage in ethnographic research. For design researchers, the visual nature of a display is extremely valuable in its ability to share, communicate, and allow for data findings to be interpreted and understood (White & Deevy, 2020).
Bringing Taxonomies to Life: From Taxonomy to Persona
The taxonomies created were used as the foundation for each persona data display. For the next steps in persona creation, there was a requirement to make realistic fictional narratives from the taxonomies. Firstly, the researcher read and edited each taxonomy memo list to construct hypothetical representative characteristic traits. During this process the researcher continually questioned the profile construct of each persona using hypothetical questions such as the following: Would this persona do or say this? or Is this an archetypal characteristic of this persona? Secondly, to protect identities, fictional pseudonyms were assigned.
Designing the Persona Displays
The physical appearance and organization of the display was very important to convey a realistic and rich representation of the persona. In displaying qualitative data, Patton recommended that “sufficient description and direct quotations should be included to allow the reader to enter into the situation and thoughts of the people represented” (2002, p. 503). Following Patton, the fundamental construct of the persona displays was “description” through direct quotations and photographs from the field. Figure 5 illustrates the template design of the persona display as it relates to the following:
- Rows containing detailed descriptions of the core category “Product data” consist of the subcategories Cooking, Heating, and Other Products.
- Rows containing descriptions of the core category “Persona data” consist of the subcategories Personal, Environment, and Health.
- Column contains description, narrative, and scenarios of the persona.
- Column contains a main descriptive image of the persona relating to each of the subcategory rows.
- Column highlights an informative direct quotation from each of the subcategory rows.
- These columns show secondary images in a montage relating to the subcategory.
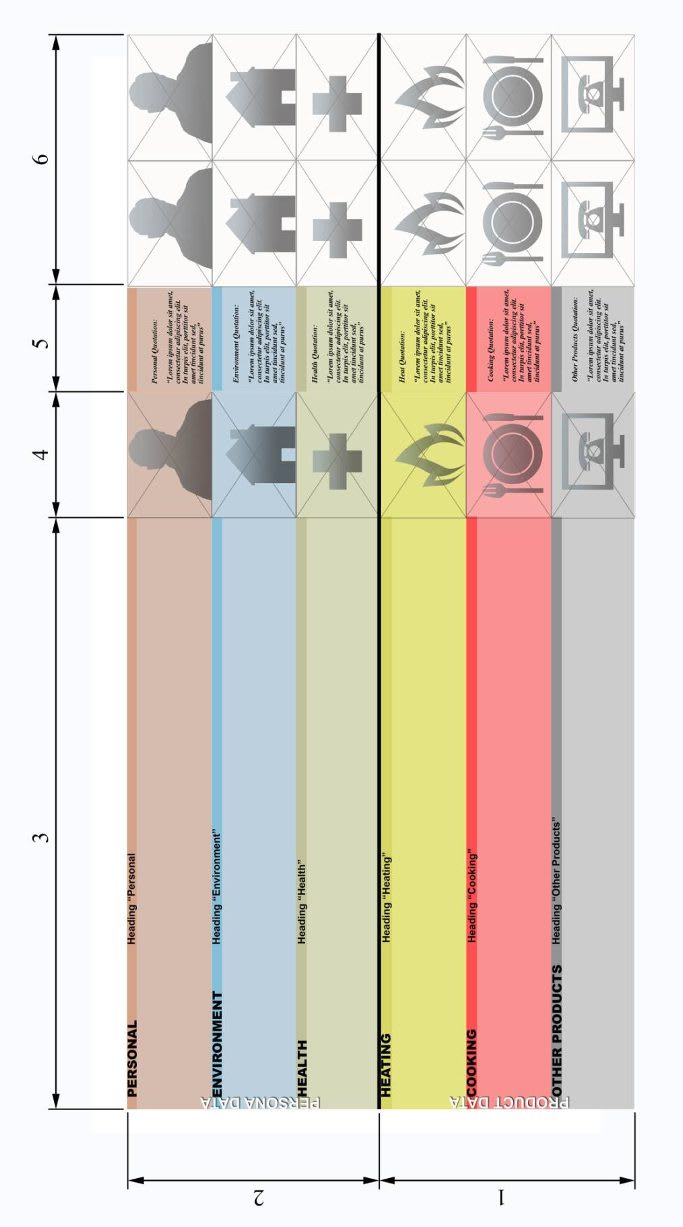
Figure 5. The persona display template.
The researchers constructed persona displays from the subcategories of the color-coding thematic framework, ensuring that the display design was easily understood by quickly reading the headings and observing the photographs (see example Figure 6). Before placing photographic data into the display, they were edited for confidentiality purposes. In persona creation, Pruitt and Adlin believe that photographs are critical and extremely influential in helping viewers believe and understand personas, which greatly affect how a persona is perceived (2006). The main profile image of the persona was therefore essential. One consideration was to use illustrated fictional characters as the main profile image. However, a study by Long suggested that illustrated (hand or digitally drawn) personas are less effective with a lower level of empathy ascribed to them, in contrast to a photographic persona (2009). Therefore, stock photography was used to represent each character. Using stock photography has some disadvantages with Pruitt and Adlin (2006) arguing that these can appear to be too polished, too professional, less realistic, and less “approachable.” However, with this in mind, stock photography was carefully considered, matching an appropriate image with each persona.
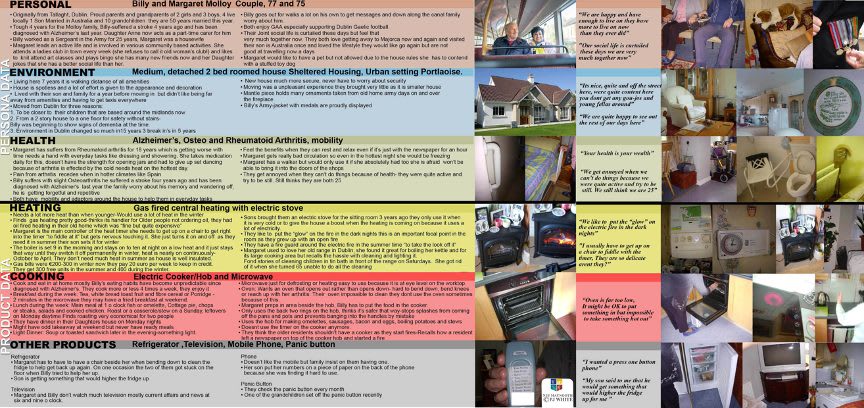
Figure 6. Example of completed persona display. (All photos except for main profile photo of the persona were taken by author P. J. White. Main profile photo of persona credit: Centre for Ageing Better, https://www.ageing-better.org.uk/sites/default/files/2021-01/Age-positive-image-library.pdf. These stock photos are free for use for commercial or non-commercial purposes, CC BY-ND 4.0.)
Reflection and Comparing Process Stages
Table 5 shows the correlation in best practice stages of creating personas compared with the grounded theory approach from this case study. Post fieldwork data management can be juxtaposed with Cooper et al.’s and Adlin and Pruitt’s early phase approaches: Coding and Grounded Theory with the middle phase and Data Reduction and Data Display with the late phase.
Table 5. Best Practice Stages of Creating Personas Compared with a Grounded Theory Approach Placed into the Early, Middle, and Late-Stage Phases of Development
|
|
Cooper et al. (2012) 7 Steps in Constructing Personas |
Adlin and Pruitt (2010) 6 Stages of Persona Development |
3 Phase Grounded Theory Approach |
|
Early |
Step 1: Identify behavioral variables. |
Stage 1. Finding data sources |
Post Fieldwork Data Management |
|
Middle |
Step 2: Map interview subjects to behavioral variables. |
Stage 2. Creating “factoids” from data |
Coding and Grounded Theory
|
|
Step 3: Identify significant behavior patterns. |
Stage 3. Affinity diagramming of factoids |
||
|
Late |
Step 4: Synthesize characteristics and relevant goals. |
Stage 4. Creating persona skeletons |
Data Reduction, Data Display, and Design of Personas |
|
Step 5: Check for completeness and redundancy. |
Stage 5. Prioritizing persona skeletons |
||
|
Step 6: Expand the description of attributes and behaviors. |
Stage 6. Creating persona foundation document |
||
|
Step 7: Designate persona types. |
By comparing approaches, we can deduct the advantages and disadvantages in the use of a grounded theory approach. It is evident that using grounded theory offers a more systematic approach to creating personas. This is particularly the case during the middle phase where a researcher is required to identify behaviors by extracting facts from the data. Structured coding can assist during this phase, removing subjectivity and offering a “breadcrumb trail” back to the data source. During the late stages of development, the qualitative acts of data reduction and data display align well with persona creation, with core categories and taxonomies adding structure to the process. Disadvantages in the process lie with the time it takes to systematically code through the data and manage the personas, particularly for practitioners who may be under strict deadlines to create insights from data. Future research and design work is required to streamline and digitize the process to assist workflow. Work is also required to assess the process in terms of universal design, understanding that the color-coding process could exclude visually impaired users. For this, a consultation will be held with the Centre for Excellence in Universal Design in Ireland when moving to the next stage of development. Future research will include co-designing the process with a range of practitioners to ensure their requirements are being met.
Conclusions
In this paper, design, qualitative research, and grounded theory are brought together in a systematic process for creating personas. Detailing a case study from ethnographic fieldwork, it describes methods and frameworks in which designers can create personas from a grounded theory approach. The paper then compares the approach against best practice examples to understand the advantages and disadvantages.
In creating personas, it is suggested that design ethnographers use traditional qualitative methods of analysis combined with design visualization methods to execute analysis of data for optimum effect. The color-coding process and the color-coding thematic framework act as an analysis tool and a classification/organization tool for design ethnographies. The importance of data reduction and data display in analyzing design ethnography was demonstrated, allowing for the depiction of all participants interviewed. Resulting in representative personas where designers may act upon, relate, share, and analyze data further.
In answering the original research question: Can using qualitative and grounded theory approaches assist to strengthen the process of creating personas? From this case study, it is evident that yes, they can; however, in doing so, the time to create and manage the personas increases. Future research is required to co-design, digitize, and streamline the process, making it more inclusive and accessible for design practitioner use.
Tips for Usability Practitioners
The following information can be used when practitioners are creating personas in their own work:
- Use traditional qualitative methods of analysis combined with design visualization methods to execute analysis of data for optimum effect.
- Color-code text and images from fieldwork into broad themes as soon as the fieldwork is complete. The color-coding thematic framework can assist as an analysis tool in this.
- Review and synthesize data in groups of two or more allowing fieldwork for differing interpretations of data.
- Create taxonomies or groupings of representative users early in the process to help synthesis data.
- Understand that some methods within a grounded theory approach may be time-consuming for practitioners. Structured coding can, however, assist in removing subjectivity and offer an important “breadcrumb trail” back to the data source.
Acknowledgements
We would like to thank all the participants and stakeholders who took part in this study.
References
Adlin, T., & Pruitt, J. (2010). The essential persona lifecycle: Your guide to building and using personas. Morgan Kaufmann.
Anderson, R. J. (1994). Representations and requirements: The value of ethnography in system design. Human-Computer Interaction, 9(3), 151–182. https://doi.org/10.1207/s15327051hci0902_1
Belotto, M. J. (2018). Data analysis methods for qualitative research: Managing the challenges of coding, interrater reliability, and thematic analysis. The Qualitative Report, 23(11), 2622–2633.
Bengtsson, M. (2016). How to plan and perform a qualitative study using content analysis. NursingPlus Open, 2, 8–14. https://doi.org/10.1016/j.npls.2016.01.001
Blomberg, J., Burrell, M., & Guest, G. (2003). An Ethnographic Approach to Design. In A. J. Jacko & A. Sears (Eds.), The human-computer interaction handbook (pp. 964-986): L. Erlbaum Associates Inc.
Blomberg, J., Giacomi, J., Mosher, A., & Swenton-Wall, P. (2017). Ethnographic field methods and their relation to design. In D. Schuler & A. Namioka (Eds.), Participatory Design (pp. 123–155). CRC Press.
Chapman, C. N., & Milham, R. P. (2006). The persona’s new clothes: Methodological and practical arguments against a popular method [Paper presentation]. Proceedings of the Human Factors and Ergonomics Society 50th Annual Meeting, San Francisco, CA, USA. https://doi.org/10.1177%2F154193120605000503
Charmaz, K., & Mitchell, G. R. (2001). Grounded theory in ethnography. In P. Atkinson, A. Coffey, S. Delamont, J. Lofland, & L. Lofland (Eds.), Handbook of ethnography (pp. 161–171). SAGE Publications.
Cooper, A. (1997). The inmates are running the asylum: Why high tech products drive us crazy and how to restore the sanity. Sams Publishing.
Cooper, A. (2008). The origin of personas. Cooper Journal of Design.
Cooper, R., & Edgett, S. (2008). Ideation for product innovation: What are the best methods? PDMA Visions Magazine, 32.
Cooper, A., Reimann, R., & Cronin, D. (2012). About face 3: The essentials of interaction design. Wiley Publishing Inc.
Corbin, J., & Strauss, A. (2008). Basics of qualitative research: Techniques and procedures for developing grounded theory (3rd Ed.). SAGE Publications.
De Voil, N. (2010). Personas considered harmful. Retrieved from http://www.devoil.com/papers/PersonasConsideredHarmful.pdf
Emerson, M. R., Fretz, I. R., & Shaw, L. L. (1995). Writing ethnographic fieldnotes. The University of Chicago Press.
Faily, S., & Flechais, I. (2011). Persona cases: A technique for grounding personas. CHI Conference on Human Factors in Computing Systems, Vancouver, BC, Canada. https://doi.org/10.1145/1978942.1979274
Fetterman, D. (1989). Ethnography: Step-by-step (Vol. 17). SAGE Publications.
Goodman, J., Clarkson, P. J., & Langdon, P. (2006). Providing information about older and disabled users to designers [Paper presentation]. Human Computer Interaction (HCI) The Web and the Older Population Workshop, London, UK.
Long, F. (2009). Real or imaginary: The effectiveness of using personas in product design [Paper presentation]. IES Conference 2009, Dublin, Ireland.
Marston, H. R., Shore, L., & White, P. J. (2020). How does a (smart) age-friendly ecosystem look in a post-pandemic society? International Journal of Environmental Research and Public Health, 17(21). https://doi.org/10.3390/ijerph27218276
McCurdy, D. W., Spradley, J. P., & Shandy, D. J. (2005). The cultural experience—Ethnography in complex society (2nd Ed.). Waveland Press.
Miles, M., & Huberman, A. M. (1994). Qualitative data analysis: An expanded sourcebook (2nd Ed.). SAGE Publications.
Nielsen, L., & Storgaard Hansen, K. (2014). Personas is applicable: A study on the use of personas in Denmark [Paper presentation]. CHI ’14: Proceedings of the SIGCHI Conference on Human Factors in Computing Systems. https://doi.org/10.1145/2556288.2557080
Patton, M. (2002). Qualitative research and evaluation methods (3rd Ed.). SAGE Publications.
Plowman, T. (2003). Ethnography and critical design practice. In B. Laurel (Ed.), Design research: methods and perspectives (pp.30–38). The MIT Press.
Pruitt, J., & Adlin, T. (2006). The persona lifecycle: Keeping people in mind throughout product design. Morgan Kaufmann.
Robson, C. (2002). Real world research: A resource for social scientists and practitioner- researchers (2nd Ed.). Wiley-Blackwell Publishers.
Salazar, K. (2018). Why personas fail. https://www.nngroup.com/articles/why-personas-fail/
Saldaña, J. (2009). The coding manual for qualitative researchers. SAGE Press.
Salvador, T., Bell, G., Bell., & Anderson, K. (1999). Design ethnography. Design Management Journal, 10(4), 35–41.
Scheper-Hughes, N. (1979). Saints, scholars, and schizophrenics-mental illness in rural Ireland. University of California Press.
Seidel, J. (1998). Qualitative data analysis. The Ethnograph (Version 5, Appendix E). Available at http://eer.engin.umich.edu/wp-content/uploads/sites/443/2019/08/Seidel-Qualitative-Data-Analysis.pdf
Silverman, D. (2005). Doing qualitative research: A practical handbook (2nd Ed.). SAGE Publications.
Silverman, D. (2006). Interpreting qualitative data: Methods for analysing talk, text and interaction (3rd Ed.). SAGE Publications.
So, C., & Joo, J. (2017). Does a persona improve creativity? The Design Journal, 20(4), 459–475. https://doi.org/10.1080/14606925.2017.1319672
Torres de Souza, M., Hörding, O., & Karol, S. (2019). The story of Spotify personas. Spotify.
Vrkljan, B., Whalen, A., Kajaks, T., Nadarajah, S., White, P. J., Harrington, L., & Raina, P. (2019). Creating an intergenerational university hub: Engaging older and younger users in the shaping of space and place. Gerontology & Geriatrics Education, 40(2), 244–260. https://doi.org/10.1080/02701960.2019.1572010
White, P. J. (2012). Designer as ethnographer: A study of domestic cooking and heating product design for Irish older adults [PhD dissertation, National University of Ireland Maynooth, Maynooth]. http://mural.maynoothuniversity.ie/4740/1/PhD%20Thesis_PJ%20White.pdf
White, P. J. (2013a). Ethnography in design for older people [Paper presentation]. Proceedings of the 2nd European Conference on Design 4 Health, Sheffield, UK. https://core.ac.uk/download/pdf/34614893.pdf#page=62
White, P. J. (2013b). Concept development board of a domestic heating product for older adults. Ethnographic Praxis in Industry Conference Proceedings, 2013(1), pp. 407–407. https://doi.org/10.1111/j.1559-8918.2013.00038.x
White, P. J. (2018). Designing a domestic heating product for older people within the concept of “contained living spaces”. In B. a. U. Worsfold, E. (Ed.), Ideas, Products, Services …: Social Innovation for Elderly Persons (pp. 159–169): Edicions i Publicacions de la Universitat de Lleida. https://www.researchgate.net/publication/340967610_Designing_a_Domestic_Heating_Product_for_Older_People_Within_the_Concept_of_’Contained_Living_Spaces‘
White, P. J., & Deevy, C. (2020). Designing an interdisciplinary research culture in higher education: A case study. Interchange, 51(4), 499–515. https://doi.org/10.1007/s10780-020-09406-0
White, P. J., & Devitt, F. (2011). The design and development of novel cooking and heating products for Irish older adults: A real health need. Design Principles and Practices: An International Journal, 5(3), 13. https://doi.org/10.18848/1833-1874/CGP/v05i03/38081
White, P. J., Marston, H. R., Shore, L., & Turner, R. (2020). Learning from COVID-19: Design, age-friendly technology, hacking and mental models. Emerald Open Research, 2(22). https://doi.org/10.35241/emeraldopenres.13599.1
Zamawe, F. C. (2015). The implication of using NVivo software in qualitative data analysis: Evidence-based reflections. Malawi Medical Journal, 27(1), 13–15. https://doi:10.4314/mmj.v27i1.4
[:]