
Abstract
Previous research suggests that the System Usability Scale (SUS) might not be generating usability scores that span the entire measurement range from 0 to 100, particularly at the lower end of the scale. Most published literature has reported study mean scores that are typically above 40. The use of only a subset of the SUS could change how collected data is interpreted, especially when comparing the relative usability of systems. In this study, participants reported their subjective usability assessments of 14 different voting interfaces using the SUS. Participants were given a packet that contained the 14 ballots presented in random order. After completing each ballot, the participants were given the SUS and asked to rate the usability of the ballot that they had just used. Results showed that nearly the entire range of the available scale was used, with average study scores ranging from 15.4 to 93.0. Nine of the 14 ballot means were below 50, the midpoint of the SUS scale, demonstrating that low end range limitation is not an intrinsic characteristic of the scale. A partial replication was performed with a subset of three ballots (best, worst, and midpoint); the results were nearly identical. Further research is required to characterize systems with low SUS scores.
Tips for Usability Practitioners
When using the SUS, consider the following points:
- When measuring and interpreting the subjective usability of a system using the SUS, keep in mind that it is possible for scores to span the entire range of the scale, versus bottoming out around 40 as reported in previous research.
- When comparing SUS scores across tested systems, consider that a single, well-defined task on a simple interface may potentially score lower than multiple tasks on a more complex interface—even if both systems are equally unusable.
- While further research is required to understand why SUS scores may be limited under specific conditions, practitioners should still confidently use the SUS to measure subjective usability; the instrument adequately identifies low and high usability systems with scores that span the full spectrum of the scale.
Introduction
The System Usability Scale (SUS; Brooke, 1996) is an instrument that allows usability practitioners and researchers to measure the subjective usability of products and services. Specifically, it is a 10 item survey that can be administered quickly and easily, and it returns scores ranging from 0 100. It has been demonstrated to be a reliable and valid instrument (Bangor, Kortum, & Miller, 2008; Kirakowski, 1994), is robust with a small number of participants (Tullis & Stetson, 2004), and has the distinct advantage of being technology agnostic, meaning it can be used to evaluate a wide range of hardware and software systems (Brooke, 2013).
One ongoing concern with the SUS is that its effective measurement range might be less than 100 points, as the SUS has tended to exhibit a lower range limitation for study means. While individual scores commonly span the full 100-point range, study means for a product or system rarely fall below a score of 50, even when the product has significant failure rates. Bangor, Kortum, and Miller (2008) described a study where success metrics were as low as 20%, but SUS scores never went below 60. Larger studies of collected SUS scores confirm this range limitation. In the same paper, Bangor, Kortum, and Miller reported the study means from 206 different studies and found that less than 1.5% of them had study SUS means below 40. This is the same trend that Sauro (2011) reported, where approximately 4% of his 233 reported studies had study means less than 40. Similar restriction in the high end is not seen. Group mean SUS scores of 80 or higher accounted for 27% of the scores in the Bangor, Kortum, and Miller study and approximately 17% in Sauro’s. Recent work by Kortum and Bangor (2013) reported SUS scores for everyday products and found no mean ratings below 50.
Why would such a limited effective range matter? Basic psychometric principles suggest that using only half of a scale changes how data collected using that scale should be interpreted, especially when comparing the relative usability of systems. If 50 really is the absolute floor for SUS scores, then the lower half of the scale (0-49) can no longer be interpreted as defining abysmal usability. Instead, the midpoint must now be defined as the lowest usability attainable and adjective ratings (Bangor, Kortum, & Miller, 2009) would need to be adjusted to reflect that. It is akin to grade inflation—when no one gives an F, then the interpretations of C-minus must be reconsidered to reflect that it now means abysmal performance.
To give an example in the context of usability research, if a group of participants are unable to complete a single task with a tested interface (i.e., success rate = 0%), but still rate the usability of that interface as a 50 with the SUS instrument, then fundamental questions about the basis of their subjective assessment arise. ISO 9241-11 specifies three measures of usability: (a) effectiveness (can users perform the task?), (b) efficiency (can they perform the task within acceptable time limits?), and (c) satisfaction (are they pleased with the operation of the interface in their accomplishment of the task?; ISO, 1998). If a user has failed to complete the task, then their effectiveness should be zero. Typically, failed tasks take longer than successful tasks to complete, so efficiency should also be greatly reduced. Finally users are rarely satisfied if they fail to accomplish their goal. On all three ISO metrics, failure of the task should lead to significantly lower SUS scores, and those scores should potentially span the entire range allowed by the SUS, just as success varies from 0-100%. This limitation of SUS usability scores could result in inaccurate correlations between the usability measurement and other variables of interest such as success rates, user experience (Kortum & Johnson, 2013; McLellan, Muddimer, & Peres 2012), consumer trust (Flavián, Guinalíu, & Gurrea, 2006), and gender and age. If this compression of SUS scores is proportional, then it would not be a problem. However, we have no evidence about the form of potential compression, so it remains a concern. Further, even though the limitations of the effective range of a scale can be corrected mathematically (Bobko, Roth, & Bobko, 2001; Wiberg & Sundström, 2009), determining if such a correction is warranted is a necessary first step.
This study attempts to determine if the limited effective range found in previous work is a property of the SUS itself, or perhaps a property of the kinds of studies or interfaces previously tested. To do this, voters’ subjective usability measures were examined by using the SUS to evaluate a variety of paper voting interfaces. Voting ballots provide a unique platform to study the potential range limitation problem in the SUS, because voting is generally viewed as an important, yet personal, task that is singular in nature. The personal nature of the task allows users to assess if their voting intent was reflected on the ballot (effectiveness), how long it took them to express their opinion or belief through a selection, i.e., vote, (efficiency), and if the process met their expectations and made them comfortable with their voting selection (satisfaction). The singular nature of the task means that the user will be focused on the single physical operation of marking the ballot, and this means that there is not a significant amount of multi-task integration, as might be seen with other more complex interfaces.
Methods
The following sections discuss the participants, materials, and procedure used in this study.
Participants
The population consisted of 32 undergraduate students from Rice University with an age range of 18 to 22. Gender was unspecified. For their participation, participants were given credit in partial fulfillment of a class requirement.
Materials
The System Usability Scale was used to capture participants’ subjective usability assessments of voting ballots. The modified System Usability Scale described by Bangor, Kortum, and Miller (2008) was used, and the word “ballot” was substituted for the word “system.” This change in wording is an accepted practice in System Usability Scale administration and has been shown not to have any detrimental effects on the reliability or validity of the measures (Sauro, 2011). The fully modified SUS used in this study is shown in Figure 1.
A set of 14 different paper ballots were administered to participants in the study and are shown in Figures 2 and 3. The ballots reflect a wide range of possible design choices, and were roughly modeled on examples from the real world, or were composites of different ballot designs. Each ballot has between four and six possible choices, using a question on which a typical participant could easily form an opinion. This design has two benefits. First, it allows the participant to focus on the voting process and the ballot—as opposed to any extraneous, evocative properties of that ballot. For example, the ballots do not have the typical name/party affiliation format and use non-controversial ballot choices, because using partisan races, real political figures, and controversial ballot selections has the potential to evoke emotional responses that might impact a participant’s assessment of the underlying usability (Ladd & Lenz, 2008). To verify that the ballots had no important evocative features, we conducted a post test that correlated the valence score for each ballot with its usability (SUS) score. This correlation (r2=.010) was not significant, F(1,12)=0.12, MSE=503.87, p=.738. Second, by using issues that a voter can actually form an opinion about (as opposed to slate voting or nonsense ballot choices), these ballot designs provide participants with the opportunity to cognitively engage in making a ballot selection.
Procedure
After signing an IRB-approved consent form, participants were given a packet that contained the 14 ballots, which were presented in random order. After completing each ballot, the participant was asked to complete a System Usability Scale. This procedure continued until the participant had voted and rated all 14 ballots. Upon completion of the formal rating process, participants were asked to identify the least and most usable ballots.
Results
System Usability Scale scores for each of the ballots are shown in Figure 4. As can be seen, scores ranged from 15.4 to 93.0. Standard deviations are within the ranges described by Bangor, Kortum, and Miller (2008). The SUS scores are reliably different, F(13) = 50.2, MSE = 299.2, p < .001, η2 = .62. Nine of the 14 group means are below 50, the midpoint of the available SUS range. Figure 5 shows the results for the post-hoc pairwise comparisons (FDR corrected) of all the ballots’ means.
A manipulation check was conducted to insure that ballot presentation order did not impact usability judgments by raters. Specifically, we individually looked at the highest rated ballot overall and the lowest rated ballot overall and compared their mean SUS scores when they were presented in the first five positions and when they were presented in the last five positions. A t-test revealed that there was no significant difference in either case (most usable: t(25)=1.57, p=.130, least usable: t(20)=0.57, p=.576), demonstrating that the order of presentation did not impact SUS scores.
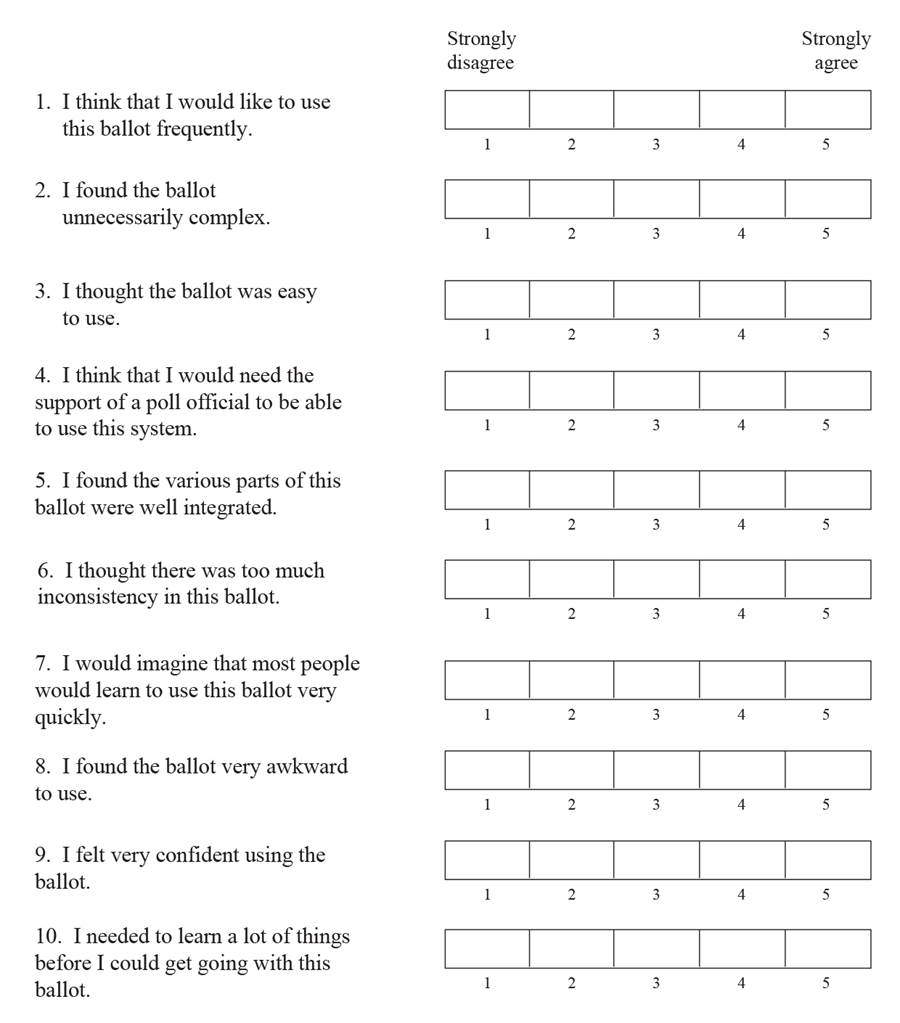
Figure 1. The Modified System Usability Scale used in the study
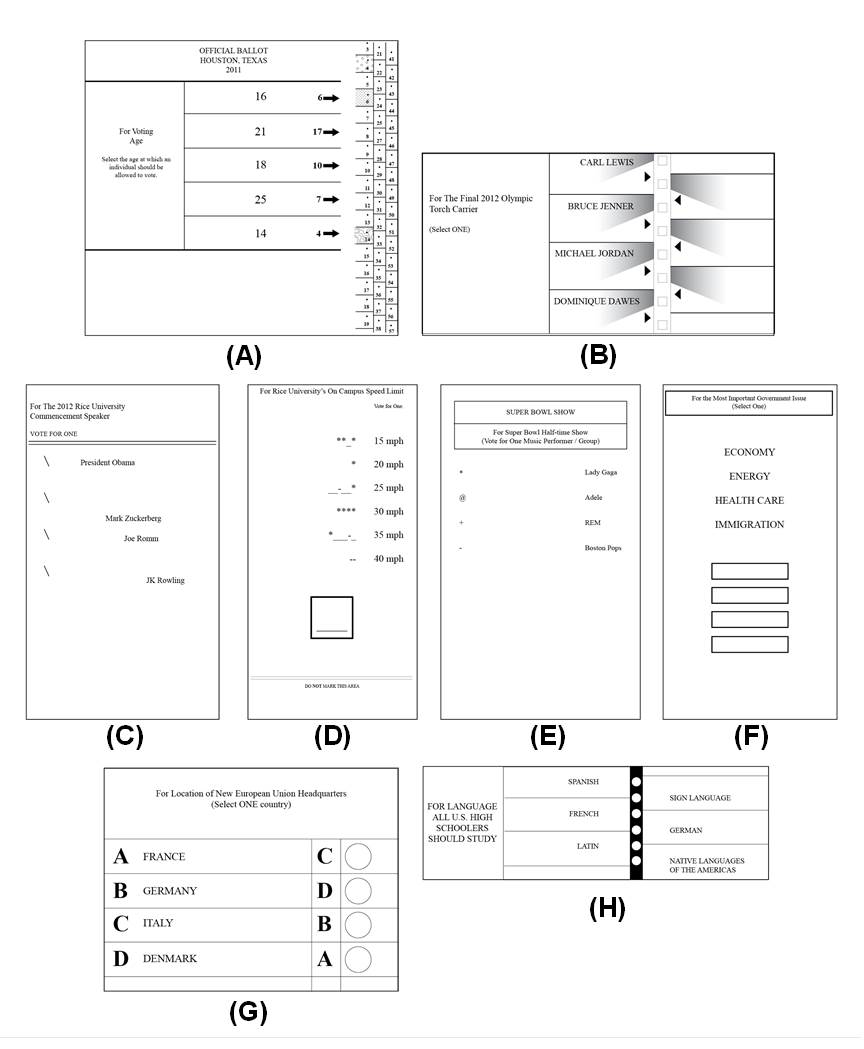
Figure 2. The eight bottom ranked ballots used in the study (SUS < 40)
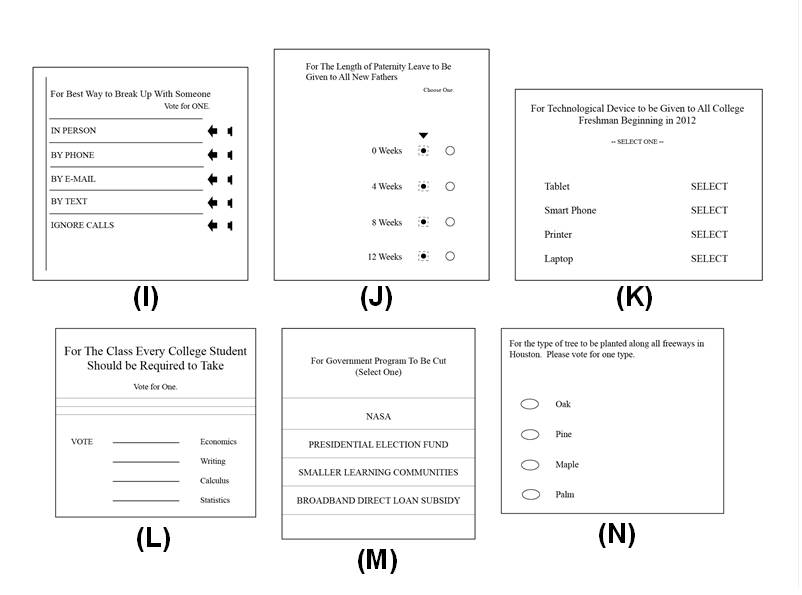
Figure 3. The six top ranked ballots used in the study (SUS > 40)
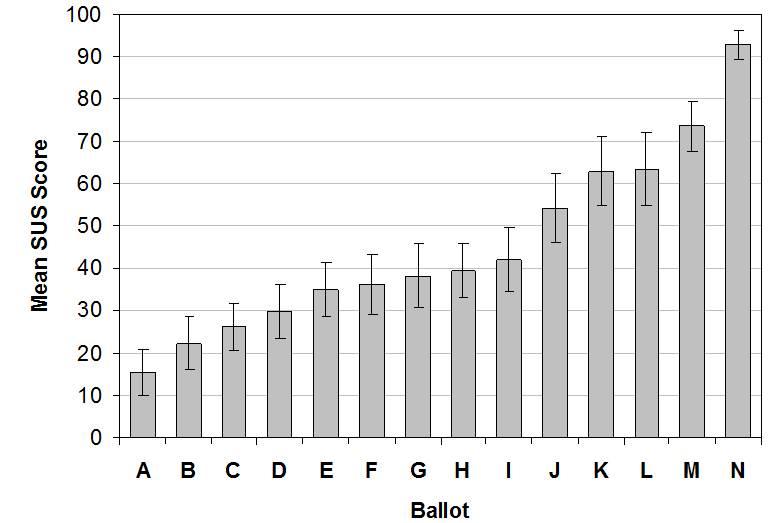
Figure 4. Mean SUS scores for each of the ballots with error bars representing the 95% CI
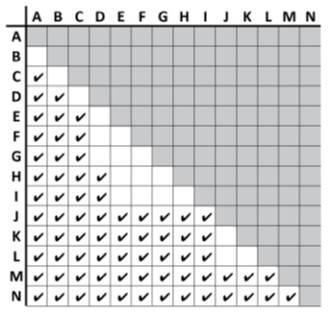
Figure 5. Post-hoc pairwise comparisons of all the ballots with check marks indicating a difference between ballots’ mean scores
The ballots indicated to be least and most usable are shown in Figure 6. As can be seen, there was high agreement about which of the ballots was most usable, but slightly more disagreement on which ballot was least usable. One ballot (ballot B) was ranked as most usable by one participant and least usable by a few other participants. Both results align with the numeric scores obtained from the SUS.
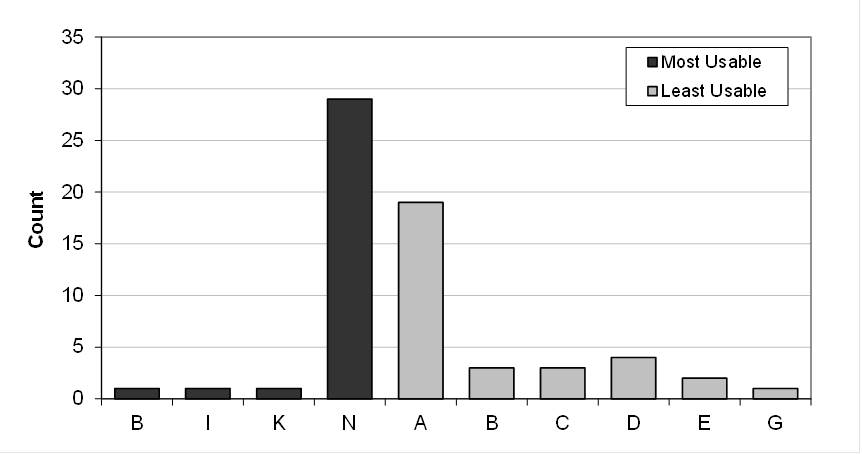
Figure 6. Counts for the self-reported most usable and least usable ballots
Replication
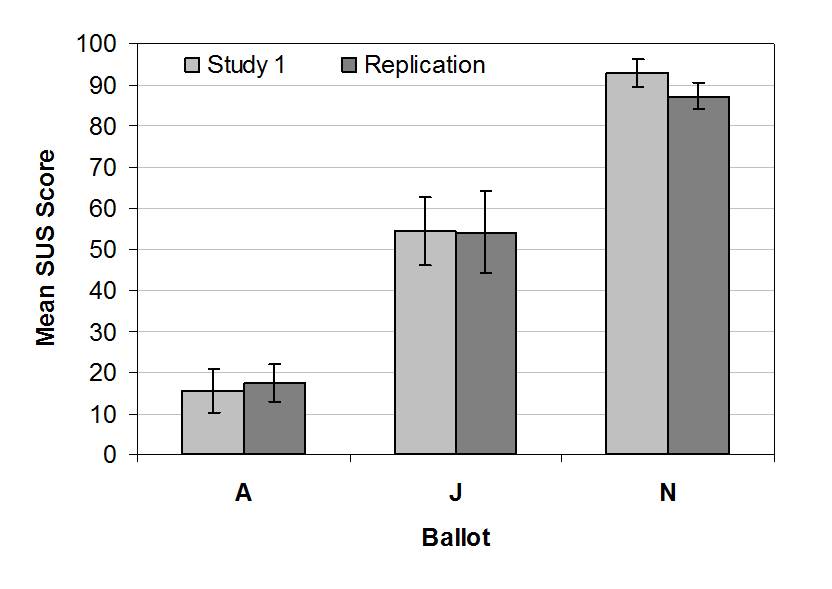
In a partial replication of the experiment, the highest scoring ballot (ballot N), the lowest scoring ballot (ballot A), and the ballot representing the mid-point SUS score (ballot J) were re-run through an identical protocol. Thirty new participants from the same population that participated in the first study made up the sample. As before, the ballots were administered in a random order. Participants voted with a ballot and then rated it using the Modified SUS. This process repeated until participants voted using all three ballots. As can be seen in Figure 7, the results from this study are nearly identical to those found in the primary study.
Figure 7. Mean SUS score comparison for the first study and the partial replication with error bars representing the 95% confidence interval
Discussion and Conclusion
The data from these experiments clearly show that the System Usability Scale’s generated scores may not be as limited as reported in previous studies. Approximately 57% of the voting interfaces yielded study mean SUS scores below the 40-point mark. This is in sharp contrast to the 1.5% found by Bangor, Kortum, and Miller (2008) and the 4% reported by Sauro (2011).
Why might these previous studies have such different results when compared to the current study? It is not because we set out to design the worst possible interfaces in an attempt to drive down SUS scores. The ballots reflect a wide range of possible design choices and were roughly modeled on examples from the real world, or were composites of different ballot designs. In many respects, the interfaces were quite simple by today’s complex electronic interface standards; there was a single goal, a static medium, and one physical action necessary to accomplish the task. However, even if we had set out to design the worst possible interfaces, it would not invalidate low SUS scores associated with poorly designed interfaces.
One likely explanation for the reduced range of SUS scores found in previous studies is that when measuring system usability, the researchers had users perform a wider variety of tasks with the interface. Although practitioners often do administer the SUS after every task when they are trying to determine performance characteristics of several competing interfaces, more often, SUS results are reported as an aggregate score of all tasks for a given interface, or the user is asked to make a final summative rating of the interface at the end of the study. This would result in users integrating their worst and best experiences with the interface in their final assessment of the interface as a whole. In this voting experiment, participants rated each ballot using the SUS immediately after they had voted with the ballot. This means that they were not averaging over a number of different tasks or interfaces, but were able to focus solely on a single task completed on a single interface.
It is also possible that there is something about voting interfaces that drives SUS scores down. Given the previously published literature on the usability of voting interfaces, this does not seem likely. In general, voting systems have received surprisingly high SUS scores. SUS scores for paper ballots (81.3), lever machines (71.5), electronic vote tablets (86.1), punch cards (69.0), telephone voting systems (86.2), and smartphone voting platforms (83.8) are all well above the 40-mark (Campbell, Tossell, Byrne, & Kortum, 2010; Everett et al., 2008; Greene, Byrne, & Everett, 2006). It might also be possible that in the more complex voting systems, other factors (e.g., learnability, navigation functions, physical form of the hardware, etc.) are being measured indirectly by the SUS, thus inflating the score. In this study’s set of very simple single-race interfaces, that unknown factor might not be an issue.
A third possibility is that users might be generally unwilling to rate the usability of products poorly. Rater bias can take many forms including leniency bias, strictness bias, and social desirability bias, just to name a few (see Hoyt, 2000 for a review). Importantly, these biases are not unidirectional, and we have found no evidence that usability raters fall into a single category of rating bias. The low SUS scores found in this study suggest that we are not seeing a strict rating bias problem with the SUS.
While low study mean SUS scores are not often found, they are not impossible to obtain. The data presented in this paper show that study mean scores as low as 15 are possible for specific interfaces. Accordingly, the confidence of practitioners relying on the SUS to measure subjective usability should increase, because the instrument can adequately identify low and high usability interfaces associated with scores from across the full spectrum of the scale. Future research should focus on exactly why previous studies’ SUS scores tend to cluster on the high end of the scale when this study has demonstrated that the SUS is not inherently range limited.
References
- Bangor, A., Kortum, P., & Miller, J.A. (2008). The System Usability Scale (SUS): An empirical evaluation. International Journal of Human-Computer Interaction, 24(6), 574-594.
- Bangor, A., Kortum, P., & Miller, J.A. (2009). Determining what individual SUS scores mean: Adding an adjective rating scale. Journal of Usability Studies, 4(3), 114-123.
- Bobko, P., Roth, P., & Bobko, C. (2001). Correcting the effect size of d for range restriction and unreliability. Organizational Research Methods, 4(1). 46-61.
- Brooke, J. (1996). SUS: A ‘quick and dirty’ usability scale. In P.W. Jordan, B. Thomas, B.A. Weerdmeester, & I.L. McClelland (Eds.) Usability Evaluation in Industry (pp. 189-194). Taylor & Francis: London.
- Brooke, J. (2013). SUS: A Retrospective. Journal of Usability Studies, 8(2). 29-40.
- Campbell, B., Tossell, C., Byrne, M.D., & Kortum, P (2010). Voting on a smartphone: Evaluating the usability of an optimized voting system for handheld mobile devices. Proceedings of the Human Factors and Ergonomics Society (pp. 1100-1104), Santa Monica, CA: Human Factors and Ergonomics Society.
- Everett, S. P., Greene, K. K., Byrne, M. D., Wallach, D. S., Derr, K., Sandler, D., & Torous, T. (2008). Electronic voting machines versus traditional methods: Improved preference, similar performance. Human Factors in Computing Systems: Proceedings of CHI 2008 (pp. 883-892). New York: ACM.
- Flavián, C., Guinalíu, M., & Gurrea, R. (2006). The role played by perceived usability, satisfaction and consumer trust on website loyalty. Information & Management, 43(1). 1-14.
- Greene, K. K., Byrne, M. D., & Everett, S. P. (2006). A comparison of usability between voting methods. In Proceedings of the 2006 USENIX/ACCURATE Electronic Voting Technology Workshop. Vancouver, BC.
- Hoyt, W.T. (2000). Rater bias in psychological research: When is it a problem and what can we do about it? Psychological Methods, 5(1). 64-86.
- ISO. (1998). Ergonomic requirements for office work with visual display terminal (VDT’s) – Part 11: Guidance on Usability (ISO 9241-11(E)). Geneva, Switzerland: International Organization for Standardization.
- Kirakowski, J. (1994). The use of questionnaire methods for usability assessment. Retrieved from http://sumi.ucc.ie/sumipapp.html
- Kortum, P., & Bangor, A. (2013). Usability ratings for everyday products measured With the System Usability Scale (SUS). International Journal of Human Computer Interaction, 29, 1-10.
- Kortum, P., & Johnson, M. (2013). The relationship between levels of user experience with a product and perceived system usability. Proceedings of the Human Factors and Ergonomics Society, Santa Monica, CA: Human Factors and Ergonomics Society.
- Ladd, J.M., & Lenz, G.S. (2008). Reassessing the role of anxiety in vote choice. Political Psychology, 29(2), 1467-9221.
- McLellan, S., Muddimer, A., & Peres, S.C. (2012). The effect of experience on System Usability Scale ratings. Journal of Usability Studies, 7(2). 56-67.
- Sauro, J. (2011). A practical guide to the System Usability Scale: Background, benchmarks, & best practices. Denver, CO: Measuring Usability LLC.
- Tullis, T. S., & Stetson, J. N. (2004). A comparison of questionnaires for assessing website usability. Proceedings of UPA 2004 Conference. Minneapolis, Minnesota.
- Wiberg, M., & Sundström, A. (2009). A comparison of two approaches to correction of restriction of range in correlation analysis. Practical Assessment, Research and Evaluation, 14(5), 1-9.