
[:en]
Abstract
More than 1 in 5 Canadians are immigrants. While industries and public services in the country interact with users of diverse backgrounds, it is unclear how the cultural and linguistic backgrounds of users influence their perceived usability of services. We conducted a usability test of the website of Immigration, Refugee and Citizenship Canada (IRCC) to explore cultural—Individualism/Collectivism, Power Distance, and Uncertainty Avoidance—and linguistic variables with English-speaking international students from China, India, and Nigeria and French-speaking international students. We found that second-language participants were more comfortable with the website’s language, and Chinese and Nigerian participants criticized the interface more than Indian participants. Our work suggests that researchers should recruit and understand participants from multiple cultural and linguistic backgrounds to ensure the reliability and reproducibility of usability test results and protocols.
Keywords
Usability, cultural variables, linguistic variables, English, French, website evaluation
Introduction
In usability studies, the cultural background of participants can impact their behaviors and responses during interviews, probe testing, and surveys (J.-J. Lee & Lee, 2007). For instance, the cultural background of a participant may influence their willingness to offer criticism (J.-J. Lee & Lee, 2007) and also their attitude, trust, and adoption intention toward a product (Rufín et al., 2014). Similarly, cultural variables can impact how participants respond to usability measures (e.g., extreme response style: choosing/avoiding extreme anchors on Likert scales; acquiesce response style: providing answers to please researchers; Duh & Chen, 2007), as well as how they interact with a moderator during a testing session (Sun & Shi, 2007).
Another factor that can influence the behaviors and responses of participants is their spoken language versus the language in which the usability test is conducted (Hillier, 2003). Research indicates that multilingual people adopt different personalities when speaking different languages, and each personality is associated with different preferences (Hillier, 2003; Singh et al., 2005). These differences can impact the perceived usability of interfaces (Nantel & Glaser, 2008).
These past cross-cultural studies rest on Hofstede’s (1980; et al., 2010) renowned work on cultural dimensions where he identified five dimensions that can describe and predict attitudes, behaviors, and emotions of people in different cultures. These dimensions are Collectivism/Individualism, Power Distance, Uncertainty Avoidance, Time Orientation, and Masculinity/Femininity (Hofstede et al., 2010). Researchers have used these dimensions in the field of Human Computer Interaction (HCI) to explore cultural and linguistic variables in different contexts (Dell et al., 2012; J.-J. Lee & Lee, 2007; S.-G. Lee et al., 2013; Shi & Clemmensen, 2008; Vatrapu & Pérez-Quiñones, 2006; Wallace et al., 2013). Yet, we found little work exploring the impact of cultural and linguistic variables in usability testing.
Study Objective
Against this background, we sought to understand the role of cultural and linguistic differences in usability testing, with the objective of helping to inform researchers and practitioners on how to account for them in their work. More specifically, we posed the following research question:
How do cultural and linguistic backgrounds of users influence their answer tendencies during usability testing?
To address this research question, we designed a usability test for the Immigration, Refugee and Citizenship Canada’s (IRCC) website. We collected responses from current international students studying in Canada and discussed their experience with the website. The IRCC website was a perfect medium to explore our research question because the website is available in English and in French, which are the two official languages of Canada, and this affordance allowed us to understand the usability experiences of both English-speaking and French-speaking international students. The Canadian government requires that all documentation and communication from its agents and online be written in English that a grade 8 student or lower could understand (Treasury Board of Canada Secretariat, 2020).
We first conducted a usability test in English to understand the influence of cultural background with English-speaking international students from China, India, and Nigeria. We recruited students from these three countries for two reasons: They scored differently across Hofstede’s dimensions (1980), and they also have different English linguistic backgrounds. Then, we conducted a second usability test in French with French-speaking international students. This was done to investigate the influence of linguistic background where we compared the results obtained from this population against the results obtained from English-speaking participants from China, India, and Nigeria.
This work contributes insights to how cultural and linguistic backgrounds influence participants’ answer tendencies during usability testing. These findings can inform researchers and practitioners who prepare and conduct usability testing sessions with users of different cultural and linguistic backgrounds, so that they can minimize possible cross-cultural biases when developing their study methodologies. In what follows, we provide relevant literatures on the role of culture and language in usability testing and then outline research methods and present and discuss our findings. Most importantly, we suggest mitigation strategies that can reduce cultural and language biases when designing and conducting a usability test.
Literature Review
Achieving a fully representative set of users, tasks, and environments is challenging for researchers because there are many factors that can introduce biases to results. The following sections discuss the potential elements that can influence the results of a usability test.
Biased Results in Usability Testing
We can divide the types of factors that influence the results of usability testing into two main categories: methodological bias and socio-demographic bias. Methodological biases include the location of the test (Karusala et al., 2018; Molich & Dumas, 2004; Sauer et al., 2019), the number of participants recruited (Lewis, 2007; Spool & Schroeder, 2001), participants’ previous exposure to usability testing (Clemmensen & Qingxin, 2008; Schirra & Allison, 2018), and prior feedback given by the public before the test (Dell et al., 2012; Grimm, 2010; Vashistha et al., 2018). Examples of socio-demographic biases are common elements of comparison in usability testing such as age (Rose et al., 2018; Sonderegger et al., 2015), gender (Kim et al., 2019; Zhang et al., 2017), culture (Wallace et al., 2013), and language (Hillier, 2003). In this research, we focus our attention on the socio-demographic bias that stems from culture and language.
Cultural Variables
As suggested by McCrae and Terracciano (2005), we remind readers that drawing conclusions about personality traits and behaviors of members of different cultures has to be done respectfully. We should be mindful of the range of individual differences that can be found within each culture.
According to Hofstede et al. (2010), countries can be compared on five dimensions: Individualism/Collectivism, Power Distance, Uncertainty Avoidance, Time Orientation, and Masculinity/Femininity. We base our research on his work because these dimensions are the only national cultural classification used to evaluate users’ preferences (Reinecke & Bernstein, 2013). Hofstede assigned an index score for each of the dimensions to countries, with a score of 50 (out of 100) serving as the threshold between low (below 50) and high (above 50) scores. Below are definitions of the five cultural dimensions:
- Individualism/Collectivism (IND) is the extent to which members of a society are integrated into groups.
- Power Distance (PD) is the extent to which the less powerful members of institutions and organizations within a country expect and accept that power is distributed unequally.
- Uncertainty Avoidance (UA) is the extent to which the members of a culture feel threatened by ambiguous or unknown situations.
- Time Orientation (TO) is the extent to which people focus on future or present goals.
- Masculinity/Femininity (MF) is the extent to which men and women within a country have distinct or overlapping emotional gender roles.
While Hofstede’s (1980) work has mostly examined cultural dimensions in the workplace (e.g., comparing answers from IBM employees across the world), his research has been applied in the field of HCI, for instance, to understand user adoption of technology (S.-G. Lee et al., 2013). However, there are only a few studies that explored these variables in the context of usability testing, including our study. In our study, we examined the impact of Individualism/Collectivism, Power Distance, and Uncertainty Avoidance. We did not consider the dimension of Masculinity/Femininity, as Dumetz and Cadil (2018) have demonstrated its lack of predictive validity for many cultures. We also did not consider the dimension of Time Orientation; our pilot study with two international students, one from Guatemala and one from India, indicated that this dimension was not relevant to our interested participant groups. In the following sections, we discuss examples of researchers who applied Individualism/Collectivism, Power Distance, and Uncertainty Avoidance to usability testing.
Cultural Variables in Usability Testing
Lee and Lee (2007) used three research methods—probe, usability tests, and focus groups—to compare the influence of Individualism/Collectivism in these contexts with participants from two countries: Korea (collectivist) and the Netherlands (individualist). They found that participants from the Netherlands showed greater engagement and elaborated more in their responses during the usability test and the focus group than participants from Korea. Moreover, participants from the Netherlands were more open to criticize the probe than participants from Korea, who did not complain but instead put the blame on their lack of experience. Wallace et al. (2013) examined correlation between Hofstede’s dimensions and usability attributes. They surveyed 144 participants from four countries—New Zealand, Philippines, Taiwan, and the USA—and asked about the importance they placed on the three usability attributes of cell phones, specifically effectiveness, efficiency, and satisfaction. They found that the five cultural dimensions were significantly correlated with efficiency and satisfaction but not with effectiveness. Participants’ preference for efficiency was influenced by the Power Distance index, and the attribute of satisfaction was preferred by the groups with short-term Time Orientation and weak Uncertainty Avoidance.
Vatrapu and Pérez-Quiñones (2006) explored the effect of Power Distance on participants’ responses during website usability testing. In this study, Indian students were assigned to one of the two groups. One group was interviewed by a local Indian interviewer and the other by an American interviewer. They found that participants provided more feedback and responded more freely when the interviewer was from their cultural background than when the interviewer was not from their cultural background, supposedly the cultural common ground mitigated the effect of Power Distance between participants and interviewers. Dell et al. (2012) also studied the response bias caused by the moderator. They found that participants preferred products more when the moderator was a foreign researcher rather than a local researcher. Lastly, Shi and Clemmensen’s (2008) study observed that participants from a low Power Distance country cared more about the nationality of moderators compared to participants from a high Power Distance country.
Cultural Variables in Other Research Methods
Some researchers have studied the role of these cultural dimensions in other research contexts. For instance, Figueroa et al. (2014) conducted a survey to compare the perception of ease of use and usefulness, compatibility, and trust and adoption intention toward e-government services between Spain and the United States. They found that Individualism did not affect the adoption of e-government and that Uncertainty Avoidance and Power Distance influenced trust toward e-government services. Spain scored a higher rank on these dimensions and showed greater trust toward e-government services than the United States. Similarly, Sonderegger and Sauer (2010) found a positive relationship between the aesthetics of a prototype and participants’ preference of a prototype: the more aesthetically pleasing a prototype looked, the more participants preferred a prototype. Lastly, Alexander et al. (2017) recruited people from three countries—Australia, China, and Saudi Arabia—to examine how culture influenced people’s preference for website design elements (e.g., layout, navigation, links, multimedia, visual representation). They found that countries with high Uncertainty Avoidance preferred clear navigation paths with limited interruptions and participants’ Collectivism/Individualism and Power Distance scores influenced their preference for a website’s visual representation.
Language Variables
Past literatures have also demonstrated the critical role a user’s linguistic background plays in shaping answer tendencies during usability testing. In the following sections we discuss some of these literatures.
Linguistic Variables in Usability Testing
Sun and Shi (2007) observed differences in the interactions between participants and moderators depending on the language spoken during the usability test. They tested different pairs of bilingual Chinese moderators and participants. When the moderator and the participant were speaking Chinese, the moderator took more time to introduce the project and gave more help and encouragement to the participants. When both were speaking English, the moderator and participants would make eye contact to make themselves understood, and the moderator would be more careful of the task list.
Singh et al. (2005) examined the role of linguistic variables in influencing preferences for interface designs. They found that preferences toward the level of white space, the number of hyperlinks, and the length of text varied between countries with different national languages. An explanation for this finding is that language is said to form an individual’s personality and opinions (Chen & Bond, 2010), which can powerfully influence their perceived usability of interfaces (Nantel & Glaser, 2008). This is why Hillier (2003) suggested that an interface should be built by a designer who speaks the same language as its users.
An interface with a translation feature can certainly be built by a designer who speaks different languages. This approach seems practical given that many leading companies are globalizing their services to attract users worldwide. However, most users are reluctant to use a translation feature on a website for various reasons. For instance, Vashistha et al. (2018) explored this matter in India and found that even when an interface provides tools to translate the settings and keyboard into their native language, the majority of users preferred to keep the interface in English. One reason was that some users did not know how to change the settings due to their low experience with the interface. Additional reasons were some users wanted to practice their English and found translation and keyboard tools too cumbersome to use. Other users stated that some English technical terms for mobile devices were considered standard, and they did not like how they were translated in their native language (e.g., “brightness” and “settings”). Some users thought they were losing the meaning of particular words once translated into their own language, and they feared missing out of important information. Calvet (2013) has explained this common situation with the term of vehicular language where individuals change language depending on a given context. Beyond the potential loss of a given word’s essential meaning, users who use a translation feature can suffer from many technical issues (e.g., inconsistent translation of words across different platforms), which severely deters their online experience (Majrashi et al., 2016). Hence, the ideal situation to foster positive user experience on a website would be to match the language spoken between a designer and a user, so that users do not lose access to key resources and services essential for their well-being and self-improvement (EF Education First, 2018).
In addition to website design, researchers who speak the same language as their users should develop survey questionnaires. Behr (2018) noted survey questionnaires usually come to a translator without any context. Words can have different meanings in different languages and, without context, the translator cannot appropriately translate questionnaires to obtain the expected answers. In support of this view, Finstad (2006) found that usability testers used words in a System Usability Scale (SUS; a popular measure to assess a user’s perception of a system’s usability) that were unfamiliar to second-language speakers. For instance, many non-native English speakers did not understand the word “cumbersome.” Furthermore, Yammiyavar et al. (2007) demonstrated that non-verbal cues displayed during usability testing (e.g., hand gestures) can have different meanings for users of different cultural backgrounds.
Altogether, these past literatures suggest that a user’s cultural and linguistic backgrounds can significantly influence how they respond and behave during research participation, with possible introduction of bias in interpreting study results and developing a study protocol. We now outline our study methods to explore our research question in context of usability testing.
Methods
To answer our research question, we designed a usability test to evaluate the Immigration, Refugee and Citizenship Canada’s (IRCC) website, specifically the application process for a postgraduate work permit. We grouped our participants based on their cultural backgrounds (China, India, and Nigeria) and also based on the language they used for the test (English or French). We presented them with a copy of the website and asked them to do some tasks, such as looking for links and navigating on a page. We conducted semi-structured interviews to talk about their experiences and asked them to complete a survey consisting of System Usability Scale (SUS; Finstad, 2006) and demographic information.
We conducted usability testing sessions between March 29, 2019 and May 23, 2019 and between September 24, 2019 and October 31, 2019. The first author (a white French-Canadian woman and fully proficient in English and French) conducted all sessions. The study lasted 30 minutes: Participants interacted with the website for the first 15 minutes and spent the last 15 minutes participating in a semi-structured interview and a survey. They received $10 (Canadian) as compensation for their time.
Participant Recruitment
We required participants drawn from populations with different cultural and linguistic backgrounds and recruited international students who were studying in Canada—international students from China, India, and Nigeria. They were the residents of countries in which they have different relationships with English, which was an important factor to help determine the linguistic group for our participants. In Nigeria, English is an official language. In India, English is not recognized as official, but it is spoken in many academic and professional institutions (Omidvar & Ravindranath, 2017). In China, English was recently institutionalized, and it is not as often spoken compared to Nigeria and India (Bolton & Graddol, 2012). According to the EF English Proficiency Index (EF Education First, 2018), which evaluates non-native English speakers’ English abilities, India and Nigeria have a moderate proficiency ranking of 28th and 29th while China has a low proficiency ranking of 47th. Moreover, these countries received different index scores in Hofstede’s dimensions for Individualism/Collectivism and Uncertainty Avoidance. However, they have a similar index score for Power Distance (Table 1). Nigeria has a higher Uncertainty Avoidance index score than the other two countries. India is more individualist than China and Nigeria (Hofstede et al., 2010). In addition, these international students were likely to have a similar experience with the IRCC’s website, having had to obtain a study visa, although our experiment tasks were unrelated to student visas. This similar experience can facilitate the same level of immersion from all participants to our study scenario. To explore cultural variables, we first conducted the study in English, focusing on international students from China, India, and Nigeria. To explore linguistic variables, we conducted the same usability test in French and thus recruited French-speaking international students but did not specify their country of origin.
Table 1. Hofstede’s Cultural Dimension Scores for China, India, and Nigeria
|
|
India |
China |
Nigeria |
|
Individualism/Collectivism (IDV) |
48 |
20 |
20 |
|
Power Distance (PD) |
77 |
80 |
77 |
|
Uncertainty Avoidance (UA) |
40 |
30 |
54 |
We recruited participants from two local universities and through social media (e.g., an international student group website). We asked participants, graduate administrators, and faculty to share the study’s recruitment materials with Indian, Nigerian, and Chinese international students and French-speaking international students. IRCC also sent out an email invitation to all local international students who fit our criteria.
In the end, we had a total of 53 international students in Canada: 39 were English-speaking, with 12 from China, 14 from India, 13 from Nigeria, while 14 were French-speaking. Either language could be spoken as a first or second language, and our recruitment materials indicated that participants must be comfortable in the language. French-speaking participants were from France (5), Morocco (3), Belgium (1), Brazil (1), Cameroon (1), Haiti (1), Mauritius (1), and Senegal (1). Throughout the rest of the paper, we refer to the English-speaking participants by their country of origin and the French-speaking participants by their language.
Table 2 lists the participants’ socio-demographic information.
Table 2. Participants’ Socio-Demographic Information
|
|
Male |
Female |
Mean Age |
English/French First Language |
English/French Second Language |
|
India (n=14) |
8 |
6 |
24.79 |
0 |
14 |
|
China (n=12) |
3 |
9 |
24.58 |
0 |
12 |
|
Nigeria (n=13) |
8 |
5 |
23.23 |
6 |
7 |
|
French (n=14) |
7 |
7 |
22 |
7 |
7 |
Usability Test: Procedure
Participants came to a study lab on their scheduled day and were seated in front of a computer. We instructed participants to navigate through the IRCC’s website from a home page[1] and guided them through different links. All participants received the same set of instructions and tasks where they had to fill out a questionnaire assessing eligibility for the work permit.
We gave the same scenario to participants that described a fictive persona named Anika, a student who was finishing her master’s degree at a Canadian University. We changed the persona’s nationality to match the nationality of our participants. This was done to make the scenario closer to what our participants would experience in real life, so participants would identify and adopt the persona’s goal as their own (Lazar et al., 2017). We provided participants with Anika’s information that was needed to complete a post-graduate work permit application (refer to the Appendix to view specific pages on the website visited by participants).
We introduced several provocations in our study scenario for two reasons: to elicit criticism of the website from our participants to better explore the dimension of Uncertainty Avoidance and to add an element of realism to the application experience. Our provocations included giving participants an incorrect link (student work permit instead of postgraduate work permit) and making participants go through an eligibility test for “Express Entry” for a future migrant (vs. eligibility for the work permit). In the eligibility test, participants navigated through a series of pages that asked eligibility-related questions (e.g., a type of language test that was taken in past, language scores), and they filled in Anika’s information (e.g., language scores on IELTS) provided by researchers. The eligibility test revealed Anika was not eligible for Express Entry and provided a few suggestions to improve her eligibility (e.g., “You may try to improve your language score or gain a higher level of education,” and “You may also consider applying directly to provinces and territories through the Provincial Nominee Program”). Afterwards, participants participated in a semi-structured interview and answered questions on a survey.
Usability Test: Survey
Participants completed a survey that had two parts: (a) socio-demographic questions including gender, age, education, nationality, languages spoken, and proficiency in English/French and (b) the System Usability Scale (SUS; 1 = Strongly disagree to 5 = Strongly agree; Finstad, 2006). We used the SUS to explore how participants’ cultural backgrounds influenced their answer tendencies on a Likert scale. We modified the original wording on the scale (i.e., “system” to “website”) to better reflect our study context. We excluded five questions from the scale (Q1, Q3, Q5, Q8, and Q10 on the original scale) because they did not apply to our specific study context. For instance, Q1 stated, “I think that I would like to use this system frequently.” However, international students do not use the IRCC’s website frequently, and this question was deleted, as it did not accurately reflect the normal experience of Canadian international students.
Usability Test: Semi-Structured Interview
We also conducted a semi-structured interview and asked participants nine questions. We developed each question to elicit comments related to three cultural and two language themes (which were developed a priori). We consulted a linguistic anthropologist professor and a woman and gender studies associate professor to develop these questions (see Figure 1 for all questions that researchers asked study participants). Interviews were audio-recorded.
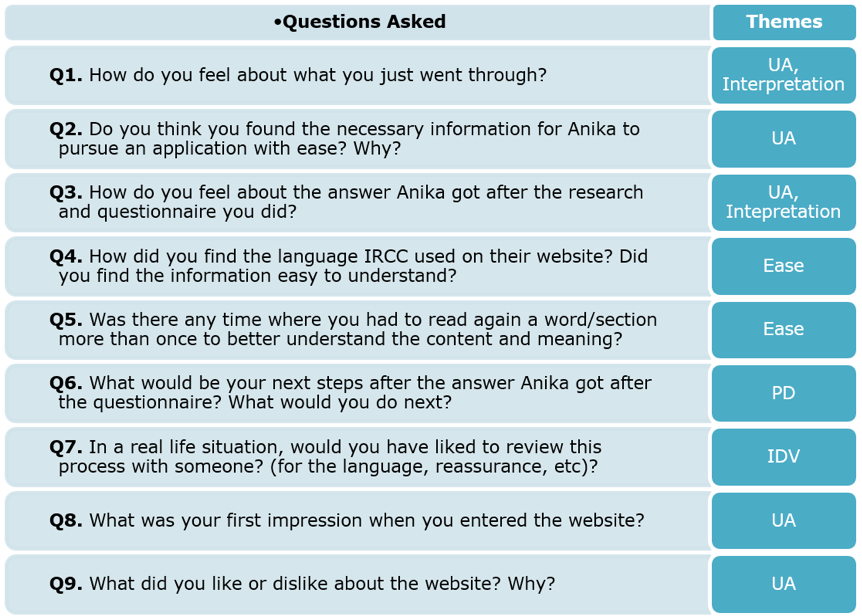
Figure 1. A list of questions asked in the study. Note: IDV = Individualism/Collectivism, PD = Power Distance, UA = Uncertainty Avoidance, Interpretation = Language Interpretation, and Ease = Language Ease.
Results
The following sections discuss results for analyzing the data in regards to the themes related to cultural and linguistic variables.
Data Analysis Approach: Themes Related to Cultural Variables
The first author manually transcribed the audio-recordings of participants’ responses from semi-structured interviews. Transcripts were anonymized before data analysis, and all identifying information was removed and changed. We conducted thematic analysis; we first developed our themes a priori using Hofstede’s theoretical framework (Hofstede et al., 2010). We then operationalized each theme based on his theoretical definitions and in the context of specific questions designed for each theme. The first author in consultation with the third author reviewed and revised the initial operationalization of themes by repeated readings of the transcripts and coded the transcripts accordingly using NVivo12 (QSR International Pty Ltd., 2019).
For the theme Individualism/Collectivism (IDV), we examined participants’ responses to Q7 and coded for Individualism, Collectivism, and Both. We coded Individualism when participants mentioned they preferred to navigate and do similar application processes online by themselves. We coded Collectivism when participants mentioned they would require and/or prefer assistance. We coded Both when participants referred to both concepts.
For the theme Power Distance (PD), we examined participants’ responses to Q6 and coded for high PDI and low PDI. We specifically adopted action coding techniques (Saldaña, 2016) where we first coded for verbs that were used by each participant in their responses. We then grouped the verbs that were meaningful and relevant to the study into the following four categories:
- “Follow instructions” where participants used verbs to indicate they would follow IRCC’s instructions (e.g., verbs such as “follow instructions” and “improve English score”).
- “Improve Skills” where participants used verbs to indicate they would take actions to improve their skills as suggested by IRCC (e.g., verbs such as “apply to a job” and “find job”).
- “Research” where participants used verbs to indicate they would do extra research using outside sources (e.g., verbs such as “read more” and “search information using Google”).
- “Ask” where participants used verbs to indicate they would ask for assistance (e.g., verbs such as “ask”).
We coded high PDI when participants used verbs that belonged to the first two groups (i.e., “Following instructions” and “Improve Skills”). We coded low PDI when participants used verbs that belonged to the latter two groups (i.e., “Research” and “Ask”).
For the theme Uncertainty Avoidance (UA), there were three codes: strong UA, weak UA, and Neutral. We coded strong UA when participants mentioned positive comments about the IRCC’s website; we coded weak UA when participants mentioned negative comments about the website; we coded Neutral when participants first mentioned a negative comment but immediately followed by a positive comment.
Data Analysis Approach: Themes Related to Linguistic Variables
Similarly, we operationalized themes and codes to capture participants’ experiences with language that was used in a usability test in response to four questions (Q1, Q3, Q4, and Q5). After the initial operationalization, the first author coded, refined, and elaborated themes and codes in the context of the data in consultation with the third author. For the theme Language Interpretation, we developed three codes—Opinion, Emotional, and Description— based on the three definitions of the verb “feel” (more details in the Results: Language Interpretations section).
For the theme Language Ease, we developed three codes: Easy, Comfortable, and Difficult. If participants commented that the language used in a usability test was easy to understand and did not have to reread words/sections, we coded them “Easy.” When participants commented that the language was hard to understand but did not have to reread words/sections, we coded them “Comfortable.” We also coded participants “Comfortable” when they found the language easy to understand but had to reread words/sections. Lastly, we coded “Difficult” for participants who mentioned the language was difficult to understand and had to reread words/sections. Table 3 lists each theme’s theoretical definition and each code’s description.
We adopted the interpretative view of reliability in coding (vs. a positivist view of reliability). Within this qualitative framework, coding is an evolving and organic process where there is no single objective truth in data. In contrast, a positivist framework, often adopted by quantitative researchers, views coding as the process of finding one accurate reality from a data set and thus defining reliability in terms of stability of findings across time and contexts (i.e., inter-rater reliability). In alignment with the qualitative framework, we define reliability in terms of the rich description of analytic procedure and plentiful descriptions of raw data obtained from study participants (Braun & Clarke, 2006; Yardley, 2000).
Table 3. A Summary of All Themes and Codes
|
Themes |
Codes |
Theoretical Definition |
Code Description |
|
Individualism/ Collectivism (IDV) |
Collectivism |
Interdependent self – High level on the IDV dimension. |
When a participant commented they preferred to navigate and do similar application process online by themselves (in response to Q7). |
|
|
Individualism |
Independent self – Low level on the IDV dimension. |
When a participant commented they would require or prefer assistance (in response to Q7). |
|
|
Both |
|
When a participant mentioned both previous concepts simultaneously (in response to Q7). |
|
Power Distance (PD) |
Large PD |
Subordinates are expected to be told what to do. |
When a participant followed the instructions and suggestions given by IRCC at the end of the navigation (in response to Q6). |
|
|
Small PD |
Subordinates are expected to be consulted. |
When a participant chose their own course of action (in response to Q6). |
|
Uncertainty Avoidance (UA) |
Strong UA |
Citizen protest should be repressed. |
When a participant expressed positive comments about the IRCC’s website and the navigation process (in response to Q1-Q3, Q8, Q9). |
|
|
Weak UA |
Citizen protest is acceptable. |
When a participant expressed negative comments about the IRCC’s website and the navigation process (in response to Q1-Q3, Q8, Q9). |
|
|
Neutral |
|
When a participant expressed a negative comment, followed by a positive comment (in response to Q1-Q3, Q8, Q9). |
|
Language Interpretation |
Opinion |
|
When a participant expressed an opinion toward some aspects in usability testing (in response to Q1, Q3). |
|
|
Emotional |
|
When a participant expressed an emotion toward some aspects in usability testing (in response to Q1, Q3). |
|
|
Description |
|
When a participant described a situation in usability testing (in response to Q1, Q3). |
|
Language Ease |
Easy |
|
When a participant found the level of English used on the IRCC website easy to understand and did not have to reread a word/section (in response to Q4, Q5). |
|
|
Comfortable |
|
When a participant found the level of English used on the IRCC website hard to understand but did not have to reread a word/section or when they found the level of English easy to understand but did have to reread a word/section (in response to Q4, Q5). |
|
|
Difficult |
|
When a participant found the level of English used on the IRCC website hard to understand and had to reread a word/section (in response to Q4, Q5). |
Results: The Influence of Cultural Background
In what follows, we present our findings for each of the three cultural dimensions analyzed. For each dimension, we present the themes in which we coded our references and compare the results between the three countries. From this comparison, we can identify which cultural groups have a higher or lower level for the dimension.
Individualism/Collectivism (IDV)
As can be seen in Figure 2, a higher percentage of Indian and Chinese participants expressed preference for assistance during a similar application process while a higher percentage of Nigerian participants preferred to do so on their own.
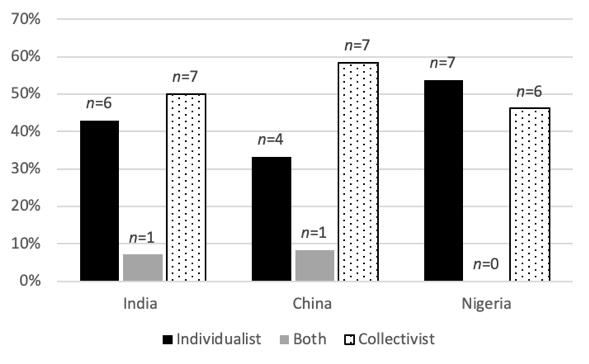
Figure 2. Percentage of individualist and collectivist participants, by country.
When asked whom they would like to review the process with, most participants indicated they would like assistance from someone who has more expertise using the website. P8 mentioned, “I will get a person who has experience, previous experience on here because maybe that person can help me to do something quickly.” Similarly, P7 mentioned, “I would first ask the person who’s already been through this, not to do it with them because I better learn things by myself… But I would ask for their suggestions and then I would consult it first and then maybe save it as a draft …”
This gives us insight into the usability of the IRCC’s website because our Indian and Chinese participants mentioned a need for assistance for the application process, referring both to the current real-life simulated experience and prior experiences like their student visa application. Participants who speak English as a second language may not be as confident to navigate the website on their own compared to native English-speaking participants (e.g., Nigerian participants), and our results highlight the need to address the user experience of this part of the IRCC’s website. A suggestion could be to improve guidance for users on how to navigate the website, available both in English and other languages, so that they can avoid the need for assistance. IRCC could consider incorporating a chatbot agent to fulfill their role as an expert who can guide users throughout the process.
Power Distance (PD)
In Figure 3, we compared the action coding between the three countries (see Table 3 for code descriptions). Indian participants indicated they would follow the instructions to a greater degree than Chinese and Nigerian participants, who said they would try alternatives during the application process such as searching for additional information on Google or social media. We observed that participants took different actions when given the same instructions on how to improve eligibility for Express Entry (e.g., “You may try to improve your language score”). While some followed the specific instructions given by IRCC, others did not follow these instructions: A few participants mentioned they would ask an agent to obtain additional assistance and stated they would try to get a job to obtain a higher score for their profile. For instance, P30 indicated they would follow the instructions given by the IRCC website, “I’ll use what they told me here to apply online. And I would use the reference code that was given here. I would also check for IELTS exams and how to improve my score.” In contrary, P14 expressed they would do extra information search on their own, “I don’t know like honestly like just go online and read more and like figure out what that federal program is with the provincial program.” This tells us that users should be given clear instructions on what they should do when they are not eligible so that they can pursue the application process with ease.
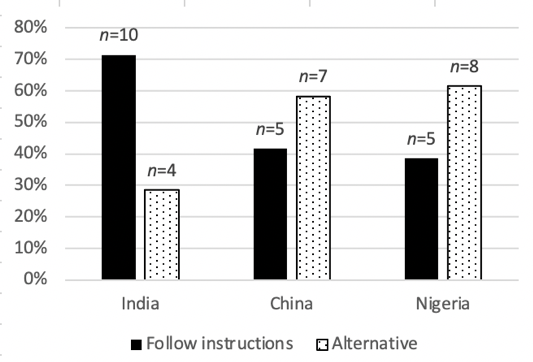
Figure 3. Percentage of participants who would follow instructions or choose an alternative, by country.
Uncertainty Avoidance (UA)
For this dimension, we discuss the number of references (i.e., the number of selections coded to a specific theme) as opposed to the number of participants; that is, a given participant’s responses can be coded multiple times for the same theme because they commented about the website in response to four different questions. As shown in Figure 4, Indian participants were the least critical of the IRCC’s website. They made more references coded for “No protest” than references coded for “Protest” or “Neutral.” When they did criticize, they mostly rationalized their thoughts and tried to identify a reason for this negative comment. For instance, P26 disliked how the website asked eligibility-related questions in separate pages but thought of a reason why IRCC might have designed the pages in such a way: “Features, I think what would I told in my first answer, what they can do, they can put all the formal questions in one page. That would save a lot of time. But I guess it’s because the next question depends on the previous answer that’s what I think, like it could be that. So that way they are doing this. What I like about this website is… I don’t know it’s not really I like something but it’s not really, but it was not bothering me.” On the other hand, Chinese and Nigerian participants were more critical of the website. They made more references coded for Protest than references coded for No protest and Neutral: “There’s a lot of stuff in there, but it’s like too much information for me so …” (P2).
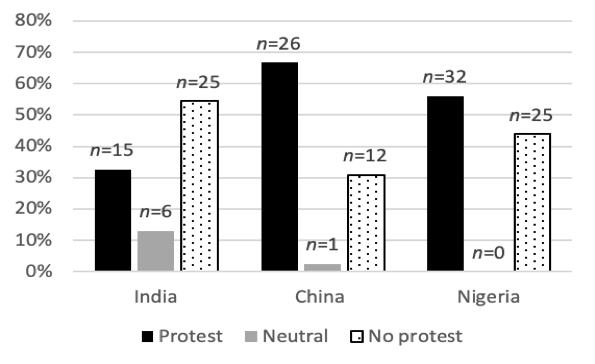
Figure 4. Percentage of references coded for Protest, Neutral, and No protest, by country.
Summary of Cultural Results
Our results showed the presence of cultural variables between the three countries. Nigerian participants were more individualist, and Indian and Chinese participants were more collectivist. Additionally, Chinese and Nigerian participants more often criticized the IRCC’s website. On the other hand, Indian participants criticized the website less and were more likely to follow the IRRC’s instructions to continue the application process compared to Chinese and Nigerian participants, who indicated they would take alternative steps on their own.
Results: The Influence of Linguistic Backgrounds
To explore the influence of linguistic backgrounds on answer tendencies, we compared French-speaking and English-speaking participants on the dimensions of Individualism/Collectivism, Power Distance, and Uncertainty Avoidance and also examined how different linguistic and cultural groups perceived the language used on the IRCC’s website.
Language Ease
We coded participants’ ease with the language used in the usability testing based on their answers to Q4 and Q5 (“How did you find the language?” and “Did you have to re-read a word or section to better understand it?”) and the three categories (Easy, Comfortable, or Difficult; see Table 3 for code descriptions). It was apparent in P27’s response that they found the language on the website hard to understand: “Like I know that initially like when we started entering information, I think it wasn’t as hard to like understand the language because it was kind of straight to the point although there were some parts like the NOC and stuff that I didn’t really understand.” P27 also had to re-read some parts: “I can’t really say on the top of my head but I’m pretty sure there were.” In contrast, P15 found the language on the website information easy to understand and did not have to re-read: “Yes, it’s like the normal people speaking English. It’s not so complex. Yeah, normal people can understand.” Lastly, P1, who was coded as Comfortable, found the information “easy to understand,” but they had to read again “for some questions … I couldn’t remember too many. Like maybe like how many years you’ve work experience or something like that. I think there is a very large section for explaining something. Like explaining the work experience so. It’s like pretty far away from the questions on the webpage so yeah it’s a little bit confusing.”
Figure 5 shows that participants who navigated the website in French had more ease in understanding the content than participants who navigated the website in English.
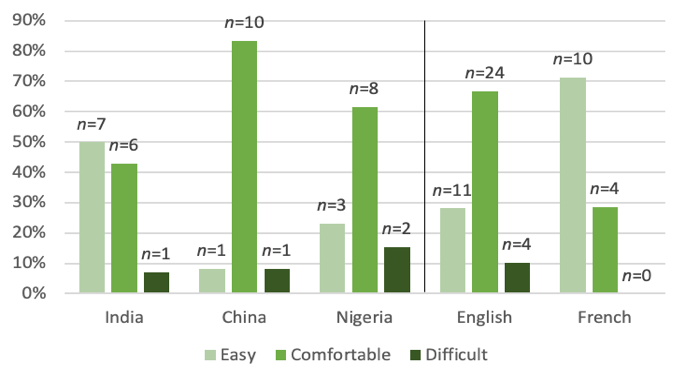
Figure 5. Language ease with website between countries and linguistic groups.
From these results, we see that linguistic variables can influence the results during usability testing. Indeed, we found that participants’ English and French proficiency did not necessarily indicate they would understand the level of the language used in the website and even in the study survey. When comparing Figure 5 with the language data from Table 2, we noticed the level of English based on participants’ first or second language did not correspond to their comfort level with the language used in the usability study. For instance, Indian participants, who all reported English as their second language, had more ease with English used by IRCC than Nigerian participants who reported English as their first language.
We observed the same pattern with non-native French speakers who had more ease with the French version of the IRCC’s website than our participants who reported French as their first language (Figure 6). These results indicate that researchers and designers cannot assume users coming from regions of high English or French proficiency would completely understand the language used during usability testing and the systems.
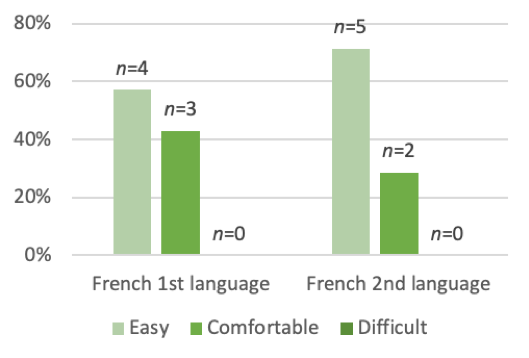
Figure 6. Ease of understanding French for native and non-native French speakers.
Individualism/Collectivism (IDV)
For all cultural and linguistic groups, except for Nigerian participants, a higher percentage of participants expressed preference toward having assistance during a similar application process (vs. wanting to do it alone; Figure 7).
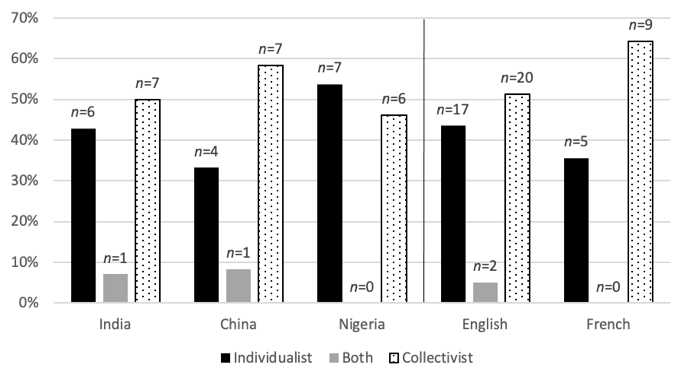
Figure 7. Individualism/Collectivism between countries and linguistic groups.
Power Distance (PD)
French-speaking participants indicated they would follow the instructions given by IRCC to pursue the application process to a greater extent than English-speaking participants (Figure 8). When looking at the individual country, we noticed that French-speaking and Indian participants appeared to have similar proportion of answers for this dimension. Chinese and Nigerian participants indicated they would choose to continue the application process with an alternative path over following the instructions.
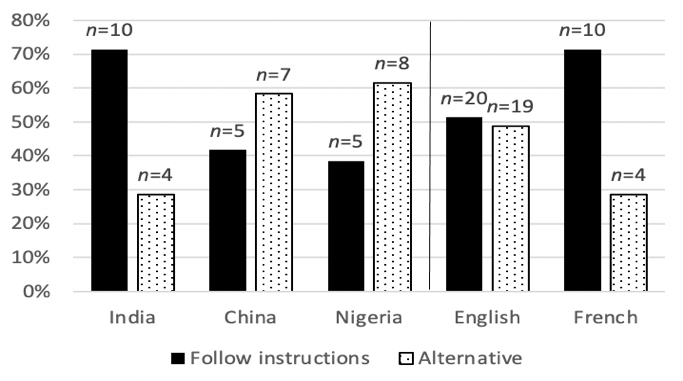
Figure 8. Power Distance between countries and linguistic groups.
Uncertainty Avoidance (UA)
A similar pattern emerged when we analyzed the dimension of Uncertainty Avoidance. French-speaking participants criticized the website less compared to English-speaking participants (Figure 9). Again, when dividing the results into their respective countries, French-speaking participants and Indian participants were similar in offering less criticism of the website, as opposed to Chinese and Nigerian participants who criticized the website more.
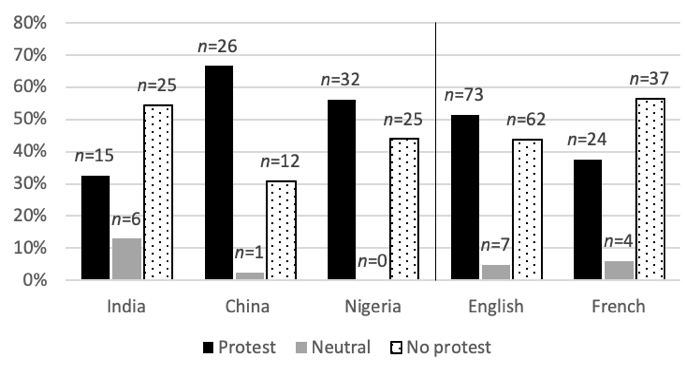
Figure 9. Uncertainty Avoidance between countries and linguistic groups.
Results: Answer Tendencies on the Likert Scale
To examine how cultural and linguistic backgrounds of a user influence their decision to choose extreme points or mid-points on a scale, we first calculated the number of times participants selected each number between 1 and 5 for each of the three countries (Figure 10). Chinese participants showed a mid-point answer tendency; these participants answered 2, 3, and 4 more often than the extreme points of 1 and 5. Indian participants avoided neutral answers, where they answered 3 less often than the four other options. It is hard to identify a pattern with our Nigerian participants as their answers were less clustered. This could potentially indicate that Nigerian participants answered the questions without having a necessarily strong opinion, they were not afraid to choose a neutral answer, or they cared less about providing a pleasing answer. For French-speaking participants, this group showed an extreme answer tendency as they answered 1 most frequently (but 5 least often). Lastly, when all put together, English-speaking participants’ responses were less clustered and did not display extreme or mid-point answer tendency.
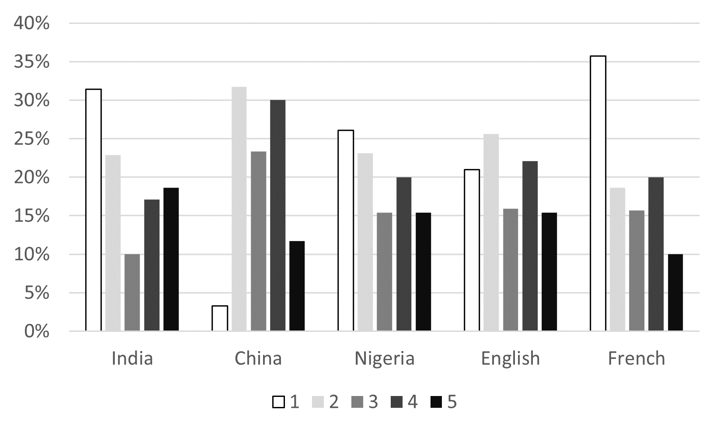
Figure 10. Frequency of each answer option on the Likert scale, by country and linguistic groups.
We also conducted one-way ANOVA and t-test with cultural groups and linguistic groups entered as an independent variable, and mean computed for each question on the SUS as a dependent variable. Using Bonferroni post-hoc comparisons, for cultural group comparison, we found that there was a significant difference between Chinese and Indian participants on Q3 and Q4, with the former scoring the highest mean and the latter scoring the lowest mean. Nigerian participants were not significantly different from these two groups, with their means placed at the middle. All three cultural groups were similar to each other on the rest of the questions (Table 4).
Table 4. One-Way ANOVA: Cultural Group Comparison
|
Questions |
Groups |
Mean & Standard Error |
F-statistic |
|
Q1. I felt very confident using this website. |
Indiaa |
4.07 (.29) |
F (2, 36) = 1.50, p > .05, partial η2 = .08 |
|
Chinaa |
3.33 (.31) |
||
|
Nigeriaa |
3.69 (.30) |
||
|
Q2. I would imagine that most people would learn to use this website very quickly. |
Indiaa |
3.86 (.35) |
F (2, 36) = .89, p > .05, partial η2 = .05 |
|
Chinaa |
3.25 (.38) |
||
|
Nigeriaa |
3.31 (.36) |
||
|
Q3. I thought there was too much inconsistency in this website. |
Indiaa |
1.64 (.28) |
F (2, 36) = 4.39, p < .05, partial η2 = .20 |
|
Chinab |
2.83 (.30) |
||
|
Nigeriaab |
2.00 (.29) |
||
|
Q4. I think that I would need assistance to be able to use this website. |
Indiaa |
1.93 (.33) |
F (2, 36) = 4.44, p < .05, partial η2 = .20 |
|
Chinab |
3.33 (.36) |
||
|
Nigeriaab |
2.23 (.35) |
||
|
Q5. I found this website unnecessarily complex. |
Indiaa |
1.93 (.35) |
F (2, 36) = 2.25, p > .05, partial η2 = .11 |
|
Chinaa |
3.00 (.37) |
||
|
Nigeriaa |
2.54 (.36) |
a b Groups with shared superscript were not statistically significant from each other on the item, while groups without shared superscript were statistically significant from each other on the item.
For linguistic group comparison, there was a significant difference between participants who took the usability test in English and French for Q3; English-speaking participants scored a higher mean than French-speaking participants (Table 5).
Table 5. T-test: Linguistic Group Comparison
|
Questions |
Groups |
Mean & Standard Error |
T-statistic |
|
Q1. I felt very confident using this website. |
English |
3.72 (.18) |
t (51) = 1.50, p > .05. |
|
French |
3.50 (.33) |
|
|
|
Q2. I would imagine that most people would learn to use this website very quickly. |
English |
3.49 (.21) |
t (51) = -.77, p > .05. |
|
French |
3.79 (.28) |
|
|
|
Q3. I thought there was too much inconsistency in this website. |
English |
2.13 (.18) |
t (51) = 1.96, p = .055. |
|
French |
1.50 (.17) |
|
|
|
Q4. I think that I would need assistance to be able to use this website. |
English |
2.46 (.31) |
t (51) = 1.48, p > .05. |
|
French |
1.86 (.31) |
|
|
|
Q5. I found this website unnecessarily complex. |
English |
2.46 (.21) |
t (51) = 1.50, p > .05. |
|
French |
1.86 (.22) |
|
Results: Language Interpretations
We examined how our participants interpreted the expression, “How do you feel about…?” In our interview, we had two questions starting with this expression (see Figure 1 for the list of questions; see Table 3 for code descriptions):
Q1. How do you feel about what you just went through?
Q3. How do you feel about the answer Anika got from the questionnaire?
Words and expressions can have different or multiple meanings when used in different languages (Behr, 2018). According to the Cambridge Dictionary (n.d.), the verb “feel” has two definitions in English:
- to experience something physical or emotional
- to have a particular opinion
According to the “Dictionnaire Français Larousse” (2020), the verb “sentir” (the French equivalent to “feel”) has three definitions in French:
- to smell something
- to experience something physical
- to know or perceive something
We coded participants’ answers according to these definitions. During the process of coding, we identified an additional interpretation of the questions which was a descriptive answer. We thus had three codes to analyze our participants’ answers: Opinion, Emotional, and Description. Because each participant had to answer two “How do you feel about…?” questions, we coded two references for each, which means we had 78 references in English and 28 in French. A majority of our participants provided an opinion (see Figure 11), and there was at least one participant from each group who answered the question with an emotion or a description of the task.
P6 expressed Opinion that the website could provide more specific instructions on what Anika could do to improve her eligibility: “It could be more clearer, like at least how the exact ways she can improve her status to apply for this permit. It just makes some suggestions like improve the language score or education, but it’s not very specific to her situation.” However, P8 expressed Emotion in response to Anika’s situation: “I am really sad about her. Like the website she cannot she doesn’t appear to be eligible but I think she can have other ways to get a visa maybe.” P17 provided Description of Anika’s situation: “She didn’t appear for the eligible express entry but she needs to improve the IELTS score as well as a higher education. Other way she can apply for the express entry by using the minimum criteria of express entry.”
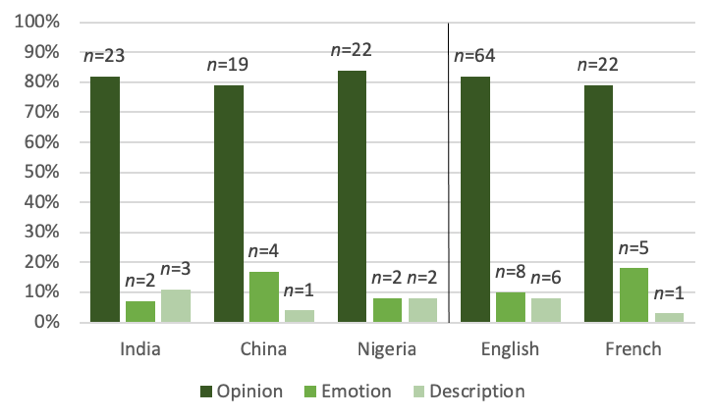
Figure 11. Interpretation of “feel” in English and French, by countries and linguistic groups.
Discussion
We studied cultural and linguistic variables in the context of usability testing with four groups of participants (English-speaking Chinese, Indian, and Nigerian participants and French-speaking participants). In response to our research question, we found that participants’ cultural and linguistic backgrounds powerfully shaped their answer tendencies during usability testing. In this section, we discuss the profiles of three countries and the insights these profiles provide regarding the role of cultural and linguistic variables in influencing user answer tendencies during usability testing. Following this, we make a connection between our results and the usability of the IRCC’s website.
Countries’ Profiles: Cultural Background and Usability Testing
We have identified differences between three countries in their response styles to semi-structured interviews and Likert scale questions. Indian participants provided the least critiques of the website. Our analysis revealed that they scored low on the dimension of Uncertainty Avoidance and scored low on the negative Likert scale question. Furthermore, they were at the most ease with English used by IRCC. They expressed that the initial navigation was tricky and that they needed to read more carefully to make sure they understood everything.
Our analysis suggests that Chinese and Nigerian participants have similar profiles: They preferred the website the least. Indeed, they were most critical of the website when we analyzed the dimension of Uncertainty Avoidance. Furthermore, China and Nigeria were the two countries for which we coded the most references of participants stating that they would follow the instructions when we asked them what they would do next following the IRCC’s questionnaire; this demonstrates a higher Power Distance. We found differences between these two countries on the dimension of Individualism/Collectivism. Nigeria was the most individualist country, while China was the most collectivist. When analyzing answer tendencies on a Likert scale, Chinese participants showed a mid-point tendency, but Nigerian participants did not have a particular tendency on the Likert scale, which could indicate their attempt to please a researcher.
We also observed interesting cultural and linguistic group mean differences on the SUS’s Q3 and Q4 questions. Q4 addressed participants’ standing on Individualism/Collectivism. Our qualitative analysis revealed that a higher percentage of Chinese and Indian participants expressed preference toward having assistance during a similar application process (Figure 7). Based on this, one would expect both cultural groups to have similar means on Q3. But our quantitative analysis revealed that Chinese participants had the highest mean on this question, and Indian participants had the lowest mean, with Nigerian participants placed in the middle. This finding suggests that participants’ responses to similar questions asked during semi-structured interviews and the Likert scale could be different, and participants may be more cautious with their responses during an in-person usability test (Grimm, 2010; Sauer et al., 2019).
Furthermore, Q3 assessed participants’ negative attitude toward the website, and our quantitative analysis indicated that English-speaking participants criticized the website more than French-speaking participants (Figure 9). This finding parallels with our qualitative finding on these two linguistic groups’ differences on Uncertainty Avoidance. Similarly, for cultural group comparisons, we found that Chinese participants had the highest mean on this question, followed by Nigerian participants and Indian participants, corroborating our qualitative finding indicating that Indian participants criticized the website less compared to other cultural groups.
Lastly, we did not observe the influence of cultural and linguistic backgrounds for other questions on SUS (i.e., Q1, Q2, and Q5). That is, different cultural and linguistic groups were not significantly different from each other on these questions. These findings imply that users’ cultural and linguistic backgrounds can influence how they respond to a certain set of questions asked in usability testing (e.g., questions on Collectivism/Individualism and a website’s inconsistency) but not for other set of questions (e.g., questions on a user’s confidence level).
Altogether, these findings imply researchers and practitioners should ask participants similar questions in diverse formats (e.g., survey and semi-structured interview) to verify the validity of their responses and observe how and why their responses diverge on some of the questions. Also, they should be mindful that a particular set of questions may be more likely to be subjected to the influence of users’ cultural and linguistic backgrounds.
Linguistic Backgrounds and Usability Testing
We found that Indian participants had more ease than Chinese and Nigerian participants with the style of English used by IRCC (Figure 5). One would expect Nigerian participants to find the website’s English easier because they reported English as their first language. Interestingly, they also had more references criticizing the website than complementing. We had similar results when analyzing the ease of language for French-speaking participants. Indeed, participants with French as a second language had more ease with the language of the website compared to participants with French as a first language. One explanation for these non-counterintuitive results could be the way English and French are taught to non-native speakers. The lexicon used in language classes may look more similar to the lexicon used by IRCC or other Canadian government documentation/websites. We also found that participants who spoke more than two languages had more ease in understanding the IRCC’s language. This may be related to having more experience with different lexicons. Some participants across all groups also mentioned that their ease with the language increased with their familiarity with the website.
Regarding the interpretation of “How do you feel…?” questions, most of our participants in both language groups interpreted the questions as asking for an opinion. We had a few participants who interpreted the question differently and answered by describing their feelings or by giving a description of what they did. This is in line with Calvet’s (2013) work that explained words can have different meanings in different languages. Future research should avoid terms with multiple meanings and use more precise terms, like “think,” in this case, or “What is your opinion?” instead of “How do you feel?” This is a good reminder that researchers should be careful with their use of words when developing interview and survey questions. They need to make sure that they are using words and expressions that explicitly state what the researchers are looking for in their questions and potentially provide definitions of words and expressions to establish a common understanding.
Our findings shed insights into the usability of the IRCC’s website. We found that Indian and Chinese participants expressed a need for assistance for the application process, and website users who speak English as a second language may not be as confident to navigate the website on their own compared to native English-speaking users. This particular finding highlights the need to address the user experience of this part of the IRCC’s website. A suggestion could be to improve the guidance for the user on how to navigate the website and to make the information available in both English and other languages, so that they can avoid the need for assistance. IRCC could consider incorporating a chatbot agent to fulfill their role as an expert who can guide users throughout the process. Also, the IRCC website may provide alternative information sources for users who might not want to follow its instructions on improving their work permit eligibility, especially for users of Chinese and Nigerian backgrounds. These two cultural groups were more critical of the IRCC website, which may highlight that the website is not as user-friendly as the designers of the website from IRCC might think. This finding relates to Hillier’s (2003) discussion about the bias of designers who intentionally or unintentionally bring in their own cultural and linguistic backgrounds during the designing process and thus might not satisfy the targeted users from different countries.
Limitations
Our study is limited by the number of countries from which we recruited English-speaking participants; the countries represented all had similar index scores for Power Distance and for Uncertainty Avoidance. Also, as we did not divide French-speaking participants by country, we were unable to characterize their cultural variables. We also recognize that our participants achieved a higher education level than most applicants for residency in Canada (Lu & Hou, 2015). This level of education could have biased the results because, as graduate students, they may find it easier to understand complex situations and hence had more ease with navigating the webpage.
Our results did not take into consideration the cultural diversity within each country. For instance, multiple languages are spoken within India (Omidvar & Ravindranath, 2017). We also did not focus on other socio-demographic variables such as the gender identities of our participants or socio-economic statuses but acknowledge that these elements could have influenced the results (Zhang et al., 2017). We also acknowledge that we did not consider the previous experience of our participants navigating this website. Relatedly, our results should be situated in the context of the possibility that our own intersecting identities interacted with participants’ backgrounds. The first author conducted all study sessions, and her unique cultural and linguistic background and gender identity may have operated independently and jointly to influence study participants’ behaviors and answer tendencies during the study.
Lastly, our sample consisted of participants from younger age groups (see Table 2), and researchers should be cautious in generalizing our results to older age groups. Past research has shown age-related differences in usability testing. For instance, Chadwick-Dias et al. (2003) found that older adults gave more positive ratings of a website compared to younger participants. Similarly, Chun and Patterson (2012) found that older adults showed slower task completion and blamed themselves (vs. interface features) more than younger adults. Given this, one can conclude that younger and older participants’ different life experiences interact with their linguistic and cultural backgrounds to influence their responses during usability testing. Our findings on the differences and similarities between cultural groups and between linguistic groups in usability testing could be attenuated or magnified among participants with different age groups.
Conclusion
This study is one of the few studies that examined the role of cultural and linguistic variables during usability testing using Hofstede’s three cultural dimensions. Our findings inform user experience researchers of these potential biases. We invite future researchers to explore cultural and linguistic variables with other countries, as well as looking at the influence of these variables in other usability contexts. Additional work is crucial to expand the analysis of people’s cultural and linguistic backgrounds to address the gap in usability evaluations.
Tips for User Experience Researchers and Practitioners
We make six recommendations for experience practitioners and researchers to consider attenuating these cultural and linguistic differences to ensure the consistency, reliability, and reproducibility of research and usability testing protocols and results.
- Develop questions to direct participants to criticize more or to ask for feedback on specific aspects of the website instead of general questions such as “How did you find the website?” Because the objective of usability testing is to find all potential issues, having more specific questions can mitigate the pleasing answer and the neutral answer tendencies.
- Help users understand that researchers want their honest thoughts on a given task and they would not suffer any negative consequences for their responses. These instructions can de-motivate users displaying particular answer tendencies (e.g., mid-point tendencies), especially users from China and India and users who speak French.
- Use diverse formats to ask similar questions (e.g., interviews and surveys or interviews and observations) for the purpose of verification and clarification. Be aware that certain questions may be more subjected to the impact of users’ cultural and linguistic backgrounds.
- Use basic and clear terms, plain language, in questionnaires and surveys given during usability tests to improve the consistency and reproducibility of testing protocols and results. This will help diminish potential linguistic bias when participants have different levels of English or when usability tests are reproduced in different languages.
- Consider analyzing the data by separating cultural groups to isolate for cultural tendencies in their responses.
- Be aware of cultural and linguistic biases when reporting results and when recreating a usability test with a different cultural group of users, as words have different meanings in different languages (Calvet, 2013).
Acknowledgements
This work was supported and funded by the National Sciences and Engineering Research Council of Canada (NSERC) through the Collaborative Learning in Usability Experiences Create grant (2015-465639), as well as by a contract from the Client Experience Branch (CEB) from Immigration, Refugee and Citizenship Canada to support the establishment of usability testing best practices within, focusing on the influence of linguistic and cultural factors on usability testing results. We thank IRCC for providing us with this research problem and supporting the recruitment of some of our participants.
References
Alexander, R., Murray, D., & Thompson, N. (2017). Cross-cultural web usability model. Web Information Systems Engineering-WISE (Lecture Notes in Computer Science), 10570, 75–89. https://doi.org/10.1007/978-3- 319-68786-5_6
Behr, D. (2018). Translating questionnaires for cross-national surveys: A description of a genre and its particularities based on the ISO 17100 categorization of translator competences. Translation and Interpreting, 10(2), 5–20. https://doi.org/10.12807/ti.110202.2018.a02
Bolton, K., & Graddol, D. (2012). English in China today. English Today, 28(3), 3–9. https://doi.org/10.1017/s0266078412000223
Braun, V., & Clarke, V. (2006). Using thematic analysis in psychology. Qualitative Research in Psychology, 3(2), 77–101. https://doi.org/10.1191/1478088706qp063oa
Calvet, L.-J. (2013). La sociolinguistique (8th ed.). Presse universitaire de France.
Cambridge Dictionary. (n.d.). Feel.
Chadwick-Dias, A., McNulty, M., & Tullis, T. (2003). Web usability and age. Proceedings of the 2003 Conference on Universal Usability (CCU’03), 30–37. https://doi.org/10.1145/957205.957212
Chen, S. X., & Bond, M. H. (2010). Two Languages, Two Personalities? Examining Language Effects on the Expression of Personality in a Bilingual Context. Personality and Social Psychology Bulletin, 36(11), 1514–1528. https://doi.org/10.1177/0146167210385360
Chun, Y. J., & Patterson, P. E. (2012). A usability gap between older adults and younger adults on interface design of an Internet-based telemedicine system. Work, 41(SUPPL.1), 349–352. https://doi.org/10.3233/WOR-2012-0180-349
Clemmensen, T., & Qingxin, S. (2008). What is part of a usability test? Extended Abstracts of the 2018 CHI Conference on Human Factors in Computing Systems, 3603–3608. https://doi.org/10.1145/1358628.1358898
Dell, N., Vaidyanathan, V., Medhi, I., Cutrell, E., & Thies, W. (2012). “Yours is Better !” Participant Response Bias in HCI. Proceedings of the 2012 CHI Conference on Human Factors in Computing Systems (CHI ’12), 1321–1330. https://doi.org/10.1145/2207676.2208589
Duh, H. B.-L., & Chen, V. H.-H. (2007). Emerging Issues in Doing Cross-Cultural Research in Multicultural and Multilingual Societies. In Usability and Internationalization (pp. 65–73). Springer Berlin Heidelberg. https://doi.org/10.1007/978-3-540-73287-7_9
Dumetz, J., & Cadil, J. (2018). Challenging the Masculinity Index: the End of a Cross-Cultural Myth. International Journal of Social Sciences, VII(1), 49–68. https://doi.org/10.20472/SS2018.7.1.004
EF Education First. (2018). Ef Epi 2018. https://www.ef.com/__/~/media/centralefcom/epi/downloads/full-reports/v8/ef-epi-2018-english.pdf
Finstad, K. (2006). The System Usability Scale and Non-Native English Speakers. Journal of Usability Studies, 1(4), 185–188.
Grimm, P. (2010). Social Desirability Bias. In Wiley International Encyclopedia of Marketing. John Wiley & Sons, Ltd. https://doi.org/10.1002/9781444316568.wiem02057
Hillier, M. (2003). The role of cultural context in multilingual website usability. Electronic Commerce Research and Applications, 2(1), 2–14. https://doi.org/10.1016/S1567-4223(03)00005-X
Hofstede, G. (1980). Motivation, leadership, and organization: Do American theories apply abroad? Organizational Dynamics, 9(1), 42–63. https://doi.org/10.1016/0090-2616(80)90013-3
Hofstede, G., Hofstede, G. J., & Minkov, M. (2010). Cultures and Organizations Software Of The Mind (Rev. 3rd ed.). In Cultures and Organizations. McGraw-Hill Education.
Karusala, N., Vishwanath, A., Vashistha, A., Kumar, S., & Kumar, N. (2018). “Only if you use English you will get to more things.” Proceedings of the 2018 CHI Conference on Human Factors in Computing Systems – CHI ’18, 1–14. https://doi.org/10.1145/3173574.3174147
Kim, Y., Chung, S., & Hample, D. (2019). How do Culture, Individual Traits, and Context Influence Koreans’ Interpersonal Arguing? Toward a More Comprehensive Analysis of Interpersonal Arguing. Argumentation, 0123456789. https://doi.org/10.1007/s10503-019-09482-2
Larousse. (2020). Définitions : Sentir.
Lazar, J., Feng, J., & Hochheiser, H. (2017). Research Methods in Human-Computer Interaction. In Research Methods in Human-Computer Interaction (2nd ed.). Morgan Kaufmann.
Lee, J.-J., & Lee, K.-P. (2007). Cultural differences and design methods for user experience research: Dutch and Korean Participants Compared. Proceedings of the 2017 Conference on Designing Pleasurable Products and Interfaces (DPPI’07), 21–34. https://doi.org/10.1145/1314161.1314164
Lee, S.-G., Trimi, S., & Kim, C. (2013). The impact of cultural differences on technology adoption. Journal of World Business, 48(1), 20–29. https://doi.org/10.1016/j.jwb.2012.06.003
Lewis, J. R. (2007). Sample Sizes For Usability Tests: Mostly Math, Not Magic. Interactions, 13(6), 29–33. https://doi.org/10.1145/1167948.1167973
Lu, Y., & Hou, F. (2015). Insights on Canadian Society International students who become permanent residents in Canada. https://www.statcan.gc.ca/pub/75-006-x/2015001/article/14299-eng.htm
Majrashi, K., Hamilton, M., & Uitdenbogerd, A. L. (2016). Cross-platform cross-cultural user experience. Proceedings of the 30th International BCS Human Computer Interaction Conference: Fusion!, 1–13. https://doi.org/https://doi.org/10.14236/ewic/HCI2016.20
McCrae, R. R., & Terracciano, A. (2005). Personality Profiles of Cultures: Aggregate Personality Traits. Journal of Personality and Social Psychology, 89(3), 407–425. https://doi.org/10.1037/0022-3514.89.3.407
Molich, R., & Dumas, J. S. (2004). Comparative usability evaluation. Behaviour and Information Technology, 27(3), 263–281. https://doi.org/10.1080/01449290600959062
Nantel, J., & Glaser, E. (2008). The impact of language and culture on perceived website usability. Journal of Engineering and Technology Management, 25(1–2), 112–122. https://doi.org/10.1016/j.jengtecman.2008.01.005
Omidvar, R., & Ravindranath, B. K. (2017). Position of English in India: Three-way Categorization. Language in India, 17(5), 279–288.
QSR International Pty Ltd. (2019). NVivo (No. 12). https://www.qsrinternational.com/nvivo-qualitative-data-analysis-software/home
Reinecke, K., & Bernstein, A. (2013). Knowing What a User Likes: A Design Science Approach to Interfaces that Automatically Adapt to Culture. MIS Quarterly, 37(2), 427–453. https://doi.org/10.25300/MISQ/2013/37.2.06
Rose, E. J., Björling, E. A., Kim, A., & Alvarez, N. Y. (2018). Usability testing with teens. Proceedings of the 36th ACM International Conference on the Design of Communication (SIGDOC’18), 18, 1–6. https://doi.org/10.1145/3233756.3233955
Rufín, R., Bélanger, F., Molina, C. M., Carter, L., & Figueroa, J. C. S. (2014). A Cross-Cultural Comparison of Electronic Government Adoption in Spain and the USA. International Journal of Electronic Government Research, 10(2), 43–59. https://doi.org/10.4018/ijegr.2014040104
Saldaña, J. (2016). The Coding Manual for Qualitative Researchers (Third ed.). SAGE Publications Ltd.
Sauer, J., Sonderegger, A., Heyden, K., Biller, J., Klotz, J., & Uebelbacher, A. (2019). Extra-laboratorial usability tests: An empirical comparison of remote and classical field testing with lab testing. Applied Ergonomics, 74, 85–96. https://doi.org/10.1016/j.apergo.2018.08.011
Schirra, S., & Allison, C. (2018). “I know what the companies are wanting more of.” Extended Abstracts of the 2018 CHI Conference on Human Factors in Computing Systems (CHI ’18), 1–6. https://doi.org/10.1145/3170427.3188681
Shi, Q., & Clemmensen, T. (2008). Communication patterns and usability problem finding in cross-cultural thinking aloud usability testing. Proceeding of the 26th Conference on Human Factors in Computing Systems (CHI ’08), 2811–2816. https://doi.org/10.1145/1358628.1358766
Singh, N., Zhao, H., & Hu, X. (2005). Analyzing the cultural content of web sites, A cross-national comparision of China, India, Japan, and US. International Marketing Review, 22(2), 129–146. https://doi.org/10.1108/02651330510593241
Sonderegger, A., & Sauer, J. (2010). The influence of design aesthetics in usability testing: Effects on user performance and perceived usability. Applied Ergonomics, 41(3), 403–410. https://doi.org/10.1016/j.apergo.2009.09.002
Sonderegger, A., Schmutz, S., & Sauer, J. (2015). The influence of age in usability testing. Applied Ergonomics, 52, 291–300. https://doi.org/10.1016/j.apergo.2015.06.012
Spool, J., & Schroeder, W. (2001). Testing Web Sites : Five Users Is Nowhere Near Enough. Extended Abstracts of the 2019 CHI Conference on Human Factors in Computing Systems, 285–286. https://doi.org/10.1145/634067.634236
Sun, X., & Shi, Q. (2007). Language Issues in Cross Cultural Usability Testing: A Pilot Study in China. Proceedings of the 2nd International Conference on Usability and Internationalization (UI-HCII’07), 274–284.
Treasury Board of Canada Secretariat. (2020). Canada.ca Content Style Guide. https://www.canada.ca/en/treasury-board-secretariat/services/government-communications/canada-content-style-guide.html
Vashistha, A., Okeke, F., Anderson, R., & Dell, N. (2018). “You Can Always Do Better!”: The Impact of Social Proof on Participant Response Bias. Proceedings of the 2018 CHI Conference on Human Factors in Computing Systems (CHI ’18), 1–13. https://doi.org/10.1145/3173574.3174126
Vatrapu, R., & Pérez-Quiñones, M. A. (2006). Culture and Usability Evaluation: The Effects of Culture in Structured Interviews. Journal of Usability Studies, 1(4), 156–170.
Wallace, S., Reid, A., Clinciu, D., & Kang, J. S. (2013). Culture and the importance of usability attributes. Information Technology and People, 26(1), 77–93. https://doi.org/10.1108/09593841311307150
Yammiyavar, P., Clemmensen, T., & Kumar, J. (2007). Analyzing Non-verbal Cues in Usability Evaluation Tests. Proceedings of the 2nd International Conference on Usability and Internationalization (UI-HCII’07), 462–471.
Yardley, L. (2000). Dilemmas in qualitative health research. Psychology and Health, 15(2), 215–228. https://doi.org/10.1080/08870440008400302
Zhang, Q., Li, C., Zhang, C., & Wang, K. (2017). An Investigation on Online Shopping Behaviors in the Singles Day. Proceedings of the International Conference on Business and Information Management (ICBIM’ 17), 29–33. https://doi.org/10.1145/3134271.3134278
Appendix
The following are the web pages on the IRCC website that study participants visited. (Access from https://www.canada.ca/en/immigration-refugees-citizenship.html.)
Figure 1A. Home page for the IRCC.
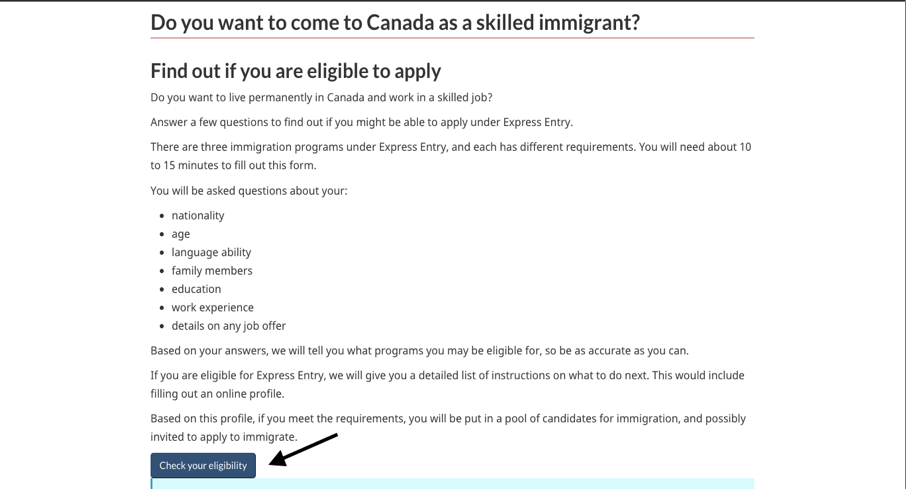
Figure 2A. Eligibility information.
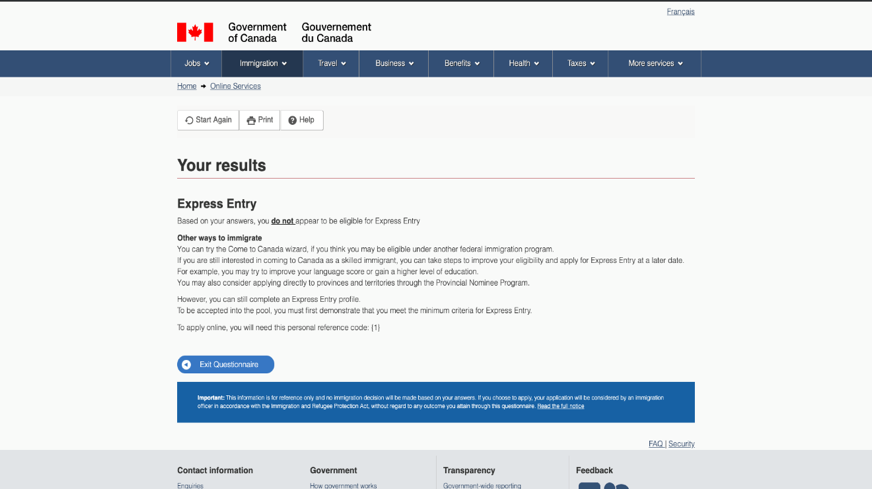
Figure 3A. Express Entry page.
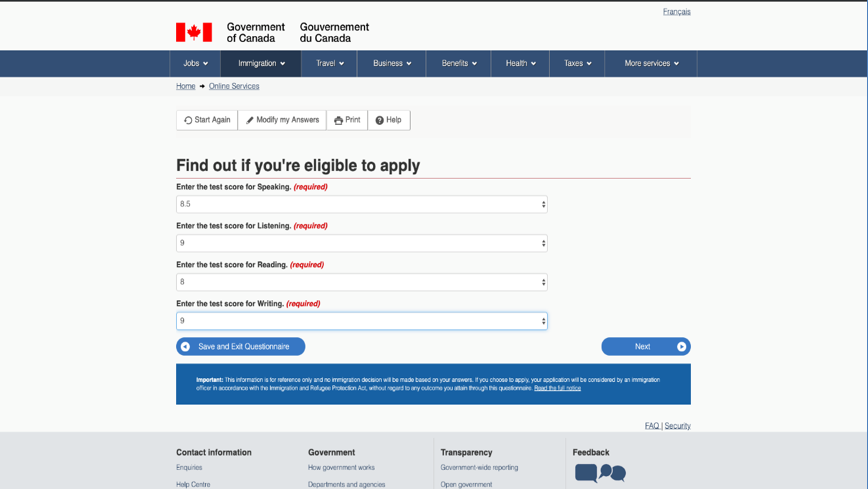
Figure 4A. Eligibility for application.
[1] https://www.canada.ca/en/immigration-refugees-citizenship.html
[:]