
Abstract
Online usability testing has long been of interest to usability engineers and designers. Previous studies found that online tests are as good as lab tests in measuring user performance, but not in finding usability problems. However, little is known about measuring the hedonic quality of user experience, such as joy, beauty, and attractiveness, in online tests. In this study, we conducted a systematic empirical comparison between lab and online testing using AttrakDiff, a validated semantic differential scale that measures pragmatic and hedonic quality of user experience. In our study, 32 participants were divided into three groups: lab testing with moderators, lab testing without moderators, and online testing. The participants performed tasks on a prototype of a cryptocurrency application and evaluated the prototype using the AttrakDiff questionnaire. The results showed a significant difference between lab and online tests in hedonic quality, but no difference was found in pragmatic quality. The difference was only between lab and online tests; the presence or absence of moderators in the lab tests did not produce any significant difference. We also found that the participants in online tests offered longer and more detailed free-comment feedback than the participants in lab tests. These results indicate a possible difference between lab and online tests concerning the measurement of the hedonic quality of user experience, as well as the prospect of using online tests to get rich user feedback.
Keywords
online usability testing, remote
testing, web-based testing, user experience, evaluation
Introduction
Usability testing has traditionally been conducted in a usability lab, but it is not the only way; web technology enables us to conduct a usability study remotely. Reaching users beyond the usability lab has been a topic of interest over the past 20 years (Andreasen, Nielsen, Schrøder, & Stage, 2007; Hartson, Castillo, Kelso, & Neale, 1996). Especially, unmoderated and asynchronous testing over the Internet is expected to reduce the cost and effort of usability testing, while reaching larger and more diverse participant populations. We refer to such testing as online usability testing, following the definition by Albert, Tullis, and Tedesco (2009).
Many researchers explored the effectiveness of online usability testing by comparing the results of lab and online tests. Most studies focused on performance metrics, such as task success rate and time on task, or issue-based metrics, which is about identifying the design problems that can harm the usability of the products. With regard to performance metrics, online tests demonstrated results akin to those of lab tests (Tullis, Fleischman, McNulty, Cianchette, & Bergel, 2002). With regard to issue-based metrics, studies found that online tests failed to find as many usability problems as lab tests (Andreasen et al., 2007; Bruun, Gull, Hofmeister, & Stage, 2009; Scholtz & Downey, 1999; Steves, Morse, Gutwin, & Greenberg, 2001; Winckler, Freitas, & de Lima, 2000). So far, it would be fair to say that online tests are as good as lab tests in measuring user performance, but not in finding problems.
However, little is known about measuring the non-pragmatic aspects of user experience, such as joy, beauty, and attractiveness, in online testing. The focus of human-computer interaction has shifted from usability to user experience since around 2000 (MacDonald & Atwood, 2013), as the importance of the aspects beyond the traditional usability metrics became recognized (Hassenzahl, 2003; Hassenzahl & Tractinsky, 2006; Tractinsky, Katz, & Ikar, 2000). Hassenzahl (2001) named such aspects as “hedonic” quality, as opposed to the “pragmatic” quality of the traditional usability perspective (the recent essay by Hassenzahl (2018) gives a good overview about how this concept developed).
Many researchers now attempt to measure such aspects in user experience (Bargas-Avila & Hornbaek, 2011), and some imply the needs of online testing. For example, Lallemand and Koenig (2017) indicated that the unnatural settings of lab testing could affect the perceived user experience, suggesting the needs for more ecological settings. Moreover, the importance of longitudinal studies is getting attention (Kujala, Roto, Väänänen-Vainio-Mattila, Karapanos, & Sinnelä, 2011), and some researchers are attempting to measure the longitudinal user experience remotely using online questionnaires (Varsaluoma & Sahar, 2014; Walsh et al., 2014). Considering these facts, it is important to know the possibilities and limitations of measuring hedonic quality of user experience in online testing.
In this study, we used AttrakDiff (www.attrakdiff.de) to compare the results of lab and online tests. AttrakDiff is an empirically validated user experience questionnaire that measures both pragmatic and hedonic quality (Hassenzahl, Burmester, & Koller, 2003). Our hypothesis is that hedonic quality is susceptible to different conditions, as they are subtle human feelings related to both “self-oriented” and “others-oriented” aspects (Hassenzahl, 2008). In other words, hedonic quality includes social factors. Conducting tests in a usability lab with moderators might produce different results than when conducting online tests without any interaction with moderators because of biases such as experimenter effects (Rosenthal, 1966), social desirability bias (King & Bruner, 2000; White & McBurney, 2009), and Hawthorne effect (Payne & Payne, 2004).
Methods
We conducted controlled user experience tests in lab and online situations using the same product prototype and the same questionnaire. In addition, we divided the lab tests into two groups, with the presence of moderators and without. The purpose of this additional distinction was to see if the results would be affected by the mere presence (or absence) of other people.
Study Design
The study employed a between-subjects design. The independent variable was the condition of usability test: (A) lab test with moderators, (B) lab test without moderators, and (C) online test. The dependent variables were the scores of the AttrakDiff questionnaire. We compared each of the four AttrakDiff categories: PQ, HQ-I, HQ-S, and ATT (the details of each category are discussed below). We also collected free-text comments as supplemental data.
Participants
We conducted the study with 32 university students (17 male and 15 female), aged between 18 and 35. Groups A and B (lab test groups) consisted of 10 participants, and Group C (online test group) consisted of 12 participants. All participants spoke English fluently, though their cultural backgrounds were diverse, and English was not the first language for most of them. Participants in Groups A and B were randomly recruited in the university cafeteria or classrooms. We carefully avoided friends and acquaintances as it might have affected the results. Participants in Group C were recruited via email. The email was sent to a broad list of students via the university mailing list. The participants joined voluntarily, and none of them received any compensation.
Procedure
The tests of Groups A and B were conducted in the university’s usability lab, while Group C’s tests were conducted online. All the participants performed the same tasks using the same prototype on the same webpage. The moderators in the lab tests did not give oral instruction; all the instructions were written on the webpage in all the groups. The participants of Groups A and B used a laptop provided by the moderators. Group C’s participants used their own laptop or desktop PC.
Group A: Lab testing—with the presence of moderators
Group A’s test was conducted in the usability lab. Two test moderators were in the room and welcomed each participant. After giving basic instructions about how to proceed with the test, one moderator sat beside a participant and observed while the participant performed the tasks and filled out the questionnaire. When asked questions, the moderator encouraged the participants to read the instructions to figure out the answer by themselves.
Group B: Lab testing—without the presence of moderators
Group B’s test was conducted in the usability lab. Two test moderators were in the room and welcomed each participant. After giving basic instructions about how to proceed with the test, the moderators left the room and waited in the room next door. Each participant performed the tasks and filled out the questionnaire alone in the room. After finishing the questionnaire, the participants knocked on the door and let the moderators know it was finished.
Group C: Online testing—without the presence of moderators
Group C’s test was conducted online, without any moderator intervention. Group C participants read the email that provided basic instructions about how to proceed with the test, then performed the tasks and filled out the questionnaire alone at home or in the university.
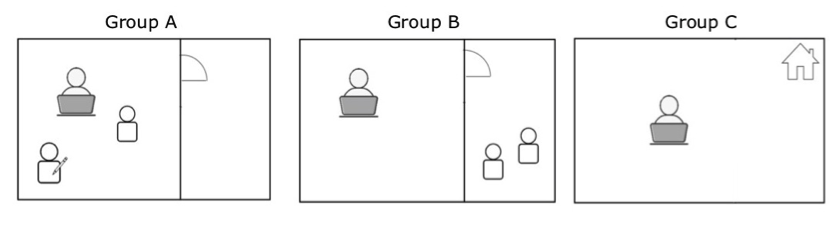
Figure 1. Test
settings for each group.
Test Material and Tasks
We used a prototype of a cryptocurrency mobile application. The prototype was created using InVision (https://www.invisionapp.com/), a popular prototyping tool for web and mobile designers. We embedded the prototype into a webpage, with task instructions shown next to the prototype (see Figure 2). The participants were asked to (1) sign in, (2) see the transaction history, (3) check a transaction detail, (4) see the summary screen of different currencies, (5) check the market, (6) return to the summary screen, (7) open the bitcoin transfer screen, (8) input the receiver information, and (9) send the bitcoin and see the success status displayed on the screen. These tasks were provided to guide the participants to navigate through the prototype, not to measure task-based metrics. Therefore, no time limit was specified, and the participants were allowed to skip some tasks when necessary. After finishing the tasks, the participants proceeded to the questionnaire form via the link in the instructions.
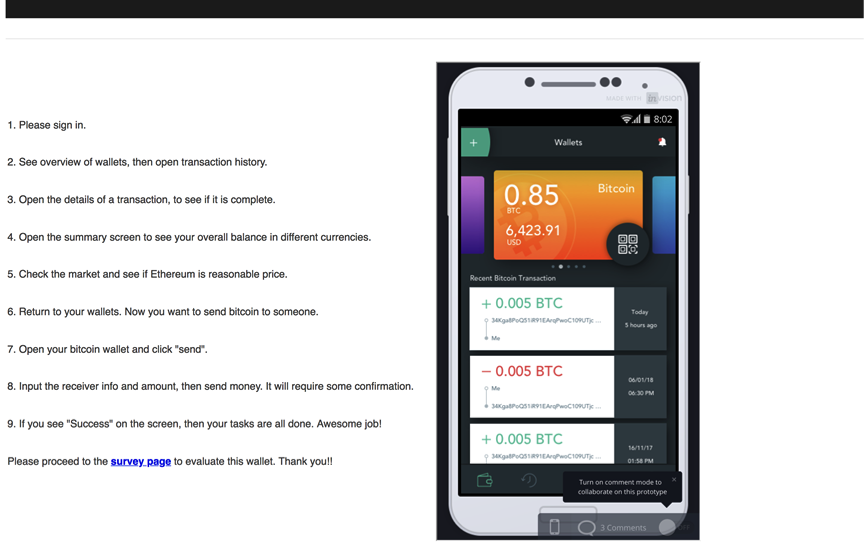
Figure 2. Screenshot of the test screen, showing the prototype and the task instructions.
Evaluation Materials
We used the English version of the AttrakDiff questionnaire for the evaluation of the prototype. AttrakDiff is a validated semantic differential scale that measures pragmatic and hedonic quality of user experience (Hassenzahl et al., 2003). It is one of the most frequently used user experience questionnaires apart from self-developed questionnaires (Bargas-Avila & Hornbaek, 2011). AttrakDiff consists of four categories: PQ, HQ-I, HQ-S, and ATT. PQ stands for pragmatic quality, which is the traditional usability aspects related to the effectiveness and efficiency of the product. HQ-I stands for hedonic quality: identity, which is related to the self-image or self-expression of users when they use the product. HQ-S stands for hedonic quality: stimulation, which is related to the perceived stimulation or excitement of the product usage. ATT stands for general attractiveness.
AttrakDiff is suitable for online testing, with its sophisticated web interface and management functionalities. But we did not use the official AttrakDiff website because the website displayed the German version of the questionnaire by default, even when we selected English in the language settings. Instead, we implemented the AttrakDiff questionnaire using Google Forms. By using Google Forms, we avoided the risk that some participants would use the German version instead of the English one, adding noise to the results. We verified our implementation of the questionnaire by inputting the results to the AttrakDiff website and confirming that both questionnaires produced the same results. In addition to the AttrakDiff word-pairs, we added an open question and a few demographic questions at the end of the questionnaire, which were not mandatory. The open question was asked as follows: “Please write freely if you have any opinions or advice about the app.”
Results
We have organized the results around the following questions:
- Were the AttrakDiff scores reliable enough?
- Did the AttrakDiff scores in the lab and online tests differ significantly? If so, which categories differed—pragmatic quality or hedonic quality?
- Were the pragmatic quality and hedonic quality independent enough? What were the correlations between AttrakDiff categories?
- Did the free-text comments differ between the groups?
Reliability of AttrakDiff Results
The HQ-I scores of Groups A and B had low reliability, with a Cronbach’s alpha of 0.61 and 0.62, respectively. Group C’s HQ-I scores were higher, with a Cronbach’s alpha of 0.81. Considering the low reliability, we refrained from combining HQ-I and HQ-S into HQ, a united hedonic quality used in the AttrakDiff portfolio analysis. PQ, HQ-S, and ATT all had relatively high reliability (Cronbach’s alpha between 0.72 and 0.91), though some items showed low or even negative correlations.
AttrakDiff Scores Comparison
Figure 3 shows the distribution of AttrakDiff scores for each category in each group. We tested the data for normality and homogeneity of variance, and we found that the HQ-I scores in Group B had a non-normal distribution (W = 0.80, p < 0.05). Considering this in addition to the small sample sizes, we decided to conduct non-parametric multiple comparisons using the Kruskal-Wallis test, followed by multiple pairwise comparisons using the Dunn’s test with Bonferroni adjustment. As seen in Table 1, the HQ-S scores differed significantly between the groups, H(2) = 8.47, p = 0.01, while PQ, HQ-I, and ATT didn’t differ between groups. Dunn’s test showed that HQ-S in Group C differed significantly from Groups A (Z = 2.41, p = 0.02) and B (Z = 2.55, p = 0.02), while no significant difference was found within the lab tests, between Groups A and B (Z = -0.13, p = 1.0).
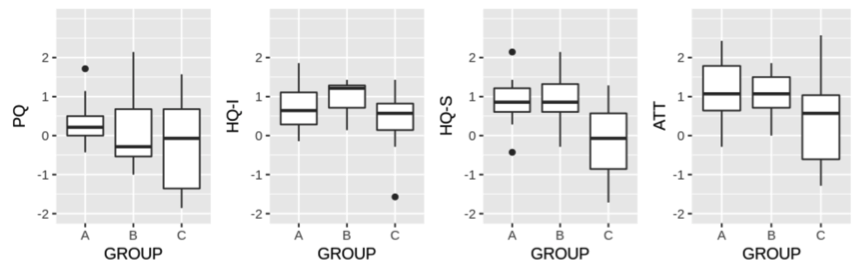
Figure 3. Distribution
of PQ, HQ-I, HQ-S, and ATT scores in each group.
Table 1. Mean Rank of Each Group and the Results of Kruskal-Wallis Test
|
|
Mean rank: Group A |
Mean rank: Group B |
Mean rank: Group C |
H (df = 2) |
p-value |
|
PQ |
19.6 |
15.95 |
14.38 |
1.75 |
0.42 |
|
HQ-I |
15.65 |
20.9 |
13.54 |
3.51 |
0.17 |
|
HQ-S |
19.95 |
20.5 |
10.29 |
8.47 |
0.01* |
|
ATT |
18.85 |
19 |
12.46 |
3.58 |
0.17 |
Note. Alternative hypothesis: The mean ranks are different between groups.
* p < 0.05
Correlations Between Categories
Table 2 shows the inter-scale correlations (Kendall’s Tau) in each group. Each group showed a slightly different tendency, but we can see that PQ and HQ-I were strongly correlated in Groups A and C. The correlations between HQ-I and HQ-S were weak, although they are both meant to be measuring hedonic quality. ATT was significantly correlated with HQ-I and HQ-S in Group A, while in Groups B and C it was strongly correlated with PQ.
Table 2. Inter-Scale Correlations in Each Group (Kendall’s Tau)
|
PQ |
HQ-I |
HQ-S |
ATT |
||
|
Group A |
PQ |
1.00 |
|||
|
HQ-I |
0.73 |
1.00 |
|||
|
HQ-S |
0.40 |
0.39 |
1.00 |
||
|
ATT |
0.63 |
0.81* |
0.71* |
1.00 |
|
|
Group B |
PQ |
1.00 |
|||
|
HQ-I |
0.31 |
1.00 |
|||
|
HQ-S |
-0.30 |
0.47 |
1.00 |
||
|
ATT |
0.72* |
0.58 |
0.21 |
1.00 |
|
|
Group C |
PQ |
1.00 |
|||
|
HQ-I |
0.58 |
1.00 |
|||
|
HQ-S |
0.08 |
0.47 |
1.00 |
||
|
ATT |
0.90** |
0.69* |
0.32 |
1.00 |
* p < 0.05, ** p < 0.01
Free-Text Comment Results
Many participants answered the optional open question to offer feedback about the prototype. Although the issue-based approach was not the main focus of this study, there appears to be some difference between groups in the responses to the question. The numbers of participants who responded to the open question were as follows: five in Group A (50%), eight in Group B (80%), and eight in Group C (67%). Group C participants gave the longest responses (average 115.25 words), while the responses in Group B were shorter (average 46.13 words) and Group A were the shortest (average 20.8 words). The responses from Group A were not very specific, mostly regarding the complexity of the application. The responses from Group B were more specific, mentioning problems such as confusing icons, lack of tutorial, and the busyness of the screen. The responses from Group C were the most informative, succeeding in identifying problems that are specific to the cryptocurrency application. Furthermore, some participants in Group C evaluated the prototype in comparison with other cryptocurrency applications.
Discussion
The following sections discuss the difference found between the lab tests and online tests, the problems of low correlation and reliability in the AttrakDiff results, and the implications of the free-text comments that might endorse the effectiveness of online user feedback.
Lab Tests vs. Online Tests
We found some similarities and differences between the results of the lab and online tests using the AttrakDiff questionnaire. The results of PQ were similar in both lab and online tests. In contrast, we found a significant difference in the HQ-S scores, between lab and online tests. We refrained from combining HQ-I and HQ-S into HQ, the unified hedonic quality, because the HQ-I scores lacked reliability in Groups A and B.
Overall, the results supported our hypothesis to some extent, showing the hedonic quality being susceptible to different test conditions. Also, the results suggested that one can get similar results from lab and online tests when measuring pragmatic quality of user experience.
The two conditions within the lab testing did not produce any significant difference, which means that the mere presence or absence of moderators did not explain the difference between lab and online tests. A possible factor that explains the difference is the characteristics of participants. The lab test participants could have been more agreeable people, who were not bothered by going to a usability lab during the work day. On the other hand, the online test participants could have been more independent and confident about evaluating a cryptocurrency application, as they actively chose to participate in the study without being asked in person.
Another possible factor is the anonymity of the online testing. While most online participants provided optional demographic information, the online test was more anonymous than the lab tests, where the moderators welcomed participants. Therefore, the participants in online test could have been relatively unbiased by politeness or social desirability, while the lab test participants (regardless of the presence or absence of moderators) might have been affected by such social aspects. It is also possible that the condition of online testing allowed the participants to perform the tasks in everyday situations (e.g., at home on the sofa), helping them to evaluate the prototype in a genuine way and to recall the memories of using other applications in similar situations that might have given them some reference points. While it is still a matter of speculation, revealing the exact factors of the difference could help to improve the accuracy of user experience evaluation in future studies.
Validness of AttrakDiff Results
The AttrakDiff results were not clear, with mixed correlations between the categories and the low reliability in HQ-I. The original paper that validated AttrakDiff showed independence of the PQ category, with moderate correlation between HQ-I and HQ-S (Hassenzahl et al., 2003). However, our study showed higher correlation between PQ and HQ-I than the correlation between HQ-I and HQ-S, in two conditions (Groups A and C). Usually, the AttrakDiff results are interpreted by combining HQ-I and HQ-S as HQ, but our study results were not suitable to do that because of the unclear correlations and the unacceptably low reliability in HQ-I.
A likely cause of the problem is translation; we used the English version of AttrakDiff that might not have been as reliable as the original German version even though it was the official translation. One of the word pairs that showed low correlation within a category was “undemanding – challenging.” The word “challenging” here is meant to be a favorable characteristic that makes the product engaging, but it can be interpreted differently; “challenging” in English can be an unfavorable characteristic which ruins the ease of use. We also need to mention that many participants were not native speakers of English, although they speak and study in English on a daily basis. Some participants in Group A complained that some words were confusing to them.
Implications of Free-Text Comments
Contrary to the previous studies, we found that the online test participants gave richer feedback than the lab test participants. This finding is limited, as the usability problems in Group A were not fully recorded with observations or oral responses. We can assume that the difference was partly because Group A participants gave some oral feedback while performing the tasks, although we did not use the think-aloud method or conduct interviews. With this in mind, the amount and quality of the feedback from the online testing group were still notable. The participants gave long and informative feedback, and a few participants gave specific advice based on their knowledge of cryptocurrency technology and experience in using similar applications. Although we did not filter the participants by background knowledge or interests, we might have been able to reach people who were closer to the target users of the cryptocurrency application. If such were the case, online testing could help reach the right population even in a small-scale study.
Study Limitations
Our study had some limitations. Firstly, the sample sizes were rather small, 10 to 12 participants. But these are realistic numbers, considering that many usability studies are conducted with a small number of participants, typically 10 or fewer (Albert et al., 2009; Nielsen, 2000). Besides, AttrakDiff sets the maximum number of participants to 20 (unless one uses a premium plan). We ensured the statistical validity by adopting non-parametric statistical tests that are known to be robust against small sample sizes. Further studies with larger samples would help obtain more statistically powerful results.
Secondly, this study does not tell the exact factor that caused the observed differences. We cannot decide whether it was the location or the characteristics of the participants that led to the different results, as we did not methodologically balance out the participants’ characteristics between groups (though all the participants were rather homogenous in age, education, and occupation). This was because we tried to avoid bias in the recruiting process itself, but it allowed ambiguity in interpretation. Now that we observed some differences between lab and online tests, the next step would be to identify the exact factors that affected the results. Within-subjects study with more controlled conditions would help determine the exact factors, and additional qualitative data including post-study interviews would provide further insights.
Lastly, the AttrakDiff scores were not as reliable as expected, and the independence of pragmatic and hedonic quality was unclear. It questions the validity of measurement, casting doubt on precisely what aspects of user experience were measured in the questionnaire. Measuring hedonic quality of user experience is a relatively young endeavor, and we should collect more data to update the tools and establish more reliable user experience metrics.
Conclusion
We conducted a systematic empirical comparison between lab and online usability testing using the AttrakDiff semantic differential scale. The aim of this study was to understand the similarities and differences between lab and online testing, focusing on the hedonic quality of user experience that was not explored in previous studies. As we expected, the AttrakDiff results differed significantly between lab and online tests in hedonic quality, while no difference was found in pragmatic quality. It suggests that hedonic quality, which is the focus of many recent user experience studies, is more susceptible to differences in test conditions than pragmatic quality. It does not tell, though, what exactly caused the differences. It might have been the characteristics of participants or some bias related to the lab situations. Further studies with more controlled conditions would provide a clearer understanding.
Another finding was that online test participants provided more detailed feedback in the free-text question, contrary to the previous studies. It is not clear why the online participants offered more detailed feedback, but online recruiting with a broadcast email might have been effective in finding suitable participants for specific products than recruiting participants in person.
Lastly, the AttrakDiff results were not reliable in one category, and the independence of pragmatic and hedonic scales was doubtful. We must examine and improve the questionnaire to get more valid and reliable results, which would let us proceed to more powerful and detailed analysis. As mentioned previously, AttrakDiff is one of the most frequently used validated questionnaires in user experience studies; still, it showed some unclear results in our study. This fact suggests the difficulty of acquiring solid results in user experience questionnaires. As Bargas-Avila and Hornbaek (2011) indicated, many user experience studies use self-developed questionnaires without providing statistical validations. That should be avoided because it brings the validity of user experience studies into question.
Overall, this study revealed the possible gap between lab and online testing in regard to measuring the hedonic quality of user experience. It suggests that practitioners and researchers should consider the differences in test conditions to acquire valid results, especially when they compare the results from multiple tests. We would like to explore more details about the effectiveness and limitations of online testing, as well as the accurate measurement of user experience, in order to improve human-centered design methods and to offer better user experience.
Tips for Usability Practitioners
The following are the tips and recommendations from our study of online user experience testing:
- Minimize the differences in test conditions when you measure the hedonic quality of user experience, especially when you compare the results from the tests conducted in different time or circumstances. For example, if you conduct the initial tests in the lab and the following tests online, the results could differ due to the test conditions instead of the change of user experience.
- Use a validated questionnaire whenever possible. It might be safer to validate it beforehand, even if you use a validated one. A translated questionnaire should be treated carefully as the results could differ from the original version.
- Consider online testing when you conduct usability tests without formal screening processes to improve the probability of finding suitable participants. In our study, the online test participants seemed to have offered longer open-end feedback than the lab participants. Broadening the recipients of the recruiting email might help finding participants with suitable knowledge and skills to evaluate your products.
Acknowledgements
We would like to thank Mr. Jai Singh Champawat and Ms. Sonali Arjunbhai Mathia for conducting lab tests, Ms. Pimchanok Sripraphan for letting us use the prototype, Ms. Sabine Lauderbach for advising on statistics, and Prof. Dr. Kai Essig for giving feedback to the drafts of this paper.
References
Albert, W., Tullis, T., & Tedesco, D. (2009). Beyond the usability lab: Conducting large-scale online user experience studies. Burlington, MA, USA: Morgan Kaufmann.
Andreasen, M. S., Nielsen, H. V., Schrøder, S. O., & Stage, J. (2007, April). What happened to remote usability testing?: An empirical study of three methods. In Proceedings of the SIGCHI Conference on Human Factors in Computing Systems (pp. 1405–1414). ACM.
Bargas-Avila, J. A., & Hornbæk, K. (2011, May). Old wine in new bottles or novel challenges: A critical analysis of empirical studies of user experience. In Proceedings of the SIGCHI Conference on Human Factors in Computing Systems (pp. 2689–2698). ACM.
Bruun, A., Gull, P., Hofmeister, L., & Stage, J. (2009, April). Let your users do the testing: A comparison of three remote asynchronous usability testing methods. In Proceedings of the SIGCHI Conference on Human Factors in Computing Systems (pp. 1619–1628). ACM.
Hartson, H. R., Castillo, J. C., Kelso, J., & Neale, W. C. (1996, April). Remote evaluation: The network as an extension of the usability laboratory. In Proceedings of the SIGCHI Conference on Human Factors in Computing Systems (pp. 228–235). ACM.
Hassenzahl, M. (2001). The effect of perceived hedonic quality on product appealingness. International Journal of Human-Computer Interaction, 13(4), 481–499.
Hassenzahl, M. (2003). The thing and I: Understanding the relationship between user and product. In M. A. Blythe, K. Overbeeke, A. F. Monk, & P. C. Wright (Eds.), Funology: From usability to enjoyment (pp. 31–42). Springer, Dordrecht.
Hassenzahl, M. (2008, September). User experience (UX): An experiential perspective on product quality. In Proceedings of the 20th Conference on l’Interaction Homme-Machine (pp. 11–15). ACM.
Hassenzahl, M. (2018). A personal journey through user experience. Journal of Usability Studies, 13(4), 168–176.
Hassenzahl, M., Burmester, M., & Koller, F. (2003). AttrakDiff: Ein Fragebogen zur Messung wahrgenommener hedonischer und pragmatischer Qualität. In Mensch & Computer 2003 (pp. 187–196). Vieweg+ Teubner Verlag.
Hassenzahl, M., & Tractinsky, N. (2006). User experience-a research agenda. Behaviour & Information Technology, 25(2), 91–97.
King, M. F., & Bruner, G. C. (2000). Social desirability bias: A neglected aspect of validity testing. Psychology & Marketing, 17(2), 79–103.
Kujala, S., Roto, V., Väänänen-Vainio-Mattila, K., Karapanos, E., & Sinnelä, A. (2011). UX Curve: A method for evaluating long-term user experience. Interacting with Computers, 23(5), 473–483.
Lallemand, C., & Koenig, V. (2017). Lab testing beyond usability: Challenges and recommendations for assessing user experiences. Journal of Usability Studies, 12(3), 133–154.
MacDonald, C. M., & Atwood, M. E. (2013, April). Changing perspectives on evaluation in HCI: Past, present, and future. In CHI’13 extended abstracts on human factors in computing systems (pp. 1969–1978). ACM.
Nielsen, J. (2000). Why you only need to test with 5 users. Retrieved July 2018 from https://www.nngroup.com/articles/why-you-only-need-to-test-with-5-users/
Payne, G., & Payne, J. (2004). Key concepts in social research. Sage Publishing.
Rosenthal, R. (1966). Experimenter effects in behavioral research. East Norwalk, CT, USA: Appleton-Century-Crofts.
Scholtz, J., & Downey, L. (1999). Methods for identifying usability problems with web sites. In S. Chatty & P. Dewan (Eds.), Engineering for human-computer interaction (pp. 191–206). Boston, MA: Springer.
Steves, M. P., Morse, E., Gutwin, C., & Greenberg, S. (2001, September). A comparison of usage evaluation and inspection methods for assessing groupware usability. In Proceedings of the 2001 International ACM SIGGROUP Conference on Supporting Group Work (pp. 125–134). ACM.
Tractinsky, N., Katz, A. S., & Ikar, D. (2000). What is beautiful is usable. Interacting with computers, 13(2), 127–145.
Tullis, T., Fleischman, S., McNulty, M., Cianchette, C., & Bergel, M. (2002, July). An empirical comparison of lab and remote usability testing of web sites. In Proceedings of Usability Professionals Association Conference.
Varsaluoma, J., & Sahar, F. (2014, November). Measuring retrospective user experience of non-powered hand tools: An exploratory remote study with UX curve. In Proceedings of the 18th International Academic MindTrek Conference: Media Business, Management, Content & Services (pp. 40–47). ACM.
Walsh, T., Varsaluoma, J., Kujala, S., Nurkka, P., Petrie, H., & Power, C. (2014, November). Axe UX: Exploring long-term user experience with iScale and AttrakDiff. In Proceedings of the 18th International Academic MindTrek Conference: Media Business, Management, Content & Services (pp. 32–39). ACM.
Winckler, M. A., Freitas, C. M., & de Lima, J. V. (2000, April). Usability remote evaluation for WWW. In CHI’00 Extended Abstracts on Human Factors in Computing Systems (pp. 131–132). ACM. White, T. L., & McBurney, D. H. (2009). Research methods. Cengage Learning.