
Abstract
The System Usability Scale (SUS) is an inexpensive, yet effective tool for assessing the usability of a product, including Web sites, cell phones, interactive voice response systems, TV applications, and more. It provides an easy-to-understand score from 0 (negative) to 100 (positive). While a 100-point scale is intuitive in many respects and allows for relative judgments, information describing how the numeric score translates into an absolute judgment of usability is not known. To help answer that question, a seven-point adjective-anchored Likert scale was added as an eleventh question to nearly 1,000 SUS surveys. Results show that the Likert scale scores correlate extremely well with the SUS scores (r=0.822). The addition of the adjective rating scale to the SUS may help practitioners interpret individual SUS scores and aid in explaining the results to non-human factors professionals.
Practitioner’s Take Away
This research examined the addition of an adjective rating scale to the System Usability Scale (SUS) and found the following:
- The SUS is an effective, reliable tool for measuring the usability of a wide variety of products and services.
- The 0 to 100 scale is intuitive to understand, yet raises many questions about what a single SUS score means in an absolute sense.
- Analysis of nearly 1,000 SUS scores has shown that an adjective rating is highly correlated with SUS scores.
- The addition of an adjective rating scale to the SUS can help practitioners interpret individual SUS scores, and aid in explaining the results to non-human factors professionals.
- The SUS score associated with the mid-point adjective of OK is consistent with previous adjective rating scale research, but the connotation of OK may suggest an acceptable product. We present alternative adjectives that have similar ratings but that suggest a more accurate connotation of the product’s actual usability.
- Using a letter grade scale in lieu of an adjective scale could be an alternate way to understand the absolute meaning of a SUS score.
Introduction
There are numerous surveys available to usability practitioners to aid them in assessing the usability of a product or service. Many of these surveys are used to evaluate specific types of interfaces, while others can be used to evaluate a wider range of interface types. The System Usability Scale (SUS) (Brooke, 1996) is one of the surveys that can be used to assess the usability of a variety of products or services. There are several characteristics of the SUS that makes its use attractive. First, it is composed of only ten statements, so it is relatively quick and easy for study participants to complete and for administrators to score. Second, it is nonproprietary, so it is cost effective to use and can be scored very quickly, immediately after completion. Third, the SUS is technology agnostic, which means that it can be used by a broad group of usability practitioners to evaluate almost any type of user interface, including Web sites, cell phones, interactive voice response (IVR) systems (both touch-tone and speech), TV applications, and more. Lastly, the result of the survey is a single score, ranging from 0 to 100, and is relatively easy to understand by a wide range of people from other disciplines who work on project teams.
Bangor, Kortum, and Miller (2008) described the results of 2,324 SUS surveys from 206 usability tests collected over a ten year period. In that study, it was found that the SUS was highly reliable (alpha = 0.91) and useful over a wide range of interface types. The study also concluded that while there was a small, significant correlation between age and SUS scores (SUS scores decreasing with increasing age), there was no effect of gender. Further, it was confirmed that the SUS was predictive of impacts of changes to the user interface on usability when multiple changes to a single product were made over a large number of iterations. Other researchers have also found that the SUS is a compact and effective instrument for measuring usability. Tullis and Stetson (2004) measured the usability of two Web sites using five different surveys (including the Questionnaire for User Interaction Satisfaction [QUIS], the SUS, the Computer System Usability Questionnaire [CSUQ], and two vendor specific surveys) and found that the SUS provided the most reliable results across a wide range of sample sizes. One of the unanswered questions from previous research has been the meaning of a specific SUS score in describing a product’s usability. Is a score of 50 sufficient to say that a product is usable, or is a score of 75 or 100 required?
Over the course of the 10 year study reported by Bangor, Kortum, and Miller an anecdotal pattern in the test scores had begun to emerge that equated quite well with letter grades given at most major universities. The concept of applying a letter grade to the usability of the product was appealing because it is familiar to most of the people who work on design teams regardless of their discipline. Having an easy-to-understand, familiar reference point that can be easily understood by engineers and project managers facilitates the communication of the results of testing. Like the standard letter grade scale, products that scored in the 90s were exceptional, products that scored in the 80s were good, and products that scored in the 70s were acceptable. Anything below a 70 had usability issues that were cause for concern. While this concept was intuitive, we believed that a validated scale in which the usability of a product could be assigned an adjective description might be even more useful.
Bangor, Kortum, and Miller reported the results of a pilot study that sought to map descriptive adjectives (e.g., good, awful, etc.) to the range of SUS scores. This paper presents the final results of that study.
Methods
The SUS is composed of ten statements, each having a five-point scale that ranges from Strongly Disagree to Strongly Agree. There are five positive statements and five negative statements, which alternate. While the SUS has been demonstrated to be fundamentally sound, our group found that some small changes helped participants complete the SUS. First, a short set of instructions were added that reminded them to mark a response to every statement and not to dwell too long on any one statement. Second, the term cumbersome in the original Statement 8 was replaced with awkward. (This same change was independently made by Finstad, 2006.) Finally, the term system was changed to product, based on participant feedback. The current SUS form being used in our laboratories is shown in Figure 1.
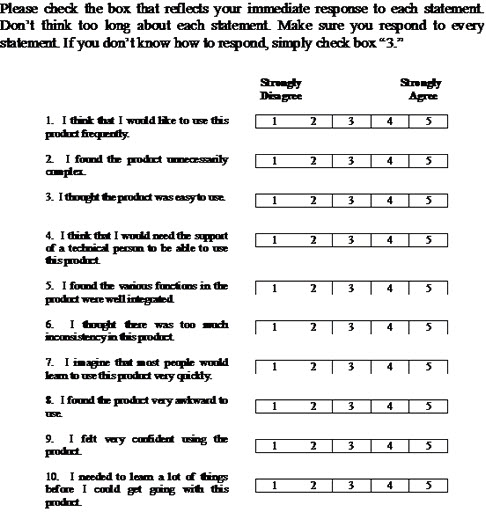
Figure 1. Our current version of the System Usability Scale (SUS), showing the minor modifications to the original Brookes instrument
We have used this version of the SUS in almost all of the surveys we have conducted, which to date is nearly 3,500 surveys within 273 studies. It has proven to be a robust tool, having been used many times to evaluate a wide range of interfaces that include Web sites, cell phones, IVR, GUI, hardware, and TV user interfaces. In all of these cases, participants performed a representative sample of tasks for the product (usually in formative usability tests) and then, before any discussion with the moderator, completed the survey. Table 1 lists survey count and mean scores by user interface type.
Table 1. Summary of SUS Scores by User Interface Type
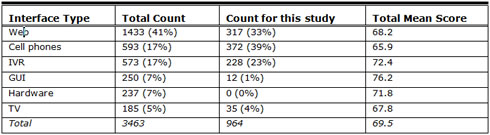
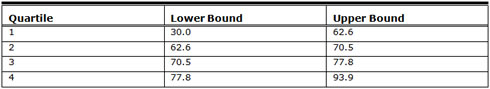
The overall mean of about 70 has remained constant for some time now. It is slightly lower than the median score of 70.5, which reflects the negative skew to the set of study mean scores. In fact, fewer than 5% of all studies have a mean score of below 50 (although 18% of surveys fall below a score of 50). The quartile breakdown of study mean scores is shown in Table 2.
Table 2. Quartiles for SUS Study Mean Scores (n=273 studies)
Adding an Adjective Scale
Having a large database of SUS scores to use as a benchmark is useful because it allows the practitioner to make relative judgments of product usability, either from iteration-to-iteration or to comparable applications. However, one question that is often asked by project team members, as well as other usability practitioners, remains: “What is the absolute usability associated with any individual SUS score?” In order to help answer this question, a study was conducted that added an eleventh question to the SUS. However, instead of following the SUS format, a seven-point, adjective-anchored Likert scale was used to determine if a word or phrase could be associated with a small range of SUS scores. A subjective image quality rating scale (Bangor, 2000; Olacsi, 1998) was adapted, with the terms Marginal and Passable dropped as being too similar to OK for the diverse user population that participate in our studies.
The phrasing of the prompt has three components. First, it preserves the overall wording from the original rating scale. Second, it uses the term user-friendliness because it is a widely known synonym for the concept of usability. Finally, the term product is used consistently with our version of the SUS. Figure 2 shows the adjective rating scale.
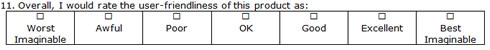
Figure 2. The adjective rating scale added to the SUS.
Procedure
The adjective rating scale statement was added at the bottom of the same page as the SUS and participants filled it out immediately after they gave their SUS ratings. The SUS with the added adjective scale was administered to 964 participants. It was used in the same wide range of studies as the SUS data reported by Bangor, Kortum, and Miller (2008), including all of the user interface modalities, across a wide age range (Mean=40.4, SD=13.9, Range: 18-81 years) and an approximately equal balance of gender (Female=474, Male=490). The modified SUS was used in all studies in which we would have normally administered the SUS during this data collection period.
Results
For analysis, numerical equivalents of 1 through 7 were assigned to the adjectives from Worst Imaginable to Best Imaginable, respectively. First, a correlational analysis was conducted to determine how well the ratings (using the adjective rating scale) matched the corresponding SUS scores given by participants (i.e., via their ten individual ratings). Results are highly significant (a<0.01) with r=0.822. These results are consistent with the results found in our pilot study (Bangor, Kortum, & Miller, 2008). In the pilot study, 212 surveys were used and a correlation of r=0.806 was found between the SUS score and an identical adjective rating scale. This correlation was viewed with some caution at the time however, because only a few of the interface modes were included in the data set and there was a marked lack of data points at the extreme ends of the adjective rating scale.
The mean score for each adjective rating for the current study is listed in Table 3 and show in Figure 3.
Table 3. Descriptive Statistics of SUS Scores for Adjective Ratings*
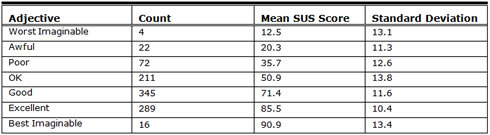 *Total count equaled 959 due to 5 surveys that did not properly use the rating scale.
All of the adjectives are significantly different, except for Worst Imaginable and Awful. The seven adjectives span almost the entire 100 point range of SUS scores, although the end points have relatively few data points.
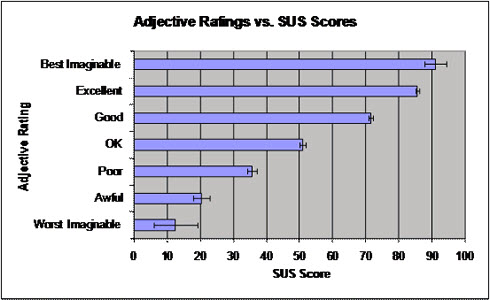
Figure 3. Mean SUS score ratings corresponding to the seven adjective ratings (error bars +/- one standard error of the mean)
Discussion
The finding that the adjective rating scale very closely matches the SUS scale suggests that it is a useful tool in helping to provide a subjective label for an individual study’s mean SUS score. Given the strength of the correlation, it may be tempting to think about using the single question adjective rating alone, in place of the SUS. Certainly administration of a single item instrument would be more efficient, and the result would be an easy to interpret metric that could be quickly shared within the product team. However, there are several reasons why using a single item scale alone may not be the best course. First, in the absence of objective measures, like task success rates or time-on-task measures, we cannot adequately determine whether the SUS or the adjective rating scale is the more accurate metric. Indeed, anecdotal evidence in our lab suggests that a test participant may provide a favorable SUS score, yet fail to complete the tasks being tested. The reverse has also been observed. Collecting this kind of corroborating data is an effort that we will be undertaking in future studies.
Second, psychometric theory suggests that multiple questions are generally superior to a single question. Many studies have found that multiple question surveys tend to yield more reliable results than single question surveys. For example, in a study of overall job satisfaction, Oshagbemi (1999) found that single item measures tended to produce a higher score on job satisfaction than did the comparable multi-question surveys. Because specific elements of dissatisfaction could not be uniquely addressed, the single question survey tended to dilute dissatisfaction measures. In another study, users were asked to determine their intake of fish products. In one survey, respondents were asked to estimate intake for 71 different fish items, and in another survey they were asked a single question regarding their intake of fish. The results showed that when respondents used the single question survey they underestimated their intake of fish by approximately 50% (Mina, Fritschi, & Knuiman, 2007). These studies seem to indicate the superiority of multiple item questionnaires.
Other research, however, indicates that single item surveys can produce results similar to those found with multiple item surveys. For example in a study that measured workers focus of attention while on the job it was found that there were no differences between single and multiple measures (Gardner, Cummings, Dunham, & Pierce, 1998). Similarly, Bergkvist and Rossiter (2007) found that the correlation between consumers’ attitudes towards specific brands and advertisements was the same regardless of whether single or multiple item questionnaires were used.
Based on these disparate results, how do we determine whether using the adjective rating scale alone might be appropriate? The key lies in trying to understand whether the construct of usability is a concrete singular object as defined by Rossiter (2002). In order for a construct to be concrete, all of the users must understand what object is being rated. In the case of the usability studies that is a reasonable assumption, because a single item was presented to the user for evaluation. In order for an object to be considered singular, it must be considered homogenous—a single item rather than a collection of separate but related items. If an item is considered to be concrete singular, then single item questionnaires can be utilized. However, if an item is not considered to be concrete singular, then multiple item questionnaires should be utilized. Because different parts of an interface may be judged differently (e.g., the main navigation vs. the help system), we believe that the items tested as part of usability assessments are not necessarily singular. Because we assume that the interfaces are not always singular, as defined by Rossiter (2002), the non-singular nature of the item makes using only a single item questionnaire alone inadvisable.
Another note of caution regarding the single adjective scale is the observation that OK might be too variable for use in this context. In this study, OK had the highest variance of the seven adjectives. It is striking, though, that its mean score (50.9 out of 100) is at the SUS scale’s mid-point, which matches previous research on adjective ratings (Babbitt & Nystrom, 1989), that lists OK as being a mid-point value between Neutral and Average. However, participants may have believed OK to mean that something is acceptable. In fact, some project team members have taken a score of OK to mean that the usability of the product is satisfactory and no improvements are needed, when scores within the OK range were clearly deficient in terms of perceived usability.
It seems clear that the term OK is probably not appropriate for this adjective rating scale. Not only is its meaning too variable, but it may also give the intended audience for SUS scores a mistaken impression that an OK score is satisfactory in some way. Using other, established rating scales (Babbitt & Nystrom, 1989), we believe that the terms fair or so-so are likely to still result in a mid-point value on the scale, while at the same time appropriately connoting an overall level of usability that is not acceptable in some way.
Because of the questions about how accurately the actual adjectives map to SUS scores, we are also considering testing a different adjective scale. As described earlier, we have found that a useful analog to convey a study’s mean SUS score to others involved in the product development process has been the traditional school grading scale (i.e., 90-100 = A, 80-89 = B, etc.) (Bangor, Kortum, & Miller, 2008). This has strong face validity for our existing data insofar as a score of 70 has traditionally meant passing, and our data show that the average study mean is about 70. We had earlier proposed a set of acceptability ranges (Bangor, Kortum, & Miller, 2008) that would help practitioners determine if a given SUS score indicated an acceptable interface or not. The grading scale matches quite well with these acceptability scores as well. Figure 4 shows how the adjective ratings compare to both the school grading scale and the acceptability ranges.
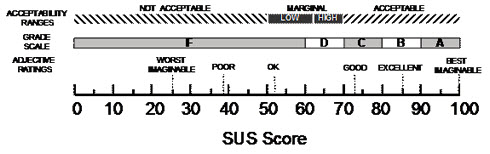
Figure 4. A comparison of the adjective ratings, acceptability scores, and school grading scales, in relation to the average SUS score
Finally, regardless of whether words or letter grades are used for such a scale, we believe that the results from a single score should be considered to be complementary to the SUS score and the results should be used together to create a clearer picture of the products overall usability.
The work presented here suggests several lines of future research that are needed in order to further understand both the SUS and the use of an additional single question rating scale. First and foremost, data collection will continue with the substitution of the mid-point adjective with one that carries a stronger neutral connotation than the current term of OK. With this substitution, we will also be including a letter grade scale to allow the users themselves to make the determination of a grade assignment, rather than having to rely on the anecdotal evidence presented to date. One virtue of the letter grade approach is that the subject could be asked verbally to assign a letter grade prior to presentation of the SUS. This would help remove the letter grade from the context of the SUS questions and perhaps increase the degree of independence between the two measures. We hypothesize that users may be less reluctant to give low or failing grades to poor interfaces because of their extensive exposure to this familiar scale in other domains. We believe that users may have self-generated reference points across the entire letter grade scale and because of their previous exposures could be more willing to use the full scale. If this is true, it may prove to be a valuable extension of the SUS and help solve the range restriction issue that is prevalent in SUS scores. If the letter grade score does indeed prove to be reliable and useful, further investigations will need to focus on whether such a single score assessment might be sufficient. One important element of these investigations will be to examine the relationship between the SUS, the seven-point adjective rating scale, and the letter grade scale with objective measures of usability such as time-on-task and task success rates.
References
Babbitt, B.A. & Nystrom, C. O. (1989). Questionnaire Construction Manual. Fort Hood, TX: US Army Research Institute for the Behavioral and Social Sciences, Research Product 89-20.
Bangor, A. W. (2000). Display Technology and Ambient Illumination Influences on Visual Fatigue at VDT Workstations. Blacksburg, VA: Unpublished Ph.D. Dissertation, Virginia Polytechnic Institute and State University.
Bangor, A., Kortum, P., & Miller, J.A. (2008). The System Usability Scale (SUS): An Empirical Evaluation, International Journal of Human-Computer Interaction, 24(6).
Bergkvist, L. & Rossiter, J.R. (2007). The predictive validity of multiple-item versus single-item measures on the same construct, Journal of Marketing Research, 44, 175-184.
Brooke, J. (1996). SUS: a ‘quick and dirty’ usability scale. In P.W.Jordan, B. Thomas, B.A. Weerdmeester, and I.L. McClelland (Eds.) Usability Evaluation in Industry (189-194). London: Taylor and Francis.
Finstad, K. (2006). The System Usability Scale and Non-Native English Speakers, Journal of Usability Studies, 4 (1), 185-188.
Gardner, D.G., Cummings, L.L., Dunham, R.B., & Pierce, J.L. (1998). Single-item versus multiple-item measurement scales: an empirical comparison, Educational and Psychological Measurement, 58(6), 898-915.
Mina, K. Fritschi, L., & Knuiman, M. (2007). Do aggregates of multiple questions better capture overall fish consumption than summary questions? Public health nutrition, 11(2), 196-202.
Olacsi, G. S. (1998). Subjective Image Quality of CRT Displays under Ambient Glare: Assessing the ISO 9241-7 Ergonomic Technical Standard. Blacksburg, VA: Unpublished M.S. Thesis, Virginia Polytechnic Institute and State University.
Oshagbemi, T. (1999). Overall job satisfaction: how good are single versus multiple-item measures? Journal of Managerial Psychology, 14 (5), 388-403.
Rossiter, J.R. (2002). The C-OAR-SE procedure for scale development in marketing, International Journal of Research in Marketing, 19, 305-335.
Tullis, T. S. & Stetson, J. N. (2004, June 7-11). A Comparison of Questionnaires for Assessing Website Usability, Usability Professionals Association (UPA) 2004 Conference, Minneapolis, USA.