
Abstract
Augmented Reality (AR) is established in a wide range of fields, but a specific area of application is AR content on social media. Because AR content can be a business offering, new opportunities are arising to present products and services to users of social media. AR filters or lenses may be published by companies either as advertising or as generic content on their social media profiles. Our study tested the generic branded AR lenses on the platform Snapchat™ for user experience. We conducted a user test with 27 Snapchat users using 3 different generic branded AR lenses. We recorded participants’ experiences using the User Experience Questionnaire (UEQ) and individual short interviews. The latter included questions about personal preferences and the perceived augmentation quality, as augmentation quality has been proven important to the UX of AR. Our analysis of the data shows that AR lenses can achieve a good result in the UEQ scale Novelty and that the Attractiveness is above average. However, the results also indicate that the generic branded AR lenses need improvement in aspects related to usability. Additional interview questions revealed that the augmentation quality of generic branded AR lenses has not always been perceived positively, yet the UX of these lenses should be important to businesses that want to invest in this technology. Poorly implemented AR applications can compromise users’ experience and, consequently, negatively impact a company and its brand.
Keywords
Augmented Reality, AR, AR lenses, User Experience, Usability, Snapchat, User Experience Questionnaire, social media
Introduction
With more than four billion active social media users (Kemp, 2022), the amount of daily digital published content on various platforms is unconceivable. In the DataReportal, Kemp (2022) also shows that each person spends an average of 2 hr and 27 min on social media. In total, this reflects the largest share of media time. That is valuable time in which companies of all kinds can draw attention to themselves. On the other hand, it can be difficult for companies to stand out from the amount of content (Lammenett, 2021; Stumpp et al., 2021). One technology that can help companies stand out is Augmented Reality (AR). Appel et al. (2020) found that AR has a discernible impact on social media in the long term. The mobile game Pokémon Go™, and AR in general, has gained much attention (Hegemann, 2017). AR has been an integral part of social media for several years (Appel et al., 2020), and it can offer users the opportunity to interact with filters or lenses for their face, their entire body, or the environment. Users and providers can create filters and lenses. Likewise, other companies can publish AR content in an ad format or as generic content on their profile, which serves them as another marketing tool (Ibáñez-Sánchez et al., 2022).
The pioneer of AR on social media is Snapchat (Decker, 2022; Hillmann, 2021; Janke, 2022), which integrated its so-called AR lenses into its app in 2015 (Shontell, 2015). According to the CEO of Snap Inc., more than 200 million users on average engage with AR in the app every day (Deloitte Digital & Snap Inc., 2021). Therefore, it is not surprising that the company continues to invest resources in augmentation technology and collaborates with other companies on solutions (Deutsch & Lanxon, 2022).
The general appeal of AR to companies is demonstrated, for example, by the integration of the technology into applications or websites such as Mister Spex™ or the IKEA® Place App. The integration of AR also creates new opportunities for companies to connect with customers or potential buyers (Ibáñez-Sánchez et al., 2022; Stumpp et al., 2019). These new touchpoints can have diverse impacts; one of them is the promotion and improvement of the company’s UX (Berryman, 2012).
Research on the UX of AR applications has already been the focus of several scientific papers. These papers found that there are significant factors that positively influence the UX, including ease of use (Davidavičienė et al., 2020; Dirin & Laine, 2018), the purpose of the application, and interactivity (Davidavičienė et al., 2020). Functionalities and usefulness are also estimated. Positive experiences in mobile AR apps can keep users emotionally engaged with the app because UX and emotional engagement are closely linked (Dirin & Laine, 2018). A comparison between one website and its corresponding AR app also indicates that the new technology has a positive impact on some aspects of the UX; for example, Stumpp et al. (2019) proved that the use of AR in the IKEA Place app positively impacts stimulation and novelty.
In the context of this paper, the UX of generic AR content from companies on a specific social media platform is analyzed. Based on the results, we wanted to answer the following research question.
RQ: How does the UX of generic branded AR lenses on Snapchat perform?
Our study aimed to make the UX with generic branded AR lenses more tangible and to uncover how the currently available AR lenses by various brands perform in terms of their UX on Snapchat. We hoped this would provide new insights and incentives for advertisers to offer a positive UX to Snapchat users for generic AR content. We answer the research question using empirically recorded data, both quantitative and qualitative.
It should be added that this study also serves as a starting point for AR filters and lenses outside of social media because companies also use AR for their e-commerce activities (IKEA Place App, Mister Spex, L’Oreal®, etc.). In addition, gadgets such as the newly released Apple® Vision Pro™ bring new possibilities in terms of AR. Moreover, AR lenses offer potential not only in a commercial context but also beyond that, such as for non-governmental organizations or in education (Broll, 2019). Our results, therefore, provide information about the use of AR lenses for different areas.
Background
According to Ronald Azuma, “… AR allows the user to see the real world, with virtual objects superimposed upon or composited with the real world; therefore, AR supplements reality, rather than completely replacing it” (1997, p. 356). Following this description, the real environment in AR is supplemented by computer-generated virtual objects. Ergo, users can perceive the real and the virtual at the same time. The real environment may be represented as a direct or indirect image via a display for users (Carmigniani & Furht, 2011).
UX is a very complex construct essential for human-machine interaction. It depends on many factors, like emotions, personal preferences, perceptions, and behaviors that occur throughout the process. In addition, UX represents an amalgamation of functionality, complexity, and presentation, besides the brand image, previous experiences, skills, and attitudes of the person, as well as the context of use (Hassenzahl & Tractinsky, 2006; International Organization for Standardization, 2010). Moreover, UX describes users’ experience before, during, and after using a (digital) product or service (Thüring, 2013). Because AR involves the projection of virtual objects into reality, researchers have argued that the perceived augmentation quality contributes to the UX (Poushneh, 2018; Rauschnabel et al., 2019). Various factors influence augmentation quality, including object recognition (how accurately objects from the environment are recognized by the device) and mapping quality (the accuracy with which the virtual contents are projected into reality) (Poushneh, 2018). Following these two factors, Rauschnabel et al. (2019) indicated that the perceived augmentation quality depends on how realistic the virtual objects appear and are represented. Consequently, an accurate projection of computer-generated content is relevant for the UX (Tschanz & Schart, 2017).
UX is closely related to usability because usability deals with the user-friendliness of services or (digital) products. Important factors in this context are the efficiency, satisfaction, and effectiveness with which users achieve a certain goal in a certain application context. If usability proves difficult, negative emotions such as disappointment or displeasure are triggered through the product in the person using it (Stumpp et al., 2022; Weichert, 2021). In the context of AR, usability can be negatively influenced by technical problems. An example is the incorrect recognition of surfaces, such as floors or tables. Furthermore, it must be clear to users how they can interact with virtual objects and how the technology must be utilized (Labrie & Cheng, 2020).
Previous research showed different approaches to AR filters and lenses on social media, as shown in the following examples. Snapchat combines functions of social and logistic media platforms for branded AR-lens ads. The reason is that the ad’s creation becomes the user’s task. Consequently, according to Hawker and Carah (2021), well-known influencer models are also extended. Dodoo and Youn (2021) also examined AR lens ads on Snapchat and focused on why users interact with AR ads from companies on Snapchat. According to their research, entertainment, aesthetics, and uniqueness—the so-called content-based motivations—lead to the use of AR lens ads. Dodoo and Youn (2021) determined that individual characteristics, such as preference for the brand, curiosity, and social interaction, are other reasons for use. Generally, on social media, interactivity and perceived entertainment emerge as drivers of satisfaction and experience with AR filters, which also influence users’ likelihood of recommending them to other friends. In addition, satisfaction with AR filters on social channels is determined by perceived enjoyment; amusement and fun are fundamental to the UX of such filters (Ibáñez-Sánchez et al., 2022). In order to generate a positive attitude toward a brand, usefulness is also a primary consideration when using AR filters; yet interactivity and originality influence the perceived usefulness and fun of AR filters on social media and, consequently, the UX (Flavián et al., 2021).
In addition to the positive effects of AR on social media, detrimental concerns also exist. In their research, Cowan et al. (2021) found that facial lenses are less likely to be used on Snapchat if users realize that it invades their privacy. In addition, privacy concerns decrease the frequency of recommending the lenses to others. According to the authors, these effects have only been observed when using very hedonic AR lenses (Cowan et al., 2021).
Method
Our study adopted a mixed-methods design that combines quantitative and qualitative methodologies (Döring & Bortz, 2016) to measure the UX of generic branded AR lenses on Snapchat.
Study Design
We conducted a remote but moderated user test to see how participants interact and experience the generic branded AR lenses on Snapchat. We used the User Experience Questionnaire (UEQ) by Laugwitz, Held, and Schrepp (2008) to measure the UX. This questionnaire includes six scales, which are Attractiveness (general impression of the product, or valence value), Efficiency, Perspicuity, Dependability (all three are aspects of usability, or pragmatic qualities), Stimulation, and Novelty (both are scales of UX hedonic qualities).
Furthermore, this questionnaire had previously been used to measure the UX in the context of AR (Davidavičienė et al., 2019, 2020; Stumpp et al., 2019). We chose the UEQ because this questionnaire allows a multi-dimensional view of UX (Davidavičienė et al., 2019) and covers usability with three scales (Schrepp et al., 2017b). The question “Is my product’s UX good enough?” can be answered with the UEQ using a benchmark tool provided by the developers with data from 468 studies, in which a total of 21,175 people participated. These studies dealt with a wide variety of products, such as web stores, business software, social media, and websites. The self-collected data on a (digital) product can be compared with the benchmark using the six different scales of the UEQ. Thus, we interpreted the data collected from our study, not by comparing generic branded AR lenses with non-branded lenses, but by comparing the benchmark—a preferrable research method (Schrepp et al., 2017a). The UEQ consists of bi-polar adjective pairs rated by using a 7-point Likert scale (Schrepp et al., 2017a).
Despite the prefabricated questionnaire, we established hypotheses about the UEQ’s benchmark, a helpful tool for interpreting values. Based on findings from our literature review, we assumed that Snapchat’s generic branded AR lenses would perform “good” in all areas compared to the benchmark. We formed the following hypotheses in Table 1.
Table 1. The Six User Experience Hypotheses
| Hypotheses | |
|---|---|
| H1 | The generic branded AR lenses perform at least “good” in Attractiveness compared to the benchmark. |
| H2 | The generic branded AR lenses perform at least “good” in Perspicuity compared to the benchmark. |
| H3 | The generic branded AR lenses perform at least “good” in Efficiency compared to the benchmark. |
| H4 | The generic branded AR lenses perform at least “good” in Dependability compared to the benchmark. |
| H5 | The generic branded AR lenses perform at least “good” in Stimulation compared to the benchmark. |
| H6 | The generic branded AR lenses perform at least “good” in Novelty compared to the benchmark. |
We conducted short interviews with six questions in addition to the standardized questionnaire. This interview serves as an extension to the UEQ (Saunders et al., 2021). The qualitative research approach offers different types of interviews. For those participants we interviewed, we used a semi-structured interview, which does not offer any answer options to the interviewees. The interview aimed to allow the participants to express their opinions verbally, so researchers could gain more detailed insights into participants’ points of view (Döring & Bortz, 2016). To avoid confusion among participants, we utilized the term filter for the AR lenses. In the context of AR, it has been shown that perceived augmentation quality is crucial for the UX due to the accuracy of object recognition and mapping quality (Poushneh, 2018). Because the UX of AR lenses was assessed in the present context, the perceived augmentation quality was also included in the investigation as part of the interview. The interview included the questions in Table 2.
Table 2. Interview Guide with Six Questions for Further Insight into UX
| Nr. | Category | Question | Theory/Following |
|---|---|---|---|
| 1 | Personal Preference | What aspects of the AR filters did you like best? | (Stumpp et al., 2019) |
| 2 | Which aspects did you not like about the filters you have just tested and why? | ||
| 3 | What do you think should be changed about the AR filters and why? / What do you think is missing? | (Dirin & Laine, 2018; Stumpp et al., 2019) | |
| 4 | Augmentation Quality | How would you rate the quality of your surroundings, face, or feet which were detected by the filter? | (Javornik et al., 2016; Poushneh, 2018; Rauschnabel et al., 2019) |
| 5 | How did you feel about the accuracy by which the filters were displayed? | ||
| 6 | Usability | How would you describe the quality of the usage information provided by the filters? | (Labrie & Cheng, 2020) |
Materials
Because we conducted the user test remotely, we required a laptop to connect with the participants through Google™ Meet™. Participants are asked to bring their own mobile phone to use Snapchat and a laptop or tablet. The answers of the UEQ were collected by the provider LimeSurvey® as an addition to the sociodemographic data and general questions about the use of Snapchat (see Appendix 1). For the calculation of the sociodemographic data and general questions we utilized SPSS®. The values of the UEQ are numerical data, too; therefore, we used the publicly available evaluation Excel™ document in version 10, which the developers offer on the website ueq-online.org.
We documented the answers to the additional interview questions using the recording function of our mobile phone, an iPhone® XS. We completed transcription with the help of the transcription software Trint™ and HappyScribe. These tools converted the audio into written form using AI and our assistance; transcriptions are available as text for further analysis (Geyer, 2016). For the content analysis and evaluation, we used the software MAXQDA™ which supports the organization of the data, the analysis of the answers, and color coding (Saunders et al., 2021). For the content analysis and evaluation of the interviews, we applied the method of Mühlfeld et al. (1981) to focus on the content of the interviews. The interpretation of non-verbal abnormalities was, therefore, not necessary. Moreover, the method consists of several steps that build on each other. Other authors describe it as a pragmatic approach (Lamnek & Krell, 2016; Mayer, 2013) that requires less time and economic resources than others. In addition, this method focused on identifying problem areas, which corresponded to the questions of the semi-structured interview. Therefore, the identified problem areas can be assigned to the questions of the interview (Lamnek & Krell, 2016). This made it easier to connect and cluster the answers to various questions.
Due to the number of generic branded AR lenses on Snapchat, we selected only three. The chosen ones are not gender-specific and covered different industries (clothing, food, and entertainment). To reduce the search time for the 3 AR lenses, we marked them as favorites in the test Snapchat account, which facilitated our access during testing. The 3 selected AR lenses of the brands are presented briefly in terms of their functions. Screenshots can be found in Appendix 2.
Adidas® Forum Sneaker
When the lens is started, the frontal camera is automatically activated, and music plays in the background. The facial skin appears smooth. The word “SMILE” is displayed for about 3 s. If users react and smile at the camera, the word “FORUM” appears in animation on the screen, and a bucket hat is placed on the user’s head. Moreover, the user’s current location appears, and the brand’s logo can be seen. Users are then prompted in German to change the camera. With an activated back camera, the text “TRY ON THE NEW FORUM SNEAKER” is displayed for 3 s. If users point the camera at their own feet, five different sneakers from the “Forum” collection can be tried on virtually.
Ben & Jerry’s™ Cookie Dough
With their AR lens, Ben & Jerry’s advertises its “Chocolate Chip Cookie Dough Chunks” product in a playful way. When this AR lens is selected, the frontal camera is automatically activated. The brand logo can be seen. Before the game starts, the goal of this AR lens (“CATCH AS MUCH COOKIE DOUGH AS YOU CAN AND CHALLENGE YOUR FRIENDS”) is displayed on the screen for 3 s. The game starts and the cookie dough flies out of a bag. The pieces are caught with an open mouth. Users have 20 s to catch as many as possible. There is also the option to use the smartphone’s back camera for the game. At the end, the number of cookie dough pieces caught is displayed, and a fireworks display appears in the background, accompanied by the sound of applause. A cheerful melody can be heard throughout the entire game.
Netflix® Stranger Things
Like the previous lenses, Netflix starts in selfie mode. The characteristic of the character Eleven from the series appears on the user’s face as the nosebleed. The music from the series intro is played in the background. In addition, the series logo and the streaming service appear on the screen, as well as other elements such as snow or branches. Two hints appear. The text “FLIP CAMERA TO ENTER THE UPSIDE DOWN” is displayed for 3 s and a speech bubble with the words “SWAP CAMERA TO GET STRANGE” appears for 4 s at the top right next to the symbol for swapping the camera. If users switch to the back camera, a door appears in the user’s own environment, and the user is prompted in English to take a step forward to enter the Upside Down, which is familiar from the series. Users can enter through this door and explore the living room of the Byers family, which is known from the Netflix series. In this virtual room, users can hear the melody of the series and various sounds.
Participants
This study focused on the generic AR lenses of brands that are available on Snapchat. Rather than relying on past experiences of Snapchat users, we tested the AR lenses directly. However, we followed previous studies and only included individuals who used the app and have previously interacted with AR lenses on Snapchat (Dodoo & Youn, 2021; Flavián et al., 2021; Ibáñez-Sánchez et al., 2022; Phua & Kim, 2018). Thus, we avoided familiarization with the app. We recruited participants via social media, our contacts, and referrals by third parties.
Thirty-one German Snapchat users participated in this study. Due to inconsistencies in the UEQ results of 4 participants, they were sorted out because their answers showed inconsistencies. The developers of the UEQ offered a spreadsheet in their evaluation Excel, which calculated discrepancies in the completion of the UEQ. Therefore, we followed the suggestion of the creators and removed answers with a critical value ≥3 from the data set. Because this occurred with 4 people (P2, P16, P22, and P25), the number of responses we analyzed was 27. Of those 27 participants, 10 were male and 17 female. Their ages ranged from 20-32 years (M = 25.15; SD = 2.38). Most respondents, 14 people, were already working, followed by 11 students. Two participants were in training. All respondents stated that they had already used the AR lenses on Snapchat. In terms of usage, 16 respondents indicated that they used the Snapchat app daily. Five participants interacted with the app 1-3 times a week and 4 participants 1-3 times a month. Only 2 participants used Snapchat less frequently. Of those 27 participants, 8 participated in the additional interview. For more information, see Table 6 in Appendix 3.
Procedure
After a short introduction, we asked test participants to fill out a sociodemographic questionnaire and answer questions about the way they use Snapchat (Appendix 1). Then they logged into the test profile on Snapchat. We informed the participants that they should activate the sound on their mobile devices and that they could take pictures of themselves during the test, but it would not be necessary. The person in charge then explained to the participants that they would test 3 different lenses. No further information about the AR lenses was given, except the brands’ names. In this way, the participant was able to interact with the AR lenses freely and without bias. Subsequently, the person in charge guided each participant to the place in the app where the 3 favored AR lenses were saved. During the user tests, participants were asked to report aloud what they observed while using the lenses. Thus, we determined whether participants detected the different elements of the AR lenses. In all cases, the AR lens from Adidas was tested first, followed by the lens from Ben & Jerry’s, and finally the lens from Netflix. The established order served the purpose of traceability and verifiability in the event of a repetition of this study. The participants were allowed to restart the AR lenses if they needed to. If questions arose about the usage of the branded AR lenses, we gave participants brief clues, but these did not anticipate the solution. In the case of Adidas, for example, the name of the AR lens was repeated. During the user test, we took notes and recorded those moments in which problems occurred during the interaction with the lenses. After the user tests were completed, participants filled out the UEQ. Beforehand, we noted verbally that this was the evaluation of the 3 AR lenses being tested as a whole.
During the completion of the test, we checked whether the participant was suitable for answering additional open questions. When making the selection, we tried to ensure that half of the respondents used Snapchat regularly (daily or 1-3 times a week) and the other half less frequently (1-3 times a month or less). In this way, we tried to prevent highlighting perspectives associated with a certain frequency of use. All those who were asked whether they would answer additional questions agreed. Additionally, we obtained a declaration of consent for further processing of the audio in advance. Thereupon, the instructor asked the questions from the guide. Finally, the respondents were thanked for their participation and for their support.
Results
Before reviewing the results from the UEQ and the interview, we want to disclose responses gathered from the socio-demographic questionnaire, which included a multi-choice question, ’Why do you use Snapchat?’ The distribution of responses shows that the majority, 24 participants, uses the social media platform “to stay in touch with friends (chat, send snaps, etc.).” Three of the 27 participants also indicated they use the app “to watch the stories of celebrities/influencers.” Six of the participants chose to add their own reason why they use Snapchat, which included “to take funny photos, videos,” “to use the AR filters of the app,” “to try out the different filters,” “…use my memories so much! I watch my highlights over the year every day,” “to see what my friends are currently doing/have done,” and “to collect flames.” The other answer choices (see Appendix 1) were not considered by anyone.
The results of the UEQ are shown in Table 3. According to the participants, the 3 generic branded AR lenses convinced with their Novelty. In contrast, the scale Dependability scored the worst result.
Table 3. The Results for the Six Scales of the UEQ
| Scale | Mean | Std. Dev. | N | Confidence Interval – Low | Confidence Interval – High |
|---|---|---|---|---|---|
| Attractiveness | 1.32 | 0.71 | 27 | 1.05 | 1.59 |
| Perspicuity | 0.98 | 1.15 | 27 | 0.55 | 1.41 |
| Efficiency | 0.52 | 0.97 | 27 | 0.15 | 0.89 |
| Dependability | 0.44 | 0.89 | 27 | 0.11 | 0.78 |
| Stimulation | 0.84 | 0.90 | 27 | 0.50 | 1.18 |
| Novelty | 1.35 | 0.89 | 27 | 1.02 | 1.69 |
* Confidence intervals are p = 0.05 per scale.
In the context of mean values, it is claimed that a result between -0.8 and 0.8 can be interpreted as a neutral evaluation of the respective scale (Santoso et al., 2016; Schrepp, 2019). Assuming this, both Efficiency (M = 0.52) and Dependability (M = 0.44) of the 3 AR lenses were considered neutral by the participants. The remaining scales Attractiveness, Perspicuity, Stimulation, and Novelty, show better mean values and were above neutral.
In summary, it can be stated that the pragmatic qualities of the tested AR lenses perform neutrally according to the participants. The Attractiveness and hedonic qualities of the 3 lenses achieved a good result with their mean values.
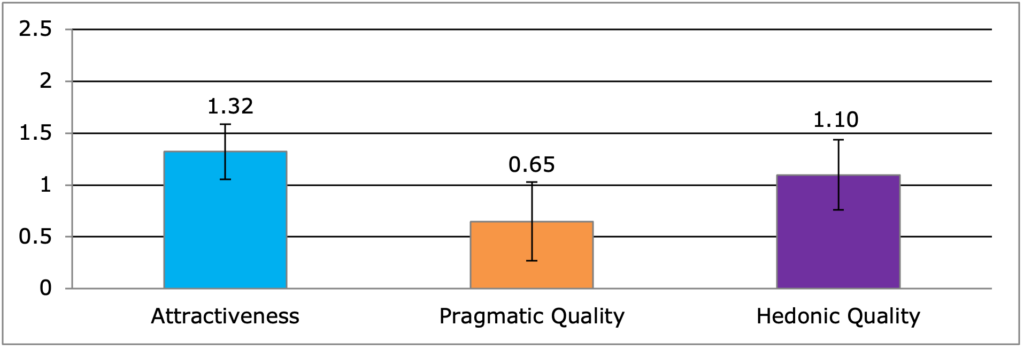
Figure 1. The calculated mean values and 95% confidence intervals of Attractiveness, pragmatic, and hedonic qualities.
Comparison of the Benchmark
The data was compared with the benchmark offered by the UEQ. This enables a better evaluation of the UX of a (digital) product and thus comes close to the research question of this paper. Figure 2 illustrates the comparison between the 3 tested generic branded AR lenses and the benchmark.
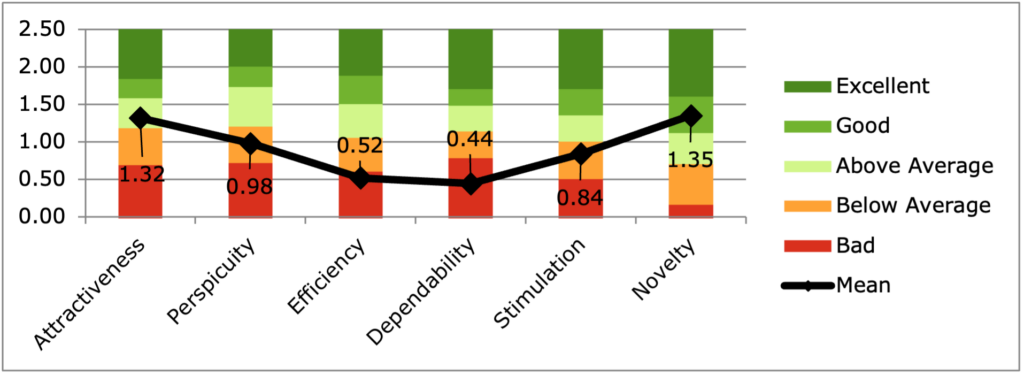
Figure 2. Comparison of the calculated mean values of the AR lenses with the benchmark.
The comparison with the benchmark reveals that the Novelty of the AR lenses was perceived as good. The measured Attractiveness achieved an above average result, which means that 25% of the results of the benchmark were better, and 50% achieved a worse result in this scale. In this way, only hypotheses H6 (Table 1) seems to be confirmed. However, regarding the lower limit of the confidence interval (Table 3), H6 cannot be confirmed at first glance. In the remaining scales, the AR lenses can only achieve results below good, which means that the remaining assumptions (H1-H5) do not apply.
To further interpret our results, we use the benchmark intervals for the UEQ scales from Schrepp et al. (2017a) (Table 4) along with our 95% confidence intervals to describe where the mean and upper or lower limits of the confidence intervals fall in the benchmark’s categories. It must be noted that the only available data is from 2017.
Table 4. Benchmark Intervals for the UEQ Scales (Schrepp et al., 2017a)
| Attr. | Perspi. | Efficiency | Depend. | Stimu. | Novelty | |
|---|---|---|---|---|---|---|
| Excellent | ≥ 1.75 | ≥ 1.9 | ≥ 1.78 | ≥ 1.65 | ≥ 1.55 | ≥ 1.4 |
| Good | ≥ 1.52 < 1.75 | ≥ 1.56 < 1.9 | ≥ 1.47 < 1.78 | ≥ 1.48 < 1.65 | ≥ 1.31 < 1.55 | ≥ 1.05 < 1.4 |
| Above average | ≥ 1.17 < 1.52 | ≥ 1.08 < 1.56 | ≥ 0.98 < 1.47 | ≥ 1.14 < 1.48 | ≥ 0.99 < 1.31 | ≥ 0.71 < 1.05 |
| Below average | ≥ 0.7 < 1.17 | ≥ 0.64 < 1.08 | ≥ 0.54 < 0.98 | ≥ 0.78 < 1.14 | ≥ 0.5 < 0.99 | ≥ 0.3 < 0.71 |
| Bad | < 0.7 | < 0.64 | < 0.54 | < 0.78 | < 0.5 | < 0.3 |
For the scale Attractiveness, the 95% confidence interval ranges from 1.05 to 1.59, so the associated grades are below average for the lower limit, above average for the mean, and good for the upper limit. Therefore, we can state that the population score is neither bad nor excellent but somewhere in between.
With a 95% confidence interval of 0.55 to 1.41, the grades of next the scale, Perspicuity, are bad for the lower level, below average for the mean, and above average for the upper limit.
For Efficiency of the AR lenses, the results for the lower limit and the mean value are both associated with the categorization bad. Only the upper limit can reach the classification below average. The same applies for the scale Dependability with a confidence interval of 0.11 to 0.78.
Like Perspicuity, the scale Stimulation cannot reach the grades good or excellent with its 95% confidence interval range of 0.50 to 1.18. The last scale, Novelty, is the only one of which we can say that the population score is not bad but instead is between above average and excellent as the 95% confidence interval extends from 1.02 to 1.69. The answers from the interviews also provide indications that Novelty scores above average.
To finalize the comparison with the benchmark, we used an independent t-test to compare our results with the means and standard deviations of the benchmark. Here, we would also like to mention that the only available data is from 2017 (Schrepp et al., 2017a), which is why the benchmark data used for the independent t-test is not the same as Figure 2.
Table 5. Independent Two Sample t-Tests
| Scale | Snapchat Lenses | Benchmark | Two Sample t-Tests Assuming Unequal Variances | ||||||
| Mean | Std. Dev. | N | Mean | Std. Dev. | N | t-value | Alpha level 0.05 | Sig. Dif | |
| Attractiveness | 1.32 | 0.71 | 27 | 1.04 | 0.64 | 9905 | 2.0469 | 0.0407 | Yes |
| Perspicuity | 0.98 | 1.15 | 27 | 0.97 | 0.62 | 9905 | -0.3613 | 0.7179 | No |
| Efficiency | 0.52 | 0.97 | 27 | 1.06 | 0.67 | 9905 | -2.4092 | 0.0160 | Yes |
| Dependability | 0.44 | 0.89 | 27 | 1.07 | 0.52 | 9905 | -3.6764 | 0.0002 | Yes |
| Stimulation | 0.84 | 0.90 | 27 | 0.87 | 0.63 | 9905 | -0.1731 | 0.8626 | No |
| Novelty | 1.35 | 0.89 | 27 | 0.61 | 0.72 | 9905 | 2.7999 | 0.0051 | Yes |
Even though Table 5 depicts four alpha levels that are minor compared to 0.05, two of them (Efficiency and Dependability) refer to a better performance than the benchmark. For the scales Attractiveness and Novelty, our results perform significantly better than the benchmark from 2017 and thus underline the result shown in Figure 2.
Interview Results
The results of the transcribed open questions are presented according to the previously created categories, so the focus is placed on similarities and divergences. It should be noted that some statements can be assigned to different questions because there is a connection between the topics they deal with. The present results are supplemented with our observations that proved to be of relevance during the user test.
Personal Preference
Personal preferences are significant for determining the UX (International Organization for Standardization, 2010). The AR lens from Adidas left a positive impression on 6 interviewees. The respondents notably emphasized the option to virtually try on sneakers. The functions of the frontal camera were positively highlighted by P20, who said that the lens provided a perfect skin and made her look cool, adding that one can take pretty selfies with it. The inability to choose the shoe model was criticized by the user as well as the way the shoes were depicted. According to P19, the shoes appeared too similar to a 3D model, and it was unclear whether this depiction was intentional by the brand. Two other respondents also assumed that the brand intended the non-realistic portrayal of the shoes. Furthermore, the bucket hat was not perceived as special by P7. She stated that she would not have needed this lens as one can only take pictures or videos with it.
More than half of the respondents also liked Netflix’s AR lens. Primarily, the participants emphasized that they had not interacted with an AR lens that used such kinds of original and novel functions when the back camera was being used. The originality of AR lenses is important because it can attract the users’ attention (Flavián et al., 2021). Only 1 of the 8 interviewees pointed out the nosebleed part of the lens. P20 highlighted that “it somehow looked quite real.” A technical problem that prevented the accurate display of the AR lens with the back camera was mentioned negatively by 1 participant. The immersion in the living room of the series Stranger Things, which prevented the view through the cell phone screen of one’s surroundings, proved to be negative for P20, who compared it with watching a movie. She would have preferred to still be able to see her own room and that by using the lens just certain objects would have been integrated virtually into her surroundings. In addition, the restriction to only one virtual room was criticized by P7. Another issue that P9 mentioned was that the instructions were solely displayed in English. Interviewee number nine explained that she rotated her cell phone 180° instead of switching from the front to the back camera while using this AR lens because of her limited knowledge of the English language.
The AR game from Ben & Jerry’s occasionally received positive feedback. For example, it was described as a fun idea to promote a product. For 2 respondents, it was the first time they interacted with an AR lens designed as a game. According to another participant, the game was considered a good option for competing with friends during lunch breaks. The same respondent also commented positively on the music. One participant was not convinced by the game, described it as a gimmick, and consequently would not play it again. P19 said it required too much action from the user, and he did not perceive the game as innovative; he added that “something like that has been around for a while now.” The main camera’s inability to be used was also mentioned as a drawback.
The interview participants got creative when question three of the guide was asked. Regarding the Netflix lens, half of the interviewees agreed that it could be further expanded in various ways, especially interaction-wise. Interview participants mentioned examples including while turning the AR lens into a game, going into another room, or interacting more with the virtual objects. Although most of the feedback for the Adidas AR lens was quite positive, there are some aspects that respondents would possibly adjust. For example, they wished for more variations of hats. Others expressed similar ideas, suggesting a wider range of colors, a wider range of products, such as “hoodies, shirts, pants” (P19), or three different types of shoes. Furthermore, some interview participants mentioned a more realistic depiction of the shoes would be an improvement point. Another aspect that most respondents would change is the display duration of the instructions. Some did not distinguish between the lenses. Others, however, referred specifically to 1 AR lens, such as Ben & Jerry’s, in which participants wanted a longer lead time to read the instructions for the game. Therefore, a pause function was proposed for the mentioned AR lens. Apart from this, for the Adidas lens, P20 suggested to “simply display the instructions again after a few seconds.” As previously mentioned, instructions in English were perceived as a hindrance. One participant brought up the language aspect as a general suggestion that should be changed, stating that German instructions would have made it easier to use the AR lenses.
Perceived Augmentation Quality
The 8 interviewees had varying perceptions of the perceived quality of object recognition. A few of them perceived it to be good. Two statements contrast these evaluations. One of them describes the object recognition as improvable; moreover, they said that the AR lens sometimes recognized body parts where none could be seen. We received similar feedback for the perceived mapping quality of the AR lenses. Some described it as accurate; others depicted it as improvable, advanced, or delayed in time.
The comments about the individual AR lenses are similar. For example, the Adidas Snapchat lens received praise for the object recognition. Some interviewees still want improvement, especially for the bucket hat. Other interviewees were not completely convinced by the object recognition for the shoes or the hat. One of the participants wore over-ear headphones throughout the test and interview. This prevented the correct recognition of the head, so the proper depiction of the hat was not possible. Furthermore, 1 participant mentioned that a foot was often recognized by the device in places where none could be seen, such as on the desk or the user’s pants. As a result, the sneakers were displayed in places where no foot was located. The same interviewees who found the object recognition positive revealed equally positive impressions toward the mapping quality. Although some spoke of a delay in rendering, the bucket hat fit well. Two others described some problems they encountered. One mentioned that the hat appeared in front of her face, and another was not sure if the hat “fit really perfectly” (P7).
Perceived object recognition of the Ben & Jerry’s AR lens was described positively in some ways. That is, the mouth was recognized, and the game worked well. But the game was perceived as “not 100% accurate” (P7), who doubted whether a cookie piece could be caught despite the open mouth. The feedback can also be applied to the perceived mapping quality.
In contrast, for Netflix’s AR lens for Stranger Things, there is only positive feedback from respondents related to object recognition. Participants agreed that the movements with the smartphone did not result in any negative impact on the view into the virtual living room. The responses can also be applied to the mapping quality because recognition and depiction are closely related (Broll, 2019).
Usability
The answers to the last question of the guide revealed different opinions. Participants used different words to describe it, such as good, constant, understandable, OK, or sufficient. Two interviewees mentioned the last adjective to define the quality of the instructions but not the display duration.
For the functions of the back camera, most users agreed that the information provided by the Adidas AR lens was insufficient in terms of quality.
P19: “I have to say, this […] Adidas filter, I didn’t understand it at first. […] It wasn’t really intuitive for me.”
P20: “[The] Adidas [filter] wasn’t really self-explanatory at first.”
P26: “The Adidas filter. With the shoes. I had to look for a long time, and it took me a long time to understand that I need to focus on my feet.”
The statements corresponded to the observations during the user test. Most of the participants had problems figuring out how to use the back camera with this AR lens. Thus, most of them fell into a trial-and-error procedure, which they abandoned after a short time. As a result, they often asked what had to be done because nothing happened on the screen. This situation might have also caused feelings that negatively influenced the UX of the AR lens (Weichert, 2021).
Participants’ feedback on the Ben & Jerry’s AR lens also showed that the quality of the instruction was insufficient. The instruction was described as extensive, and due to the short display time, it was not possible to read it completely. Others had a similar experience, saying they had not understood the instructions at the beginning or that they did not understand how it worked until the second run of the game. This insight was comparable to the observations during the user test. Many participants often started the game with a delay and waited to see what happened on the screen; however, it was through trial-and-error that people became aware that the cookie dough pieces could only be caught with an open mouth. However, 2 participants testified that the word “catch,” which was part of the instructions, made the task self-explanatory and that it was clear at the beginning how this lens worked.
For the Netflix AR lens, Usability was impaired by the language barrier, which led to P20 turning the phone 180° instead of switching from the front to the back camera. The interviewee perceived this application error as her own fault, given that the usage information was provided by the AR lens. However, this was not an isolated case. P24, P29, and P31 also initially turned their cell phones 180°, too. With the back camera activated, some of the information proved to be inadequate. Two interviewees stated that they were not quite sure what to do after entering the virtual living room and if there was something more to the AR lens. P7 was also uncertain how the nosebleed was triggered when the front camera was activated. For a small number of participants (P11, P24, and P30), the nosebleed feature of the AR lens did not display during the user test at all.
A short summary of the UEQ and interview results are shown in Table 7 of Appendix 4.
Discussion
With an average age of 25.15 years, the participants of the user test form part of Snapchat’s second largest user group, with a share of participants aged 25-34 at 22.8%. Only users aged 18-24 take up a larger share of the platform (38.9%) (Kemp, 2023).
The evaluation of the UEQ showed that the generic branded AR lenses mostly convinced the participants with their Attractiveness (M = 1.32), which the interviewees’ statements can confirm. The comparison with the benchmark reflects the positively perceived Attractiveness, as an above-average result was achieved in this scale. The general impression of the generic AR lenses by brands was good. Arguably, they could score even better by redesigning aspects of the AR lenses that were not perceived positively.
The pragmatic qualities could not exceed the threshold value of M = 0.8 and come to a neutral result (M = 0.65). To find the reason for this, it is necessary to look at the scales belonging to this quality, including Perspicuity, Efficiency, and Dependability (Schrepp et al., 2017a). The last two scales could only achieve a “bad” result, even compared to the benchmark. To better interpret these values, we must examine the adjective pairs of the different scales.
First, it is necessary to consider the mean values of the items that belong to Dependability. (Dependability: unpredictable-predictable: -0.4, obstructive-supportive: 0.4, secure-not secure: 1.1, meets expectations-does not meet expectations: 0.) The adjective pair unpredictable-predictable is the only one of this scale to reach a negative mean value. The UEQ considers unpredictability negative and predictability a positive. However, due to the use of AR, participants could have perceived the item’s unpredictability differently. In the context of AR, this could also be understood as unexpected or surprising, in other words, as a positive quality of the technology (Davidavičienė et al., 2019, 2020). Consequently, we assume that this pair of adjectives was misinterpreted, which is why the present result was obtained (Rauschenberger et al., 2013; Schrepp, 2019).
All the adjectives belonging to the scale Efficiency received neutral ratings. (Efficiency: fast-slow: 0.7, inefficient-efficient: 0.5, impractical-practical: 0.4, organized-cluttered: 0.5.) Therefore, the required activities cannot be carried out completely efficiently yet. For further interpretation of the values of Perspicuity, Dependability, and Efficiency, which reflect usability, we consulted parts of the interviews.
Interviewees revealed that using the AR lenses was not always easy to understand. For example, the usage information of the AR lenses was not clear at the beginning, as the necessary instructions for correct use were missing. Furthermore, it was not always possible for the participants to read the superimposed instructions after starting the AR lens; instructions disappeared after a short time. As a result, participants restarted the AR lenses. The tasks set by the lenses (for example, “TRY ON THE NEW FORUM SNEAKER”) could only be completed with increased effort because the lenses were neither comprehensible nor controllable or intuitive. We assumed that the short display of the instructions was one of the reasons why P20, P24, P29, and P31 turned the smartphone 180° when testing Netflix’s AR lens. In the brief amount of time, only individual sections of the instructions could be recalled, like the first instruction (“FLIP CAMERA”) in combination with the ending instruction (“UPSIDE DOWN”). Due to the resulting application errors, however, the existing functions of the AR lenses could not be triggered, which may have led to confusion or other negative emotions among the users (Weichert, 2021). Furthermore, the language used for the instructions proved to be a problem and made it more difficult for some users to understand the information on how to use the lenses. This impaired the Perspicuity and Dependability of the lenses because the users had limited control over the interactions, which made it difficult for them to learn how to use the AR lens correctly.
Thus, the interview revealed the usability deficits of the 3 AR lenses tested, which are mainly due to insufficient information about the application. Research has also shown that the non-intuitive usability of a product, in this case the generic branded AR lenses, has a corresponding negative impact on the UX (Davidavičienė et al., 2020; Dirin & Laine, 2018; Labrie & Cheng, 2020; Weichert, 2021).
Additionally, the augmentation quality perceived by the participants must be interpreted, as it also contributes to the UX (Poushneh, 2018; Rauschnabel et al., 2019). Based on the functionality of AR, similar results emerged for mapping quality and object recognition. The positive, average, and negative evaluations of object recognition and the accuracy of depiction do not exclude a corresponding influence on the six scales of the UEQ. Users assume that AR technology accurately detects the objects in their environment that they target with their smartphones, so the ability to detect objects is an important component of AR (Poushneh, 2018; Tschanz & Schart, 2017). Yet, the technology should be able to display the virtual objects faithfully in their intended position; otherwise, the quality of augmentation will be unsatisfactory for the users (Poushneh, 2018). In this way, Stimulation could be compromised because errors in the depiction make AR lenses less stimulating and motivating to users. We cannot exclude influences on other scales of the UEQ on the AR lenses, according to Labrie and Cheng (2020), because the incorrect recognition of surfaces from the environment is associated with possible effects on usability.
An influence of the problems with the augmentation quality for Stimulation could be the reason why the participants considered the generic AR lenses of the brands as less valuable. An examination of the individual items showed that participants’ answers tended toward an inferior evaluation of the lenses (valuable-inferior: -0.1, boring-exciting: 0.9, not interesting-interesting: 0.9, motivating-demotivating: 1.7). However, hedonic qualities achieved a good result (M = 1.10) which figures into Stimulation. Other scales of this quality revealed that participants mainly see the generic branded AR lenses as original and novel (M = 1.35). Interviewees confirmed this by praising the ideas for how a product was promoted or integrated into the AR lenses.
Augmentation quality is also measured by the realistic representation of the virtual content (Rauschnabel et al., 2019), which we did not address further in the survey. Nevertheless, some interviewees commented on the depiction of the digital objects, describing them in some cases as unrealistic. Rauschnabel et al. (2019) showed flawed and unrealistic depiction affects the UX. This is because augmentation quality can, among other things, contribute to the inspiration users might feel, which is why AR content must not only entertain but also be realistically presented. Poor AR depiction can lead to a deficient UX (ibid.). Ibáñez-Sánchez et al. (2022) and Davidavičienė et al. (2020) have already pointed out that the UX of AR is positively influenced by interactivity, and it respectively contributes to user satisfaction with AR filters. Although there was no specific focus on interactivity, according to interviewees, the AR lenses could have offered more interaction elements. Consequently, we assumed interactivity has an impact on the measured UX of the generic branded AR lenses.
Recommendations
Based on the results, we derived recommendations for companies so that AR in the form of lenses or filters can lead to a better UX.
Usability must be addressed to ensure a good UX. The inclusion of appropriate user instructions is crucial to ensure good usability of generic branded AR lenses. Otherwise, certain application options may remain initially hidden from users. This study highlights the importance of displaying the usage information as well as making it visible for a significant duration. If the display must be short, offer other options to allow users to recall the information. If the users do not have sufficient time to read the text and the instructions, they either follow the trial-and-error process or the AR lens must be restarted; both outcomes prevent ease of use (Labrie & Cheng, 2020). Additionally, brands and companies should consider adapting the language to the users. Snapchat provides templates of instructions in a variety of other languages, which allows usage information to be customized depending on the location of the smartphone and its language settings (Snapchat, n.d.). Companies may be able to implement translation using AI for individual instructions (such as for Netflix or Ben & Jerry’s).
In addition to the usability, which has a positive effect on the UX, there are other aspects that companies need to think about if they want to integrate AR lenses as part of marketing or branding on social media, including interactivity (Davidavičienė et al., 2020; Ibáñez-Sánchez et al., 2022). A certain degree of interactivity should be offered to users when they utilize the AR lens. If the content can be interacted with, users learn more about the companies or brands (Flavián et al., 2021). Furthermore, a realistic design or presentation of the AR content must be considered, which increases the feeling of creativity among users (Rauschnabel et al., 2019). It can also be assumed that the realistic presentation of products can lead to a possible incentive to purchase them.
It is important to understand that users’ experience of branded AR lenses is of existential importance to businesses. After all, poorly implemented AR applications can compromise UX and, consequently, could negatively impact the brand (Rauschnabel et al., 2019).
Limitations and Future Work
Although the sample size of 27 participants is within the accepted range (Schrepp, 2019), from a statistical point of view, it is still advisable to study a higher number of participants (Rauschenberger et al., 2013). In addition, due to the imbalance between male and female participants, we must assume that the results of the UEQ are less reliable. Furthermore, user tests took place in a German-speaking area; problems arose due to a lack of language skills that might not occur with all English-speaking participants.
Participants in this study used their personal smartphones for the user test. Thus, hardware, operating systems, the version of the operating systems, and the version of Snapchat were not uniform. We cannot exclude a possible influence of these aspects on the UX. In addition, only 3 generic branded AR lenses were tested, which revealed only some of the ways in which AR games, try-on lenses, and facial or ambient lenses can be implemented on Snapchat.
This paper focused on Snapchat and the UX of the generic branded AR lenses found there. As previously noted, other social media apps offer similar features. A comparison of the UX of (branded) AR filters between two or more social media platforms could be interesting in drawing more explicit conclusions and forming further recommendations for companies. Following this suggestion, researchers could obtain further important insights into the UX of generic branded AR lenses in a study of participants who have no experience with AR lenses.
Another interesting tool to measure the UX of AR filters or lenses would be the UEQ+. This questionnaire offers new scales developed by different authors. For AR, the scales of Intuitive Use or Visual Aesthetics (Schrepp & Thomaschewski, 2019) could be applied to gain deeper insights into the users’ experience with the technology.
If there is interest in exploring usability in more detail, additional equipment, such as an eye-tracking system, might be helpful. For example, an eye-tracking system could help determine whether the application information that is important for use can be read.
Conclusion
Our goal was to find out how the UX of generic branded AR lenses performs on the social media platform Snapchat by using the UEQ and the open interview questions, including a focus on the perceived augmentation quality and usability. The ideas behind the lenses as well as their implementation contribute to the Attractiveness and Novelty of the UX, but complications appear in their usability. As a result, the UX is diminished in its pragmatic qualities, such as usability, and can only achieve below average and poor results compared to the benchmark. In addition, perceived augmentation quality was inconsistent; positive and negative statements emerged. Due to this, the UX of the generic branded AR lenses cannot be described as good. Instead, given the preceding disclosure and interpretation of the results, it is reasonable to conclude that the generic branded AR lenses achieve an average UX.
To offer followers and users a positive UX with AR lenses and filters in the future, it remains to be seen how companies will develop the technology on social media and in general.
Tips for Usability Practitioners
We offer a few recommendations for other UX practitioners testing similar products:
- Before starting the real user test, conduct a pretest with two people. It will help you determine whether participants understand the tasks and questions, if any problems occur while logging in to a test account, and how long it takes to finish the user test.
- Let participants know that their honest opinions and thoughts on the questions are valued. Make it clear that there are no wrong answers.
- When recruiting participants for a user test, provide all relevant information such as length of testing time and which personal devices the participant must bring.
- Include observations from the user test in the interview to find out what exactly happened and how participants felt during that situation.
- When using an English language product with non-native-speaking English participants, do not assume that everyone has the same language skills.
Appendix 1
Socio-Demographic Questionnaire and How Participants Use Snapchat
- Please enter your age.
- Please select your gender
- Male
- Female
- Other
- Current profession
- Pupil
- Student
- Apprentice
- Employed
- Unemployed
- How often do you use Snapchat?
- Daily
- 1-3 times a week
- 1-3 times a month
- Less often
- Snapchat allows you to record your snaps (selfies, photos, and videos) with Augmented Reality Filters (example: see picture). Have you already made use of these kind of filters?

(Source: https://blog.whatchado.com/snapchat-fuer-unternehmen-spielregeln/)
- Yes
- No
- I don’t know
- Why do you use Snapchat? (more than one answer possible)
- To stay in touch with friends (chat, send snaps, etc.)
- To play games
- To watch stories of celebrities/influencers
- To watch videos on Spotlight (similar to TikTok/Reels)
- Other (enter own reason)
Appendix 2: Screenshots of the 3 Tested Generic Branded AR Lenses on Snapchat
Screenshots are from November 4, 2022.
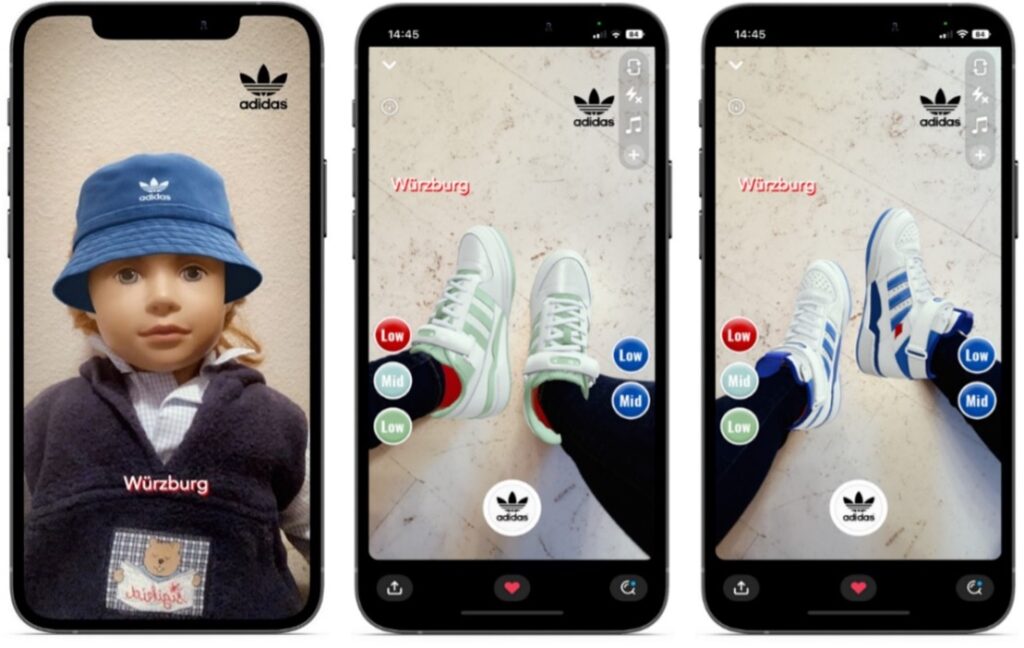
Figure 3. Insight into the different functions using the front and back camera while the Adidas lens Forum Sneaker is activated.
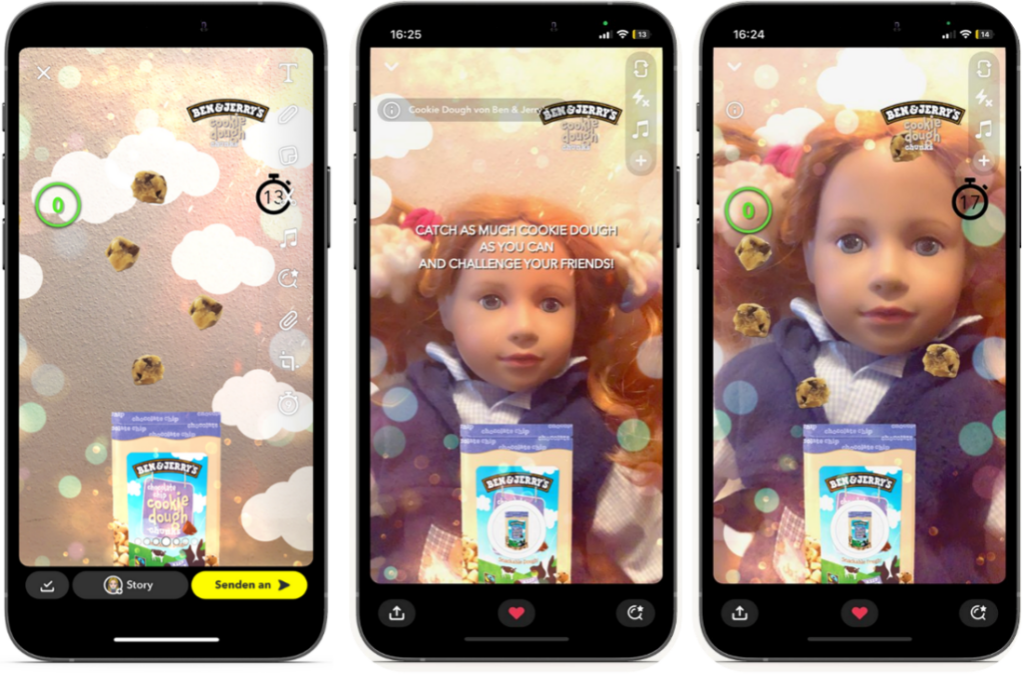
Figure 4. Excerpt of the different views of the Ben & Jerry’s Lens Cookie Dough on Snapchat.
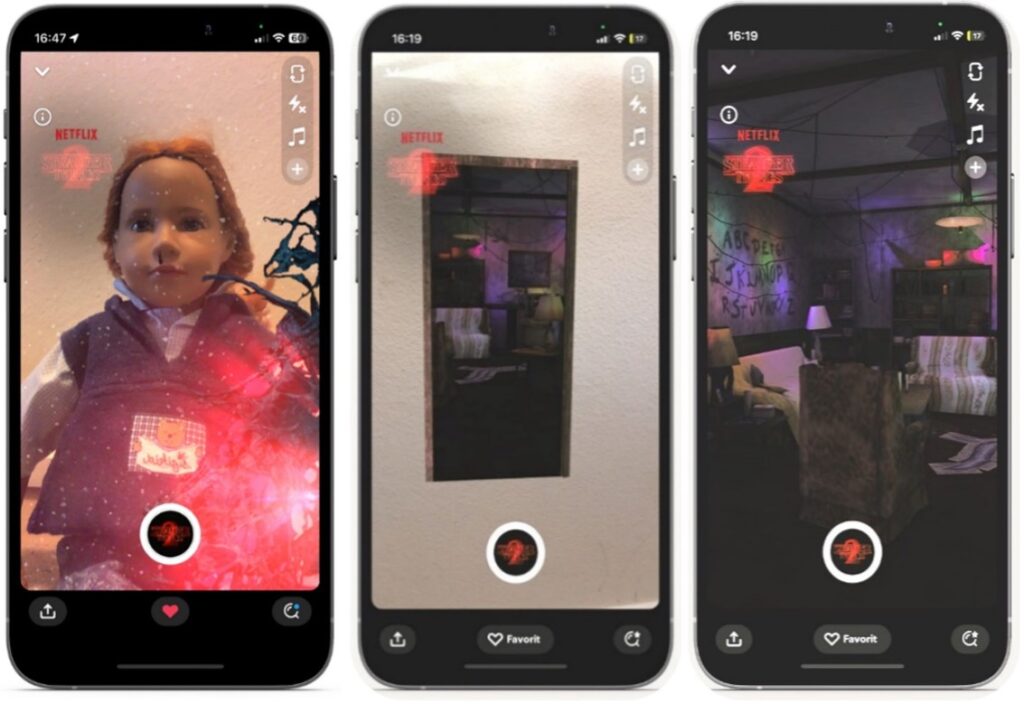
Figure 5. The Stranger Things AR lens by Netflix on Snapchat.
Appendix 3: Information About the Participants of the Study
Table 6. Sociodemographic Information About All Participants in the Study
| Participant (P) | Age | Gender | Occupation | Usage Frequency | Duration of Add. Interview (in minutes) |
| P1 | 26 | female | employed | daily | |
| P2 | 22 | female | student | 1-3 times per week | |
| P3 | 25 | male | student | daily | |
| P4 | 28 | female | employed | 1-3 times a month | |
| P5 | 26 | female | employed | daily | |
| P6 | 25 | female | employed | 1-3 times a month | |
| P7 | 24 | female | employed | daily | 00:13:26 |
| P8 | 37 | male | employed | daily | 00:07:18 |
| P9 | 23 | female | employed | daily | 00:05:00 |
| P10 | 20 | male | student | 1-3 times a week | |
| P11 | 25 | male | student | less often | 00:05:51 |
| P12 | 24 | female | student | daily | |
| P13 | 20 | female | student | daily | |
| P14 | 27 | female | apprentice | daily | |
| P15 | 27 | female | employed | daily | |
| P16 | 21 | female | student | daily | |
| P17 | 27 | male | employed | 1-3 times a week | |
| P18 | 23 | male | employed | daily | |
| P19 | 25 | male | student | less often | 00:07:00 |
| P20 | 26 | female | employed | 1-3 times a month | 00:07:50 |
| P21 | 25 | female | employed | daily | |
| P22 | 20 | female | student | 1-3 times a month | |
| P23 | 26 | male | Student | 1-3 times a week | |
| P24 | 25 | male | employed | daily | |
| P25 | 26 | male | employed | 1-3 times a week | |
| P26 | 24 | male | student | daily | 00:05:10 |
| P27 | 28 | female | student | 1-3 times a month | 00:07:05 |
| P28 | 26 | male | student | 1-3 times a week | |
| P29 | 24 | female | student | daily | |
| P30 | 24 | female | employed | daily | |
| P31 | 24 | female | apprentice | daily |
Appendix 4: Summary of the Findings: UEQ and Interviews
Table 7. Summarized Overview of Findings from the Standardized Questionnaire and Qualitative Interview.
| Findings from standardized questionnaire (UEQ) | Findings from qualitative interviews |
| The generic branded AR lenses convinced the participants with their “above average” Attractiveness. Only in the scale Novelty our results achieved a “good” result in comparison with the benchmark.The remaining scales only scored “below average” or worseThose results are underscored by the independent t-test.Categorizing the scales shows that the pragmatic qualities of the tested AR lenses performed neutrally and that the Attractiveness and hedonic qualities achieved a “good” result. | In general, participants liked the tested AR lenses. Regarding usability, the AR lenses were not always easy to understand because instructions were in English and disappeared after a few seconds.The perceived augmentation quality was not always assessed consistently. Instead, there were positive and negative statements.The depiction of digital objects was not always perceived as realistic.Some interviewees wished for more interactive elements in the lenses. |
References
Appel, G., Grewal, L., Hadi, R., & Stephen, A. T. (2020). The future of social media in marketing. Journal of the Academy of Marketing Science, 48(1), 79–95. https://doi.org/10.1007/s11747-019-00695-1
Azuma, R. T. (1997). A survey of augmented reality. Presence: Teleoperators and Virtual Environments, 6(4), 355–385. https://doi.org/10.1162/pres.1997.6.4.355
Berryman, D. R. (2012). Augmented reality: A review. Medical Reference Services Quarterly, 31(2), 212–218. https://doi.org/10.1080/02763869.2012.670604
Broll, W. (2019). Augmentierte realität [Augmented reality]. In R. Dörner, W. Broll, P. Grimm, & B. Jung (Eds.), Virtual und augmented reality (VR/AR) [Virtual and augmented reality] (pp. 315–356). Springer Berlin Heidelberg.
Carmigniani, J., & Furht, B. (2011). Augmented reality: An overview. In B. Furht (Ed.), Handbook of augmented reality (pp. 3–46). Springer New York.
Cowan, K., Javornik, A., & Jiang, P. (2021). Privacy concerns when using augmented reality face filters? Explaining why and when use avoidance occurs. Psychology & Marketing, 38(10), 1799–1813. https://doi.org/10.1002/mar.21576
Davidavičienė, V., Raudeliūnienė, J., & Viršilaitė, R. (2019). User experience evaluation and creativity stimulation with augmented reality mobile applications. Creativity Studies, 12(1), 34–48. https://doi.org/10.3846/cs.2019.3576
Davidavičienė, V., Raudeliūnienė, J., & Viršilaitė, R. (2020). Evaluation of user experience in augmented reality mobile applications. Journal of Business Economics and Management, 22(2), 467–481. https://doi.org/10.3846/jbem.2020.13999
Decker, A. (2022). Der social-media-zyklus [The social media cycle]. Springer Fachmedien Wiesbaden. https://doi.org/10.1007/978-3-658-34620-1
Deloitte Digital, & Snap Inc. (2021). Snap consumer AR research: Global report 2021. Snap Inc. Retrieved March 2023 from https://downloads.ctfassets.net/inb32lme5009/4Jh1ODwYalSM5VtORhSC9B/8e6ec4bf98015f47d762846b4e5e1170/Snap_Consumer_AR_Research_Global_Report.pdf?lang=en-US
Deutsch, J., & Lanxon, N. (2022, September 28). Snap says augmented reality key to luring luxury buyers online. Bloomberg. Retrieved February 2023 from https://www.bloomberg.com/news/articles/2022-09-28/snap-says-augmented-reality-key-to-luring-luxury-buyers-online
Dirin, A., & Laine, T. (2018). User experience in mobile augmented reality: Emotions challenges, opportunities and best practices. Computers, 7(2), 33. https://doi.org/10.3390/computers7020033
Dodoo, N. A., & Youn, S. (2021). Snapping and chatting away: Consumer motivations for and outcomes of interacting with Snapchat AR ad lens. Telematics and Informatics, 57, 101514. https://doi.org/10.1016/j.tele.2020.101514
Döring, N., & Bortz, J. (2016). Forschungsmethoden und Evaluation in den Sozial und Humanwissenschaften [Research methods and evaluation in the social and human sciences]. Springer Berlin Heidelberg.
Flavián, C., Ibáñez-Sánchez, S., & Orús, C. (2021). User responses towards augmented reality face filters: Implications for social media and brands. In M. C. tom Dieck, T. H. Jung, & S. M. C. Loureiro (Eds.), Progress in IS. Augmented Reality and Virtual Reality (pp. 29–42). Springer International Publishing. https://doi.org/10.1007/978-3-030-68086-2_3
Geyer, B. (2016). Die transkription [The transcription]. In J. Wintzer (Ed.), Herausforderungen in der qualitativen sozialforschung [Challenges in qualitative social research] (pp. 111–119). Springer Berlin Heidelberg.
Hassenzahl, M., & Tractinsky, N. (2006). User experience: A research agenda. Behaviour & Information Technology, 25(2), 91–97. https://doi.org/10.1080/01449290500330331
Hawker, K., & Carah, N. (2021). Snapchat’s augmented reality brand culture: Sponsored filters and lenses as digital piecework. Continuum, 35(1), 12–29. https://doi.org/10.1080/10304312.2020.1827370
Hegemann, L. (2017, July 07). Ein jahr Pokémon Go: Was AR-firmen von der einstigen hype-app lernen können [One year of Pokémon Go: What AR companies can learn from the former hype app]. Retrieved February 2023 from https://t3n.de/news/pokemon-go-augmented-reality-lehren-836312/
Hillmann, C. (2021). UX for XR: User experience design and strategies for immersive technologies. Apress. https://doi.org/10.1007/978-1-4842-7020-2
Ibáñez-Sánchez, S., Orús, C., & Flavián, C. (2022). Augmented reality filters on social media. Analyzing the drivers of playability based on uses and gratifications theory. Psychology & Marketing, 39(3), 559–578. https://doi.org/10.1002/mar.21639
International Organization for Standardization. (2010). Ergonomics of human-system interaction — Part 210: Human-centred design for interactive systems (ISO 9241-210:2010(en)). Retrieved February 2023 from https://www.iso.org/obp/ui/#iso:std:iso:9241:-210:ed-1:v1:en
Janke, K. (2022, April 08). ‘AR ist wahnsinnig sticky’ Snapchat: Deutschlandchef Götz Trillhaas über die Gen Z, Augmented Reality und das Werbegeschäft der Social-Media-Plattform [“AR is incredibly sticky” Snapchat: Germany boss Götz Trillhaas on Gen Z, augmented reality and the social media platform’s advertising business] (pp.14-15). dfv Mediengruppe. Horizont [DFV media group. Horizon.]. Retrieved February 2023 from https://search.ebscohost.com/login.aspx?direct=true&db=edswis&AN=edswis.HOR20220407595010&lang=de&site=eds-live&scope=site
Kemp, S. (2022). Digital 2022: Global overview report. Datareportal. Retrieved October 2022 from https://datareportal.com/reports/digital-2022-global-overview-report
Kemp, S. (2023). Essential Snapchat statistics and trends for 2023. Datareportal. https://datareportal.com/essential-snapchat-stats?rq=snapchat
Labrie, A., & Cheng, J. (2020). Adapting usability heuristics to the context of mobile augmented reality. In S. Iqbal (Ed.), Adjunct proceedings of the 33rd Annual ACM Symposium on user interface software and technology (pp. 4–6). Association for Computing Machinery. https://doi.org/10.1145/3379350.3416167
Lammenett, E. (2021). Praxiswissen online-marketing [Practical knowledge of online marketing] (Vol. 8). Springer Fachmedien Wiesbaden.
Lamnek, S., & Krell, C. (2016). Qualitative sozialforschung: Mit online-materialien [Qualitative social research: Using online materials] (6th ed.). Ciando Library. Beltz.
Laugwitz, B., Held, T., & Schrepp, M. (2008). Construction and evaluation of a User Experience Questionnaire. In A. Holzinger (Ed.), Lecture notes in computer science. HCI and Usability for Education and Work (Vol. 5298, pp. 63–76). Springer Berlin Heidelberg. https://doi.org/10.1007/978-3-540-89350-9_6
Mayer, H. O. (2013). Interview und schriftliche befragung: Grundlagen und methoden empirischer sozialforschung [Interview and written survey: Basics and methods of empirical social research] (6th ed.). De Gruyter.
Mühlfeld, C., Windolf, P., Lampert, N., & Krüger, H. (1981). Auswertungsprobleme offener interviews [Evaluation problems of open interviews]. Soziale Welt [Social World], 32(3), 325–352. http://www.jstor.org/stable/40877322
Phua, J., & Kim, J. (2018). Starring in your own Snapchat advertisement: Influence of self-brand congruity, self-referencing and perceived humor on brand attitude and purchase intention of advertised brands. Telematics and Informatics, 35(5), 1524–1533. https://doi.org/10.1016/j.tele.2018.03.020
Poushneh, A. (2018). Augmented reality in retail: A trade-off between user’s control of access to personal information and augmentation quality. Journal of Retailing and Consumer Services, 41, 169–176. https://doi.org/10.1016/j.jretconser.2017.12.010
Rauschenberger, M., Schrepp, M., & Thomaschewski, J. (2013). User experience mit fragebögen messen: Durchführung und auswertung am beispiel des UEQ [Measuring user experience with questionnaires: Implementation and evaluation using the example of the UEQ]. Tagungsband UP13 [Proceedings UP13], 72–77.
Rauschnabel, P. A., Felix, R., & Hinsch, C. (2019). Augmented reality marketing: How mobile AR-apps can improve brands through inspiration. Journal of Retailing and Consumer Services, 49, 43–53. https://doi.org/10.1016/j.jretconser.2019.03.004
Santoso, H., Schrepp, M., Kartono Isal, R. Y., Yudha Utom, A. & Priyogi, B. (2016). Measuring the user experience. The Journal of Educators Online, 13(1), 58-79. https://doi.org/10.9743/JEO.2016.1.5
Saunders, M. N. K., Lewis, P., & Thornhill, A. (2021). Research methods for business students (8th ed.). Pearson Education Limited.
Schrepp, M. (2019). User Experience Questionnaire handbook. ResearchGate.
Schrepp, M., Hinderks, A., & Thomaschewski, J. (2017a). Construction of a benchmark for the User Experience Questionnaire (UEQ). International Journal of Interactive Multimedia and Artificial Intelligence, 4(4), 40-44. https://doi.org/10.9781/ijimai.2017.445
Schrepp, M., Hinderks, A., & Thomaschewski, J. (2017b). Design and evaluation of a short version of the User Experience Questionnaire (UEQ-S). International Journal of Interactive Multimedia and Artificial Intelligence, 4(6), 103-108. https://doi.org/10.9781/ijimai.2017.09.001
Schrepp, M., & Thomaschewski, J. (2019). Construction and first validation of extension scales for the User Experience Questionnaire (UEQ). ResearchGate. https://doi.org/10.13140/RG.2.2.19260.08325
Shontell, A. (2015, September 15). Snapchat is letting users pay $.99 to replay disappearing snaps, and it just added a ‘lens’ feature to animate your selfies. Retrieved February 2023 from https://www.businessinsider.com/snapchat-adds-lenses-and-paid-replays-2015-9
Snapchat (n.d.). Frequently asked questions. Retrieved March 2023 from https://docs.snap.com/camera-kit/faq#q-in-lens-studio-can-i-specify-a-hint-in-the-project-info
Stumpp, S., Michelis, D., & Schildhauer, T. (Eds.). (2021). Social media handbuch: Theorien, methoden, modelle und praxis [Social media handbook: Theories, methods, models and practice]. Nomos Verlag.
Stumpp, S., Willems, K., & Michelis, D (2022). Die optimierung der usability von mobilen applikationen [Optimizing the usability of mobile applications]. Wirtschaftsinformatik & Management [Business Informatics & Management], 14, 314–324. https://doi.org/10.1365/s35764-022-00430-6
Stumpp, S., Knopf, T., & Michelis, D. (2019). User experience design with augmented reality (AR). In Proceedings of the ECIE 2019 14th European Conference on Innovation and Entrepreneurship, 1032–1040. DOI:10.34190/ECIE.19.019
Thüring, M. (2013). Nutzererleben: Komponenten, phasen, phänomene [User experience: Components, phases, phenomena]. In S. Maaß, S. Boll-Westermann, & R. Malaka (Eds.), Workshopband Mensch & Computer 2013 [Workshop Volume Man & Computer] (pp. 113–120). Oldenbourg Verlag. https://doi.org/10.1524/9783486781236.113
Tschanz, D., & Schart, N. (2017). Augmented und mixed reality [Augmented and mixed reality]. UVK Verlagsgesellschaft mbH. https://doi.org/10.24053/9783739803845
Weichert, S. (2021). Quick guide UX management: So verankern sie usability und user experience im unternehmen [This is how you anchor usability and user experience in the company] (2nd ed.). Springer Gabler.