
Abstract
Vibrotactile stimulation is becoming an increasingly integrated modality in multimedia experiences through wearable haptic devices in consumer products like smartwatches and VR controllers. Yet, their effectiveness is limited by our understanding of how users perceive vibrotactile feedback in real-world applications. Just as the advancements in haptic technology are crucial for improving fidelity, optimizing existing systems through psychophysics offers an alternative to enhance wearable implementations.
In this study, we explored perceptual variables associated with vibrotactile perception on participants’ dorsal forearms, a common location for wearable haptic applications. We conducted three user studies to map the forearm with varying stimulus parameters and locations; this included a pilot study to confirm the relationships between vibrotactile stimulus parameters and the subjective perceptual variables reported in a previous study. Then, we tested detection thresholds and localization accuracy at evenly spaced locations along the dorsal forearm. Our results showed that users’ vibrotactile detection sensitivity decreased along the dorsal forearm, from the wrist to the elbow. Thereafter, we investigated just-noticeable differences (JNDs). JNDs did not change significantly along the users’ forearms, but we found a subtle difference between the lower and upper forearm in detecting decreases versus increases in amplitude. Our study suggests that the fidelity of haptic applications can be enhanced by calibrating signals to perceptual limits to attain a higher level of perceptual resolution in wearable haptic systems.
Keywords
haptics, perception, vibrotactile perception, wearable haptics, perceptual thresholds, detection, discrimination, just-noticeable difference, localization, mapping, adaptation, masking
Introduction
Haptic technologies allow us to perceive media through our sense of touch. Current advancements in haptics technology, which allow for the incorporation of this modality in a wearable form, have factored into multimedia environments such as cinema experiences (Lemmens et al., 2009), gaming (Tindale et al., 2014; Zhu et al., 2020), and training (Gani et al., 2022; Umek et al., 2015). Yet, despite the considerable diversity of wearable haptic feedback systems, the quality of haptic experience has not relied solely on the type or state of the technology; consider, for example, electrotactile (Kourtesis et al., 2022), thermotactile (Singhal & Jones, 2017), pneumatic systems (He et al., 2015), and mid-air ultrasonics (Lum et al., 2022). User factors are crucial in how haptic feedback is perceived as they determine the success of the experience. Some studies have shown that haptics can enhance a perceptual experience (Alma et al., 2021; Arafsha et al., 2015; Gatti et al., 2017; Vicentini & Botturi, 2010). But in certain conditions, haptics have become detrimental to experience, such as when haptic feedback has a delay relative to visual information (Ferrari & Hu, 2011), when multiple actuators create dispersed sensations (de Vlam et al., 2023), or when conflicting sensory feedback disrupts adaptation (Scheidt et al., 2000). To this end, in this study, we explored the fundamental perceptual variables to understand the user factors that guide the improvement of wearable haptic systems. This understanding is crucial for designers creating notification systems, navigation aids, and immersive experiences that rely on haptic feedback.
In most cases, haptic systems have relied on vibrotactile sensation, that is, our ability to detect and interpret vibration through the skin. There are multiple factors that influence how these sensory inputs may be perceived. To begin with, the location of the stimulus is one of these factors; our ability to perceive is not constant across the body due to differences in innervation characteristics (Wheat & Goodwin, 2001). The distal parts of the extremities have a higher acuity than the proximal parts. A scaling of perceptual thresholds is observed from the hands to the upper arm (Ackerley et al., 2014). In addition to location, other physiological variables such as hair density of the skin area (Ævarsson et al., 2022; Jönsson et al., 2017), the physical positioning of the body part (Smith et al., 2022), and the age of the participant (Verrillo, 1980; Lindsay et al., 2024) have been shown to influence perceptual ability. Studies have demonstrated that factors associated with haptic implementation, such as contact size (Tremblay et al., 2005) and contact force (Lee et al., 2024), also modulate vibrotactile sensitivity. These human-factors variables directly inform user experience design decisions including where to place haptic actuators in wearables, how to calibrate notification intensities for different users, and how to create distinguishable haptic patterns for user interfaces.
Furthermore, some studies’ designs have modulated tactile perception through cross-modal interactions and attentional modulation, such as by coupling haptics with other sensory modalities like visual and auditory cues (Ferrari & Hu, 2011; Meftah et al., 2002; Whang et al., 1991). Last, the choice of psychophysical testing methods affects threshold measurements (Morioka & Griffin, 2002). All these factors, together, have contributed to a low level of replicability in estimating perceptual properties due to an extensive number of variables that need to be controlled in experimentation (Hatzfeld et al., 2016; Mikkelsen et al., 2020; Whitehouse & Griffin, 2002). Therefore, it becomes crucial to map the psychophysical properties specific to wearable haptic implementations. Doing so lets us reveal how haptic feedback systems can be improved within a use case.
In our study, we aimed to overcome these challenges through systematic experimental control. To validate our approach, we conducted a pilot study to establish our experimental setup and reproduce previously reported subjective relationships between vibrotactile stimulus parameters and induced perception. To minimize cross-modal interactions, we isolated the tactile modality using noise-canceling headphones and visual occlusion of the arm. We used standardized psychophysical methods (Yes/No detection as well as 2AFC discrimination), and we maintained a consistent experimental setup throughout all studies.
In the series of our studies, we tested perceptual variables along the dorsal forearm at evenly distributed locations, mostly confined to an area innervated by the posterior antebrachial cutaneous nerve. We specifically tested vibrotactile detection thresholds, source localization performance, and just-noticeable differences. By constraining our investigation to this specific anatomical region, which is commonly used for wearable haptic implementations, we established reliable baseline measurements that future researchers and designers can reference. Eventually, our observations can be modeled to represent the skin across the body and set perceivable ranges for vibrotactile signals that correspond to body locations.
Methods
Setup
Our study’s setup consisted of an Arduino™ Uno™ controller, a breadboard, and eccentric rotating mass (ERMs) motors to deliver the haptic stimuli. Visual stimuli consisted of a black screen with instructions written with Psychophysics Toolbox Version 3 (Brainard, 1997) in MATLAB® 2023a. In each trial, Arduino was triggered within the custom script to deliver the pulse width modulation (PWM), or an On signal, to drive the ERMs. For the purposes of this paper, we used MATLAB for plotting and Adobe® Illustrator® to compile figures.
Study Design
Pilot Study
We designed a pilot study to establish our experimental setup, the behavioral paradigm, and the basic parameters for vibrotactile stimuli using an ERM motor (1G) (Figure 1A) on 4 single locations on the middle of the dorsal forearm. We recruited 6 participants, and 1 participant was discarded due to low performance in the task. The mean age of participants was 28.4 years old (standard error of the mean (SEM) = ±0.24). Before the pilot study session, participants underwent a short training session designed to familiarize them with the task. The training session consisted of an array of vibrations at 4 levels of amplitude and frequency, covering both the minimum and maximum ends of the stimulus array. The trial structure had three phases: a 1 s blank and a 2 s vibration, followed by a 1 s blank. The study session consisted of 8 amplitude and frequency levels (Figure 1B) within 192 trials. A crosshair was presented on the center of a black screen during vibration stimulation to indicate the duration of the stimulus. Although the crosshair is a visual element in the study, it served only as a temporal reference for participants, as successful participants responded only to the tactile stimulus and not to the presence of the crosshair. After participants reported a vibration by pressing a key on a keyboard, they were prompted with two questions on screen regarding the intensity and continuity of the stimulus (Figure 1C). These were rated on a 1-5 Likert scale, in which 1 represented the weakest or most discrete stimulus, and 5 represented the strongest or the most continuous stimulus. We attached the ERM motor to each participant’s dominant hand with a strap in all sessions.
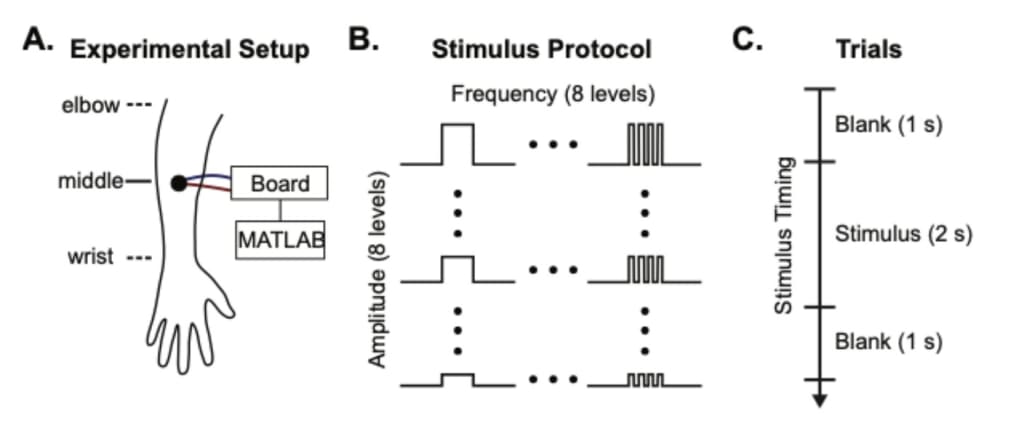
Figure 1. A. The experimental setup. The vibration motor was placed on the middle of the forearm. This motor was plugged into a microcontroller board and triggered by MATLAB. B. The study session had 8 amplitude and frequency levels generated using PWM, totaling 64 unique combinations of amplitude and frequency. The study session consisted of 8 amplitude levels, 8 frequency levels, and 3 repetitions to total 192 trials (Table 1). C. Every trial started with a 1 s blank and 2 s vibration, followed by a 1 s blank.
Study 1
In this study, we examined the detection thresholds and stimulus localization accuracy along the forearm. We used a within-subjects design, in which each subject participated in testing at all forearm locations. Four ERM motors (3G) were placed at evenly distributed locations on their forearms, from wrist to elbow, excluding the actual wrist or elbow areas (Figure 2A). Each session had 8 levels of amplitude (Figure 2B). Every trial started the same as the pilot study with a 1 s blank and a 2 s vibration, followed by a 1 s blank (Figure 2C). Participants were given noise-canceling headphones (Focal™ Bathys), and the forearm was covered under a box to prevent distraction. They were instructed to press a key on a keyboard to report if they perceived a vibration, following a Yes/No methodology. Upon detection, they were asked to identify on screen which of the 4 ERM motors was vibrating. Before the study session, participants completed a training session. This session was intended to help them become familiar with the task, particularly in identifying the source of the vibration, to ensure that participants could accurately localize the vibrations during the experiment. Twenty-three participants underwent this study session. Three participants were excluded due to low task performance, resulting in a final sample of 20 participants (14 men and 6 women). The mean age was 26.84 years old (SEM = ±0.51), and the age range was 22–29 years old.

Figure 2. A. An illustration of the forearm shows where the vibration motors were placed on the forearm. Each participant’s forearm was visually divided into 5 sections, and every actuator was placed between these sections. The actuators were numbered from the wrist to the elbow. The motors were plugged into a microcontroller board and triggered by MATLAB. B. The vibration stimulus had 8 amplitude levels; the frequency was kept constant at the highest frequency available in the hardware, shown as a blank square signal. C. The session consisted of 128 trials with 4 repetitions for each amplitude level. The trials consisted of a 1 s blank and a 2 s vibration, followed by a 1 s blank.
Study 2
In Study 2, we tested vibrotactile discrimination thresholds along the forearm. The experimental setup was identical to Study 1. In this study as well, we used a within-subjects design, in which each subject participated for testing on all the 4 forearm locations. We used a method of constant stimuli, in which the reference was 2.1 G force, and the target stimuli were 5, 10, 20, and 30% higher or lower than the reference stimulus. The increasing or decreasing conditions were random and counterbalanced (Figure 3A). The trial structure was slightly different; each trial started with a 0.5 s blank screen, followed by 2 s of stimulus (reference or target), 2 s of stimulus (reference or target), and an intensity comparison question (trend of the intensity, that is, increasing or decreasing), following the two-alternative forced choice (2AFC) method (Figure 3B). A similar pre-experiment training session was conducted to prevent participant errors related to the procedure. In this study, we recruited 18 participants. Their age range was 22–29 years (M = 26.71, SEM = ±0.69).
All participants in all the studies had normal or corrected-to-normal vision for visual instructions and had no history of skin-related disorders or neurological conditions. All studies were conducted in accordance with the Declaration of Helsinki.
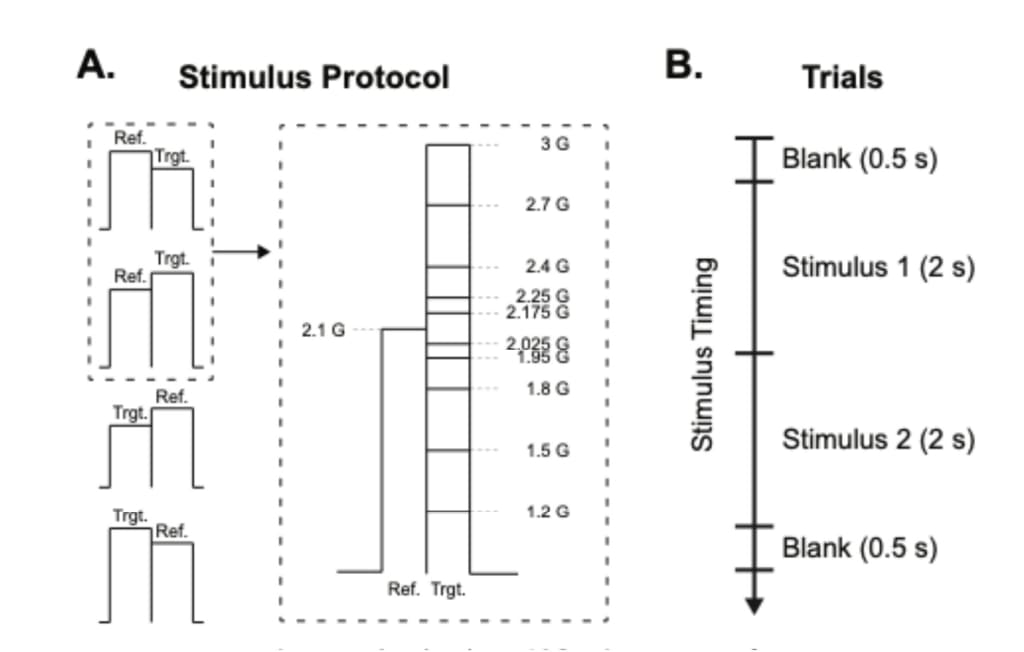
Figure 3. A. Vibrotactile stimuli consisted of a reference and a target vibration. The order of the stimuli was randomized; in half of the trials, the reference came first, whereas in the other half, the target came first. The reference was at a fixed amplitude, whereas the amplitude of the target was either a lower or higher amplitude. The dashed area on the left of the figure demonstrates the case in which the reference stimulus was sent first. The target stimulus was either lower or higher than the reference stimulus. The dashed area on the right of the figure shows the case in which a stimulus pair started with a reference and continued with the target. The reference vibration was 2.1 G throughout the experiment, whereas the target vibration was varied on 10 levels of amplitude, which is 5 levels in absolute difference to the reference. B. The trials started with a 0.5 s blank, followed by 2 s of either target or reference vibration, followed by the remaining stimulus type. After the stimulus, participants reported if the intensity increased or decreased within 4 s. The trial ended with a 0.5 s blank. The session included 4 forearm locations, and 10 amplitude differences for each location (5 increments and 5 decrements around the 2.1 G reference) with 4 repetitions, totaling 160 trials per participant.
Data Collection, Analysis, and Inclusion Criteria
Behavioral responses were saved, analyzed, and visualized using custom MATLAB scripts. We calculated a comparative just-noticeable difference score (cJND) to evaluate biases for the detection of increasing versus decreasing stimuli as follows:

JND↓ and JND↑ represent the just-noticeable differences for decreasing and increasing stimuli, respectively.
In the pilot study, the relationship between variables was assessed using a non-parametric correlation method, Spearman’s correlation. We combined all the data across participants and frequencies to estimate the relationship between amplitude and perceived intensity, or reaction time. This pooling method was applied to estimate the correlation between frequency and perceived continuity. In this case, we defined exclusion criteria as failing in the task to detect the highest amplitude stimulus above the perceptual threshold. The discarded participant reported detecting the lowest stimulus amplitude 95% of the time, despite being below the perceptual threshold.
To estimate the perceptual thresholds, we used psignifit 4 toolbox (Schütt et al., 2016). In Study 1, we used a Yes/No response structure, in which participants reported if they felt a vibration on their forearm. We defined a stimulus as being perceptible in cases in which it excites the sensory receptors, propagates to the brain, and the organism is consciously aware of it. Following this logic, an ideal observer (for example, an artificial sensory receptor without noise) would respond only “No” to the inputs below the perceptual threshold, in which the stimulus is weaker than required for activation. Alternately, this observer would only respond “Yes” to inputs above the threshold. Then this relationship could be presented as step function. However, perceptual responses of real observers are noisy. This leads to an S-shaped (sigmoid) function where the threshold can be taken as the weakest perceptible stimulus above the chance of guessing (that is, 50%). Therefore, in our study, we took 50% correct performance as the absolute vibration detection threshold. We detected outlier performance at each location and discarded the participants whose responses deviated by 3 standard deviations at any location. Then, the participant responses were pooled together by location to fit the psychometric curves. The data points in the scatter plots are from psychometric curve fits per participant at each stimulus location. We used a non-parametric test, the Friedman test, to estimate the effect of location on detection thresholds, and the Tukey method for post-hoc analysis to compare the groups. We converted the detection thresholds across locations into a percent change by taking the threshold at the first location as the baseline, subtracting from other locations, and dividing by it. This allowed us to visualize the relative differences in sensitivity across locations per participant. To calculate the localization accuracy, we only used trials in which participants already detected a stimulus. We tested whether the stimulus’s location affected localization performance using a Friedman test.
In Study 2, 75% of the correct response was the discrimination threshold. To detect low performance in this task, we reviewed the accuracy rates for each participant’s highest and lowest amplitude changes at every forearm location. We discarded the location per participant when discrimination was easy, yet the participant failed to respond correctly (below 75%), or in the case the discrimination task was challenging, but the participant showed a high accuracy (above 75%). We calculated a JND comparison score by subtracting the absolute value of detecting decreasing and increasing stimuli and dividing this by their sum. We split the stimulus locations into the lower and upper forearm by pooling the first two and last two locations. We compared mean JND comparison scores in upper and lower arm locations with the Wilcoxon signed rank test (Wilcoxon, 1945).
Across all studies, low performance was operationalized as either abnormally high accuracy reporting sub‑threshold stimuli, abnormally low reports of supra‑threshold stimuli, or psychometric‑curve thresholds that deviated by at least three standard deviations. Datasets meeting these criteria were removed at the participant level for detection studies and at the participant‑location level for the discrimination study. For instance, in the discrimination study, 312 trials of 2752 were discarded.
A total of 23 unique participants took part in the project. The pilot study included 5 participants; Study 1 included 18, 3 of whom had also completed the pilot; Study 2 included 20, of whom 15 had taken part in Study 1 and 4 had also completed the pilot. To mitigate any carry‑over or learning, the time gap between studies was kept at 2–4 weeks. Each experiment used distinct tasks or stimulus sets.
Results
We first performed a pilot study investigating the perceptual variables of amplitude and frequency in the middle section of the dorsal forearm. In accordance with Yoo et al.’s (2022) previous results, we observed a significant positive relationship between perceived intensity and amplitude (Spearman’s correlation (SC), r(541) = 0.78, R²= 0.6084, p < 0.001) (Figure 4A). Next, we observed that higher amplitude stimuli were associated with lower reaction times, as previously reported (Peon & Prattichizzo, 2013), however with a weak effect size (SC, r(541) = −0.17, R² = 0.03, p < 0.001) (Figure 4B). We also observed that a higher frequency of stimuli correlated with a lower perceived intensity score, although, the effect size was smaller (SC, r(541) = −0.35, R² = 0.12, p < 0.001) (Figure 4C). Overall, these results reproduced previous reports on subjective perceptual parameters and confirmed the validity of our experimental setup. Even though higher frequency levels yielded a lower perceived intensity, low-level frequencies were associated with a discontinuous perception for haptic feedback (SC, r(541) = 0.70, R² = 0.50, p < 0.001) (Figure 4D). In the following studies, we modified only amplitude and kept frequency at the highest level due to this observation to avoid introducing double percept. In addition, to avoid triggering different types of tactile receptor populations in the skin, we wanted to confine our stimulation protocol to a single frequency (Mahns et al., 2006; Talbot et al., 1968). This approach simplified our study design and ensured our measurements were specific to amplitude differences.
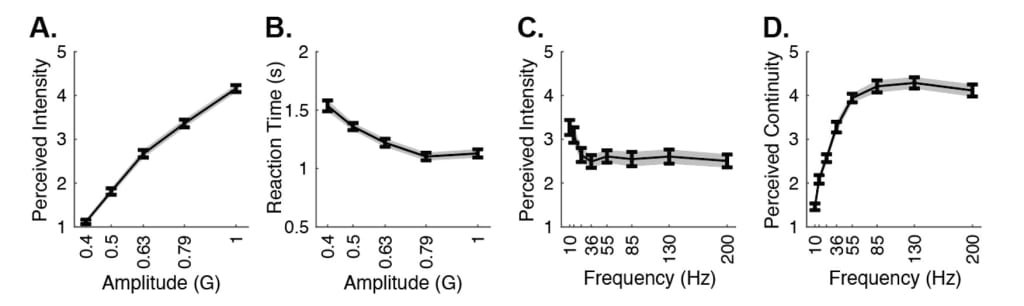
Figure 4. A. Average perceived intensity ratings for amplitude levels from 0.4 to 1G. Gray shaded areas show the standard error of the mean, as calculated by the standard deviation divided by the square root of the number of data points. B. Average reaction times for amplitude levels from 0.4 to 1G. C. Average perceived intensity ratings for frequency levels from 10 to 200 Hz. D. Average perceived continuity ratings for amplitude levels from 10 to 200 Hz.
Detection Thresholds Along the Dorsal Forearm
We explored vibrotactile sensitivity across 4 locations on the forearm by evenly placing 4 vibration motors along the dorsal surface (Figure 3A). In our study design, the distance between actuators was relative to the participant’s arm length, allowing us to test perceptual thresholds personalized to each participant’s forearm length.
Based on the previously established results from earlier studies, we expected to find a sensitivity gradient, with the area adjacent to the wrist exhibiting lower detection thresholds than the area adjacent to the elbow. To assess the perceptual thresholds among these 4 locations, we fitted psychometric curves for each participant to individually detect and discard outliers from our dataset. We fitted a psychometric curve on the data and investigated the detection thresholds across the arm locations (Figure 5A). We found that the detection thresholds increased over this axis, showing that the sensitivity to vibrotactile stimuli decreases along the dorsal forearm from the wrist to the elbow location (α: detection threshold, CI: confidence interval, αL1 = 0.62, CI = [-0.04, 0.04]; αL2 = 0.66, CI = [-0.04, 0.04]; αL3 = 0.68, CI = [-0.04, 0.04]; αL3 = 0.77, CI = [-0.05, 0.04]) (Table 2; Figure 5B). We observed that detection thresholds increased across the forearm locations (Friedman test: FT, χ2(3, 36) = 9.4651, p < 0.05) (Table 3). A post-hoc comparison showed that only the first and last location had a meaningful difference in detection thresholds (MR: Mean rank, SE: standard error, MRL1 = 1.85, SEL1 = ±0.36; MRL₄ = 3.23, SEL4 = ±0.36, p < 0.05) (Table 4). Next, we calculated the percentage change of detection thresholds across these locations by taking the first location as a baseline and calculating the percent change in comparison to other locations. By doing that, we visualized the relative shift in sensitivity per participant. We observed that the detection thresholds at the last location were, on average, approximately 21% higher than at the first location near the wrist (MRL₄ = 20.85%, SEL4 = ± 6.07%) (Figure 5C; Table 5). Overall, we observed that the detection thresholds increased from lower to higher forearm locations; although, only the first and last location thresholds were significantly different.
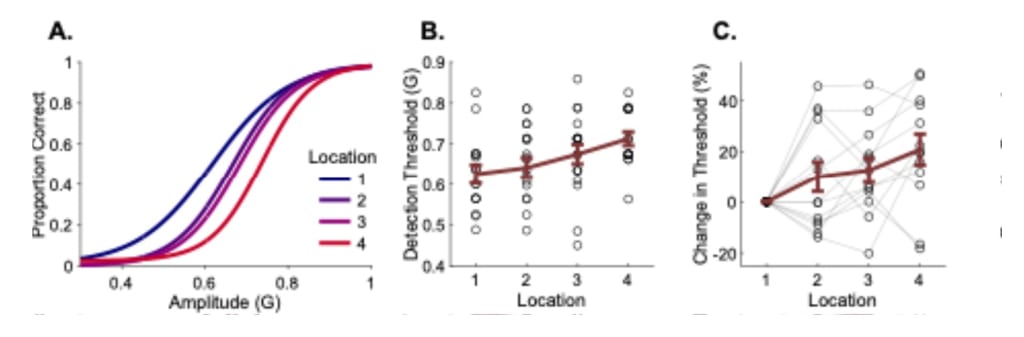
Figure 5. A. The fitted logistic curve on psychometric data indicates the accuracy of detection for all participants at 4 forearm locations (Table 2). B. Average detection thresholds of all participants at 4 forearm locations; scatter plot refers to participant data. Error bar represents the standard error of the mean (Table 6). C. Change in detection thresholds for each participant across forearm locations (Table 5).
Previous studies suggested that localization ability is separate from detection in vibrotactile sensation (Harris et al., 2004), and localization does not need to follow similar observed changes along the forearm. Indeed, localization ability was reported to be higher near the wrist and elbow areas than the middle forearm, although Yeganeh et al. (2023) used a different type of actuator. In our study, to reveal if the detection thresholds across the forearm relate to the ability to localize the stimulus location, we pooled participant responses at discernible amplitudes at each location. We did not observe a pattern that shows a separation between the forearm locations in localization performance with amplitudes above the detection threshold (Figure 6A). When we pooled the data in different locations, we did not find an effect of forearm location on localization performance (FT: χ2(3, 36) = 2.63, p = 0.45) (Table 7; Figure 6B). Although we observed that the first and the last location had slightly higher localization performance than the nearby location (ML1 = 0.67, SEL1 = ±0.06, ML2 = 0.63, SEL2 = ±0.06, ML3 = 0.67, SEL3 = ±0.06, ML4 = 0.72, SEL4 = ±0.06) (Table 8), post-hoc comparison did not show a significant difference among these locations (Table 9). This demonstrates that the increase in detection thresholds along the forearm does not directly relate to the localization accuracy, as the ability to localize the stimulus does not change across forearm locations.
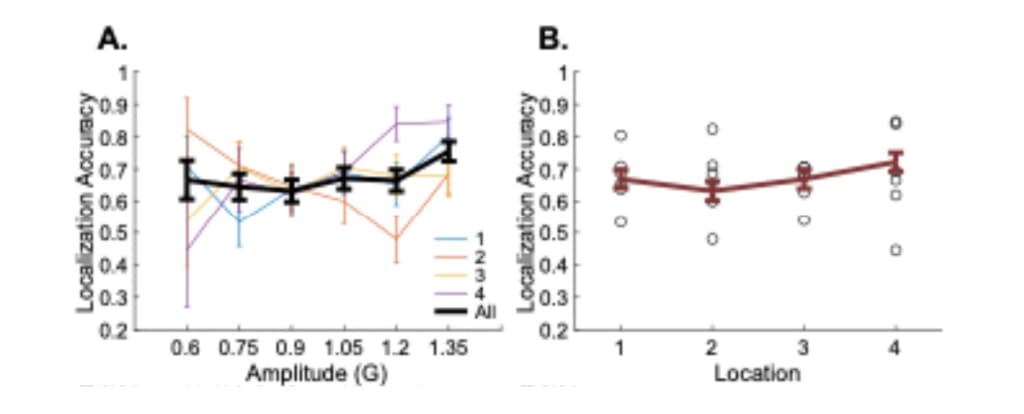
Figure 6. A. Localization accuracy across amplitude levels for forearm locations separately (colored lines) and their average in black line. B. Localization accuracy for forearm locations. The red line shows the average localization accuracy per location. Circles show the localization accuracy for different amplitude levels (Table 8).
Discrimination Thresholds Along the Forearm
Following our initial studies, we designed a new study investigating the JNDs along the forearm. At first, we estimated the average JNDs across four forearm locations (Figure 7A). We did not find a main effect of forearm location in average JNDs (FT, χ2 (3, 33) = 0.90, p = 0.82) (Table 10). To further analyze if there was a bias for lower and upper JNDs across the locations, we estimated JNDs separately for the amplitude decrease and increase conditions (Figure 7B). We then calculated the difference between the JNDs for increases and decreases for each forearm location to quantify if there was a bias for detecting increases or decreases. In this metric, negative values refer to a higher threshold for detecting amplitude decrease (that is, the decrement JND), whereas positive values refer to a higher discrimination threshold for increases. We observed that the relative difference between the increment and decrement JNDs varied across locations (comparative JND score, cJNDL1 = -0.13, SEML1 = ±0.10, cJNDL2 = -0.18, SEML2 = ±0.15, cJNDL3 = 0.01, SEL3 = ±0.13, cJNDL4 = 0.09, SEML4 = ±0.07) (Table 11). When we combined lower and upper forearm JND difference scores together, we observed that the upper forearm had higher values than the lower forearm (WSR: Wilcoxon signed rank test, cJNDlower = -0.17, SEMlower = ±0.10, cJNDupper = 0.05, SEMupper = ±0.09, WSR: z = -2.16, p < 0.05) (Figure 7C). This is consistent with our initial observation in detection thresholds, in which pairwise comparison of forearm locations was only significant between the first and last actuator locations. This result supports that sensitivity to amplitude differences within the forearm region is not entirely uniform, yet the amount of change is not drastic.
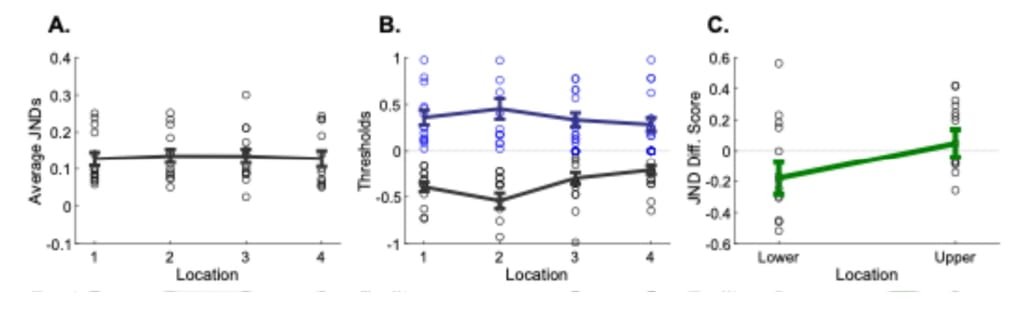
Figure 7. A. Average discrimination thresholds at every location. Circles show JNDs per participant at the forearm location. B. The discrimination thresholds split into detecting a decrement or an increment, the black line and blue line, respectively. Circles show JNDs per participant. C. JND difference scores for lower and upper parts of the forearm.
Discussion
Despite the progress in wearable haptic technologies, haptic systems still do not offer fine-grained perceptual experiences that match the user’s perceptual abilities. Therefore, designing discernible stimuli within perceptual range is essential for high-fidelity haptic implementations (Vicentini & Botturi, 2010). In this study, we aimed to investigate these properties in healthy young adults to improve haptic implementations.
We first tested the relationship between the vibrotactile stimulus parameters and subjective scores of intensity and continuity for the stimulus. In alignment with previous studies (Hwang et al., 2012), we found a positive relationship between amplitude level and perceived intensity, frequency level, and perceived continuity. After evaluating these results, we used only different amplitude levels to estimate perceptual thresholds in the following studies.
In Study 1, we tested the lower limits of vibrotactile perception along the forearm to investigate if sensitivity decreased along distal to proximal forearm areas. We demonstrated that the detection thresholds increase as the stimulus moves from the lower to the upper forearm (Figure 2E). The underlying mechanism for the increasing detection thresholds along the forearm is argued to be the density of mechanoreceptors in the skin. Particularly, in our case, we used a high-frequency level of vibration (200 Hz, at maximum 12k RPM ERM motor), which we expect to transduce mainly through deep Pacinian corpuscles (Sahai et al., 2006). These cutaneous receptors were reported to have a higher density in the distal than proximal parts of the extremities, which may be driving the shift of thresholds along the forearm (Corniani & Saal, 2020).
Next, we calculated the localization accuracy along the forearm after detection occurred (Harris et al., 2006). In our results, we did not observe a meaningful change in localization accuracy at the amplitude levels above the detection threshold. In contrast to some previous studies, we did not observe an improved localization accuracy at the first and last stimulation sites (Wong et al., 2010; Yeganeh et al., 2023). Overall, the localization accuracy did not change across forearm locations, supporting the idea that localization may rely on different mechanisms. In our study, we scaled actuator positions to each participant’s forearm and placed the first and the last actuators at 20% and 80% of the participants forearm length. This strategy avoided direct stimulation of the joints and anchor points around the forearm. Our two-step experimental protocol omitted localization of subthreshold stimulus, as the participants had to detect the stimulus and only then were prompted to localize it. Because we analyzed localization only on trials above the detection threshold, variance from low-confidence guesses was likely omitted in our experimental design. We used ERM motors driven at a single high frequency and varied the amplitude only, while others relied on brief bursts. Those short pulses may favor anchor sites, whereas our 2 s long stimuli give more time for uncertainty to decay in spatial decision making. In Wong et al.’s study (2010), they visually presented the tactor positions on screen, whereas we occluded the arm entirely and provided no visual map, to minimize visual references. In a separate numeric estimation task, they also stimulated anchor points at the wrist and elbow at the start of each trial to help participants calibrate forearm length. Our findings show that when such landmarks are avoided and spacing is normalized, localization along the mid-dorsal forearm is quite uniform. Other studies also showed that the ability to localize a stimulus on skin can rely on multi-sensory interactions, showing that the localization ability may be more malleable to experimental conditions in comparison to detection thresholds (Rigato et al., 2014).
In Study 2 we examined just-noticeable differences (JNDs) for vibrotactile amplitude using a single 2.1G reference. At the distal forearm we observed a larger difference for detecting increasing versus decreasing stimuli than the proximal half (Figure 3C). Because the reference and target stimuli did not have any interstimulus interval, we think that this bias points to a short-term adaptation forward-masking effect. Because receptive-field density declines from wrist to elbow, distal and proximal segments should adapt at different rates, and the modest distal-proximal difference we observed confirms this expectation. In contrast, Pardo et al. (2022) reported uniform JNDs when they presented the two stimuli for 0.5 s with an interstimulus interval of 1 s. This delay can lead to recovery forward-masking adaptation induced after the first stimulus.
Our discrimination paradigm lay within the forward-masking framework as we did not include any delay between the reference and the target stimuli. However, a long-term adaptation during the session is also plausible considering the number of trials in the study and a short intertrial interval. Forward-masking and longer-term adaptation operate on distinct timescales: forward-masking occurs over hundreds of milliseconds to seconds, whereas adaptation can build over tens of seconds to minutes. In peripheral afferents, a strong preceding (masking) stimulus can elevate discrimination thresholds for subsequent weaker stimuli via mechanisms such as fast synaptic depression (Leung et al., 2005). On the scale of seconds to minutes, repeated stimulation of the same neuronal ensembles leads to a reduction in gain. Brain imaging studies demonstrate that neuronal responses in the primary somatosensory cortex remain suppressed for several seconds after a brief (for example, 2 s) adapting stimulus. Behaviorally, this reduced cortical responsiveness is associated with elevated discrimination thresholds (Simons et al., 2005; Tannan et al., 2007).
To dissociate these two modes of adaptation, we estimated the discrimination thresholds (for detecting an increase and decrease) using the trials from the first and last halves of the sessions. In case our results are driven by the masking effect, we would not expect to see a difference in discrimination thresholds in any forearm location. In the other case that our results are influenced by a long-term adaptation to repeated stimulus, we would expect the thresholds to be increased over the course of the behavioral session. To assess that, we split all the sessions and used only the first and second half of trials of a session per participant and estimated the thresholds based on first and second half of the session. We did not find a modulation of thresholds at distal or proximal regions either for detecting increase nor decreases (WSR: increment JND at lower forearm, Mfirst half = 0.45, SEMfirst half = 0.10, Msecond half = 0.47, SEMsecond half = 0.10, W = 36, z = -0.66, p = 0.507; increment JND at upper forearm, Mfirst half = 0.42, SEMfirst half = 0.07, Msecond half = 0.48, SEMsecond half = 0.07, W = 39, z = −0.85, p = 0.397; decrement JND at lower forearm, Mfirst half = 0.43, SEMfirst half = 0.06, Msecond half = 0.46, SEMsecond half = 0.06, W = 36, z = −0.66, p = 0.507; decrement JND at upper forearm, Mfirst half = 0.34, SEMfirst half = 0.06, Msecond half = 0.47, SEMsecond half = 0.7, W = 22, z = −1.91, p = 0.056). However, there was a subtle bias in proximal forearm discrimination threshold for decreasing stimuli, that is a loss of sensitivity in detecting decreasing stimuli in the second half of the session, but this was not significant. Overall, this shows that our results likely represent the masking effect, that is, a short-term form of adaptation. Further investigation is needed to confirm and determine the amount of gain modulation, and interaction between short- and long-term modes of adaptation.
Limitations
Our study has a few important limitations that need to be addressed. Although fundamental sensory processing principles can explain our findings, the generalizability of these results to other body parts is uncertain. Our participant sample represents the age group that is the largest age segment of wearable technology users (Chandrasekaran et al., 2020; Nagappan et al., 2024). Although our findings are relevant to wearables’ users in terms of age, it still decreases the generalizability of our findings for different age groups, as vibrotactile sensitivity changes with age (Deshpande et al., 2008). However, this limitation can be overcome by a global adjustment of haptic signals (Verrillo, 1980). Overall, our participants in the discrimination task showed a high failure rate, and this led to a large amount of data to be discarded.
Future iterations of the study could overcome these problems by employing a couple of strategies in the data collection phase. First, providing an explicit practice phase with immediate feedback for participants, and requiring high level of accuracy before the experiment begins, would familiarize participants with the behavioral task and could reduce errors during the task. Another strategy could be randomly adding above-threshold stimuli as catch trials added to the session to serve as attention probes; if several are missed consecutively, a program could trigger a brief break to allow participants to rest or refocus their attention to the task. Similarly, splitting the experiment over multiple blocks could lessen fatigue and add to the behavioral performance in the task. Finally, adding a modest performance-based reward (for example, a small cash incentive) could sustain motivation and increase performance in the task. Together, these adjustments should reduce data loss in future iterations.
Tips for User Experience Practitioners
We believe that UX practitioners can utilize our study findings on human vibrotactile perception to design and develop high-resolution haptics systems. UX teams would benefit from collaborating with hardware specialists to fine-tune haptic signal delivery while collaborating with psychophysics specialists to estimate the perceptual limits for calibration. We suggest the following recommendations for UX professionals to consider in haptic system design and development:
- Use high-amplitude, mid-to-high-frequency vibrations to deliver clear and continuous sensations.
- Perform local calibration for haptic signals by referencing a skin sensitivity map. Adjust the amplitude based on the specific body location to optimize perception.
- Prioritize increasing vibration strength over decreasing strength to create more salient and noticeable feedback.
- Conduct global calibration for haptic signals, taking the user’s age into account to adjust amplitude appropriately.
Conclusion
In this study, we tested perceptual thresholds associated with vibrotactile stimulation at the dorsal forearm to inform future haptic system implementations. First, we observed significant relationships between stimulus parameters and characterization of the sensation, which aligned with previous findings. Second, we observed significant changes in perceptual threshold across forearm locations. The localization accuracy, however, did not change across these locations. Last, we tested the JNDs and did not find a meaningful difference along the forearm. However, when we compared the ability to detect a decrease to an increase, we found that the relative sensitivity to detect a decrease was less in the lower forearm, suggesting that high-level amplitudes can induce adaptation and hence hinder sensing the subsequent stimuli more so in the lower section of the forearm. Overall, our findings can be applied to develop a model that allows haptic systems to be locally calibrated into a perceivable range.
Conflicts of Interest
There are no conflicts of interest to disclose.
Acknowledgement and Authors’ Contributions (CRediT)
We would like to thank all the participants and helpful comments of Dolby ATG scientists and engineers. Conceptualization: OBE; investigation: OBE; methodology: OBE, JZ, JP; software & hardware: OBE, GF; formal analysis: OBE; visualization: OBE; writing: OBE; supervision: TK, AF, JZ, JP
Tables
Table 1. Number of Trials in the Pilot Study (Figure 4) per Amplitude (Rows) and Frequency (Columns)
| Amp.\Freq. | 10 | 15 | 24 | 36 | 55 | 85 | 130 | 200 | Total |
|---|---|---|---|---|---|---|---|---|---|
| 0.1961 | 15 | 15 | 15 | 15 | 15 | 15 | 15 | 15 | 120 |
| 0.2471 | 15 | 15 | 15 | 15 | 15 | 15 | 15 | 15 | 120 |
| 0.3137 | 15 | 15 | 15 | 15 | 15 | 15 | 15 | 15 | 120 |
| 0.3961 | 15 | 15 | 15 | 15 | 15 | 15 | 15 | 15 | 120 |
| 0.4980 | 15 | 15 | 15 | 15 | 15 | 15 | 15 | 15 | 120 |
| 0.6275 | 15 | 15 | 15 | 15 | 15 | 15 | 15 | 15 | 120 |
| 0.7922 | 15 | 15 | 15 | 15 | 15 | 15 | 15 | 15 | 120 |
| 1 | 15 | 15 | 15 | 15 | 15 | 15 | 15 | 15 | 120 |
| Total | 120 | 120 | 120 | 120 | 120 | 120 | 120 | 120 | 960 |
Table 2. Mean and Confidence Intervals of Detection Thresholds With Pooled Participant Data per Location (Figure 5A)
| Variable | α (G) | CI |
|---|---|---|
| Location 1 | 0.62 | -0.04, 0.04 |
| Location 2 | 0.66 | -0.04, 0.04 |
| Location 3 | 0.68 | -0.04, 0.04 |
| Location 4 | 0.77 | -0.05, 0.04 |
Table 3. Friedman Test for Detection Thresholds
| Source | SS | df | MS | χ2 | p |
|---|---|---|---|---|---|
| Locations | 15.6538 | 3 | 5.2179 | 9.4651 | 0.0237 |
| Error | 48.8462 | 36 | 1.3568 | ||
| Total | 64.5000 | 51 |
Table 4. Post-Hoc Analysis of Detection Thresholds
| Location A | Location B | A – B | CI Lower | CI Upper | p |
|---|---|---|---|---|---|
| 1 | 2 | -0.26923 | -1.5651 | 1.0266 | 0.95086 |
| 1 | 3 | -0.96154 | -2.2574 | 0.33433 | 0.22533 |
| 1 | 4 | -1.3846 | -2.6805 | -0.088749 | 0.030801 |
| 2 | 3 | -0.69231 | -1.9882 | 0.60356 | 0.51668 |
| 2 | 4 | -1.1154 | -2.4113 | 0.18048 | 0.12013 |
| 3 | 4 | -0.42308 | -1.7189 | 0.87279 | 0.83599 |
Table 5. Mean and Standard Error of Change of Detection Thresholds Estimated per Participant per Location (Figure 5C)
| Variable | Mean Change (%) | SEM (±) |
|---|---|---|
| Location 1 (Baseline) | 0 | 0 |
| Location 2 | 10.0198 | ±5.9271 |
| Location 3 | 12.6316 | ±4.8727 |
| Location 4 | 20.8500 | ±6.0684 |
Table 6. Mean and Standard Error of Detection Thresholds Estimated per Participant per Location (Figure 5B)
| Variable | Mean α | SEM (±) |
|---|---|---|
| Location 1 | 0.62 | ±0.0231 |
| Location 2 | 0.64 | ±0.0246 |
| Location 3 | 0.67 | ±0.0239 |
| Location 4 | 0.71 | ±0.0168 |
Table 7. Friedman Test for Localization Accuracy
| Source | SS | df | MS | χ2 | p |
|---|---|---|---|---|---|
| Locations | 4.3846 | 3 | 1.4615 | 2.6308 | 0.4521 |
| Error | 60.6154 | 36 | 1.6838 | ||
| Total | 65 | 51 |
Table 8. Mean and Standard Error for Localization Accuracy (Figure 6B)
| Variable | Mean | SEM (±) |
|---|---|---|
| Location 1 | 0.67 | ±0.06 |
| Location 2 | 0.63 | ±0.06 |
| Location 3 | 0.67 | ±0.06 |
| Location 4 | 0.72 | ±0.06 |
Table 9. Post-Hoc Analysis for Localization Accuracy
| Location A | Location B | A – B | CI Lower | CI Upper | p |
|---|---|---|---|---|---|
| 1 | 2 | 0.38462 | -0. 91626 | 1. 6855 | 0.87259 |
| 1 | 3 | 0.38462 | -0. 91626 | 1. 6855 | 0.87259 |
| 1 | 4 | -0.30769 | -1. 6086 | 0.99319 | 0.92969 |
| 2 | 3 | 0 | -1. 3009 | 1. 3009 | 1.00 |
| 2 | 4 | -0.69231 | -1.9932 | 0. 60857 | 0.52003 |
| 3 | 4 | -0.69231 | –1.9932 | 0. 60857 | 0.52003 |
Table 10. Friedman Test for Just-Noticeable Difference (JND)
| Source | SS | df | MS | χ2 | p |
|---|---|---|---|---|---|
| Locations | 1.5000 | 3 | 0.5000 | 0.9000 | 0.8254 |
| Error | 58.5000 | 33 | 1.7727 | ||
| Total | 60 | 47 |
Table 11. Mean and Standard Error for Comparative Just-Noticeable Difference Metric
| Variable | Mean | SEM (±) |
|---|---|---|
| Location 1 | -0.13 | 0.10 |
| Location 2 | -0.18 | 0.15 |
| Location 3 | 0.01 | 0.13 |
| Location 4 | 0.09 | 0.07 |
References
Ackerley, R., Carlsson, I., Wester, H., Olausson, H., & Backlund Wasling, H. (2014). Touch perceptions across skin sites: Differences between sensitivity, direction discrimination and pleasantness. Frontiers in Behavioral Neuroscience, 8, Article 54. https://doi.org/10.3389/fnbeh.2014.00054
Ævarsson, E. A., Ásgeirsdóttir, T., Pind, F., Kristjánsson, Á., & Unnthorsson, R. (2022). Vibrotactile threshold measurements at the wrist using parallel vibration actuators. ACM Transactions on Applied Perception, 19(3), Article 10. https://doi.org/10.1145/3529259
Alma, U. A., Alvarez Romeo, P., & Altinsoy, M. E. (2021). Preliminary study of upper-body haptic feedback perception on cinematic experience. 2021 IEEE 23rd International Workshop on Multimedia Signal Processing (MMSP), 1–6. https://doi.org/10.1109/MMSP53017.2021.9733546
Arafsha, F., Alam, K. M., & Saddik, A. E. (2015). Design and development of a user centric affective haptic jacket. Multimedia Tools and Applications. https://doi.org/10.1007/s11042-015-2741-1
Brainard, D. H. (1997). The Psychophysics Toolbox. Spatial Vision, 10(4), 433–436. https://doi.org/10.1163/156856897X00357
Calzolari, E., Azañón, E., Danvers, M., Vallar, G., & Longo, M. R. (2017). Adaptation aftereffects reveal that tactile distance is a basic somatosensory feature. Proceedings of the National Academy of Sciences, 114(17), 4555–4560. https://doi.org/10.1073/pnas.1614979114
Chandrasekaran, R., Katthula, V., & Moustakas, E. (2020). Patterns of use and key predictors for the use of wearable health care devices by US adults: Insights from a national survey. Journal of Medical Internet Research, 22(10), e22443. https://doi.org/10.2196/22443
Corniani, G., & Saal, H. P. (2020). Tactile innervation densities across the whole body. Journal of Neurophysiology, 124(4), 1229–1240. https://doi.org/10.1152/jn.00313.2020
de Vlam, V., Wiertlewski, M., & Vardar, Y. (2023). Focused vibrotactile stimuli from a wearable sparse array of actuators. IEEE Transactions on Haptics, 16(4), 511–517. https://doi.org/10.1109/TOH.2023.3270362
Deshpande, N., Metter, E. J., Ling, S., Conwit, R., & Ferrucci, L. (2008). Physiological correlates of age-related decline in vibrotactile sensitivity. Neurobiology of Aging, 29(5), 765–773. https://doi.org/10.1016/j.neurobiolaging.2006.12.002
Ferrari, S., & Hu, Y. (2011). The effect of incongruent delay on guided haptic training. 2011 IEEE World Haptics Conference, 161–166. https://doi.org/10.1109/WHC.2011.5945479
Gani, A., Pickering, O., Ellis, C., Sabri, O., & Pucher, P. (2022). Impact of haptic feedback on surgical training outcomes: A randomised controlled trial of haptic versus non-haptic immersive virtual reality training. Annals of Medicine and Surgery, 83, 104734. https://doi.org/10.1016/j.amsu.2022.104734
Gatti, E., Pittera, D., Berna Moya, J., & Obrist, M. (2017). Haptic rules! Augmenting the gaming experience in traditional games: The case of foosball. 2017 IEEE World Haptics Conference (WHC), 430–435. https://doi.org/10.1109/WHC.2017.7989940
Harris, J. A., Karlov, L., & Clifford, C. W. G. (2006). Localization of tactile stimuli depends on conscious detection. Journal of Neuroscience, 26(3), 948–952. https://doi.org/10.1523/JNEUROSCI.4318-05.2006
Harris, J. A., Thein, T., & Clifford, C. W. G. (2004). Dissociating detection from localization of tactile stimuli. Journal of Neuroscience, 24(14), 3683–3693. https://doi.org/10.1523/JNEUROSCI.0134-04.2004
Hatzfeld, C., Cao, S., Kupnik, M., & Werthschützky, R. (2016). Vibrotactile force perception: Absolute and differential thresholds and external influences. IEEE Transactions on Haptics, 9(4), 586–597. https://doi.org/10.1109/TOH.2016.2571694
He, L., Xu, C., Xu, D., & Brill, R. (2015). PneuHaptic: Delivering haptic cues with a pneumatic armband. Proceedings of the 2015 ACM International Symposium on Wearable Computers, 47–48. https://doi.org/10.1145/2802083.2802091
Hwang, I., Seo, J., Kim, M., & Choi, S. (2012). Perceived intensity of tool-transmitted vibration: Effects of amplitude and frequency. 2012 IEEE International Workshop on Haptic Audio Visual Environments and Games (HAVE), 1–6. https://doi.org/10.1109/HAVE.2012.6374438
Jönsson, E. H., Bendas, J., Weidner, K., Wessberg, J., Olausson, H., Wasling, H. B., & Croy, I. (2017). The relation between human hair follicle density and touch perception. Scientific Reports, 7(1), 2499. https://doi.org/10.1038/s41598-017-02308-9
Kourtesis, P., Argelaguet, F., Vizcay, S., Marchal, M., & Pacchierotti, C. (2022). Electrotactile feedback applications for hand and arm interactions: A systematic review, meta-analysis, and future directions. IEEE Transactions on Haptics, 15(3), 479–496. https://doi.org/10.1109/TOH.2022.3189866
Lee, D., Yun, G., & Choi, S. (2024). Effects of contact force on vibrotactile perceived intensity across the upper body. IEEE Transactions on Haptics, 17(1), 14–19. https://doi.org/10.1109/TOH.2024.3353761
Lemmens, P., Crompvoets, F., Brokken, D., van den Eerenbeemd, J., & de Vries, G.-J. (2009). A body-conforming tactile jacket to enrich movie viewing. World Haptics 2009 – Third Joint EuroHaptics Conference and Symposium on Haptic Interfaces for Virtual Environment and Teleoperator Systems, 7–12. https://doi.org/10.1109/WHC.2009.4810832
Leung, Y. Y., Bensmaïa, S. J., Hsiao, S. S., & Johnson, K. O. (2005). Time-course of vibratory adaptation and recovery in cutaneous mechanoreceptive afferents. Journal of Neurophysiology, 94(5), 3037–3045. https://doi.org/10.1152/jn.00001.2005
Lindsay, O. R., Hammad, H., Baysic, J., Young, A., Osman, N., Ferber, R., Culos-Reed, N., & Peters, R. M. (2024). Age related changes in skin sensitivity assessed with smartphone vibration testing. Scientific Reports, 14(1), 17836. https://doi.org/10.1038/s41598-024-68579-1
Lum, K. R., Wojnilo, O. J., Mankodiya, K., & Solanki, D. (2022). SixthSense: A wearable ultrasonic system with haptic feedback for visually impaired individuals. 2022 IEEE MIT Undergraduate Research Technology Conference (URTC), 1–4. https://doi.org/10.1109/URTC56832.2022.10002224
Mahns, D. A., Perkins, N. M., Sahai, V., Robinson, L., & Rowe, M. J. (2006). Vibrotactile frequency discrimination in human hairy skin. Journal of Neurophysiology, 95(3), 1442–1450. https://doi.org/10.1152/jn.00483.2005
Meftah, E.-M., Shenasa, J., & Chapman, C. E. (2002). Effects of a cross-modal manipulation of attention on somatosensory cortical neuronal responses to tactile stimuli in the monkey. Journal of Neurophysiology, 88(6), 3133–3149. https://doi.org/10.1152/jn.00121.2002
Mikkelsen, M., He, J., Tommerdahl, M., Edden, R. A. E., Mostofsky, S. H., & Puts, N. A. J. (2020). Reproducibility of flutter-range vibrotactile detection and discrimination thresholds. Scientific Reports, 10(1), 6528. https://doi.org/10.1038/s41598-020-63208-z
Morioka, M., & Griffin, M. J. (2002). Dependence of vibrotactile thresholds on the psychophysical measurement method. International Archives of Occupational and Environmental Health, 75(1), 78–84. https://doi.org/10.1007/s004200100280
Nagappan, A., Krasniansky, A., & Knowles, M. (2024). Patterns of ownership and usage of wearable devices in the United States, 2020–2022: Survey study. Journal of Medical Internet Research, 26(1), e56504. https://doi.org/10.2196/56504
Pardo, L. A., Markovic, M., Schilling, A. F., Wilke, M. A., & Ernst, J. (2022). Vibrotactile mapping of the upper extremity: Absolute perceived intensity is location-dependent; perception of relative changes is not. Frontiers in Neuroscience, 16, Article 958415. https://doi.org/10.3389/fnins.2022.958415
Peon, A. R., & Prattichizzo, D. (2013). Reaction times to constraint violation in haptics: Comparing vibration, visual and audio stimuli. 2013 World Haptics Conference (WHC), 657–661. https://doi.org/10.1109/WHC.2013.6548486
Rigato, S., Bremner, A. J., Mason, L., Pickering, A., Davis, R., & van Velzen, J. (2014). The electrophysiological time course of somatosensory spatial remapping: Vision of the hands modulates effects of posture on somatosensory evoked potentials. European Journal of Neuroscience, 39(4), 703–713. https://doi.org/10.1111/ejn.12528
Sahai, V., Mahns, D. A., Robinson, L., Perkins, N. M., Coleman, G. T., & Rowe, M. J. (2006). Processing of vibrotactile inputs from hairy skin by neurons of the dorsal column nuclei in the cat. Journal of Neurophysiology, 95(3), 1451–1464. https://doi.org/10.1152/jn.00485.2005
Scheidt, R. A., Reinkensmeyer, D. J., Conditt, M. A., Rymer, W. Z., & Mussa-Ivaldi, F. A. (2000). Persistence of motor adaptation during constrained, multi-joint arm movements. Journal of Neurophysiology, 84(2), 853–862. https://doi.org/10.1152/jn.2000.84.2.853
Schütt, H. H., Harmeling, S., Macke, J. H., & Wichmann, F. A. (2016). Painfree and accurate Bayesian estimation of psychometric functions for (potentially) overdispersed data. Vision Research, 122, 105–123. https://doi.org/10.1016/j.visres.2016.02.002
Simons, S. B., Chiu, J., Favorov, O. V., Whitsel, B. L., & Tommerdahl, M. (2007). Duration-dependent response of SI to vibrotactile stimulation in squirrel monkey. Journal of Neurophysiology, 97(3), 2121–2130. https://doi.org/10.1152/jn.00513.2006
Singhal, A., & Jones, L. A. (2017). Perceptual interactions in thermo-tactile displays. 2017 IEEE World Haptics Conference (WHC), 90–95. https://doi.org/10.1109/WHC.2017.7989882
Smith, S. G. V. S., Yokich, M. K., Beaudette, S. M., Brown, S. H. M., & Bent, L. R. (2022). Cutaneous sensitivity across regions of the foot sole and dorsum are influenced by foot posture. Frontiers in Bioengineering and Biotechnology, 9, Article 744307. https://doi.org/10.3389/fbioe.2021.744307
Talbot, W. H., Darian-Smith, I., Kornhuber, H. H., & Mountcastle, V. B. (1968). The sense of flutter-vibration: Comparison of the human capacity with response patterns of mechanoreceptive afferents from the monkey hand. Journal of Neurophysiology, 31(2), 301–334. https://doi.org/10.1152/jn.1968.31.2.301
Tannan, V., Simons, S., Dennis, R. G., & Tommerdahl, M. (2007). Effects of adaptation on the capacity to differentiate simultaneously delivered dual-site vibrotactile stimuli. Brain Research, 1186, 164–170. https://doi.org/10.1016/j.brainres.2007.10.024
Tindale, A., Cumming, M., Pridham, H., Peter, J., & Diamond, S. (2014). Wearable haptic gaming using vibrotactile arrays. Proceedings of the 16th International Conference on Human-Computer Interaction with Mobile Devices & Services, 435–438. https://doi.org/10.1145/2628363.2633574
Tremblay, F., Mireault, A.-C., Dessureault, L., Manning, H., & Sveistrup, H. (2005). Postural stabilization from fingertip contact. Experimental Brain Research, 164(2), 155–164. https://doi.org/10.1007/s00221-005-2238-5
Umek, A., Tomažič, S., & Kos, A. (2015). Wearable training system with real-time biofeedback and gesture user interface. Personal and Ubiquitous Computing, 19(7), 989–998. https://doi.org/10.1007/s00779-015-0886-4
Verrillo, R. T. (1980). Age related changes in the sensitivity to vibration. Journal of Gerontology, 35(2), 185–193. https://doi.org/10.1093/geronj/35.2.185
Vicentini, M., & Botturi, D. (2010). Perceptual issues improve haptic systems performance. In Advances in Haptics. IntechOpen. https://doi.org/10.5772/8711
Whang, K. C., Burton, H., & Shulman, G. L. (1991). Selective attention in vibrotactile tasks: Detecting the presence and absence of amplitude change. Perception & Psychophysics, 50(2), 157–165. https://doi.org/10.3758/BF03212216
Wheat, H. E., & Goodwin, A. W. (2001). Tactile discrimination of edge shape: Limits on spatial resolution imposed by parameters of the peripheral neural population. Journal of Neuroscience, 21(19), 7751–7763. https://doi.org/10.1523/JNEUROSCI.21-19-07751.2001
Whitehouse, D. J., & Griffin, M. J. (2002). A comparison of vibrotactile thresholds obtained using different diagnostic equipment: The effect of contact conditions. International Archives of Occupational and Environmental Health, 75(1), 85–89. https://doi.org/10.1007/s004200100281
Wong, E. Y., Israr, A., & O’Malley, M. K. (2010). Discrimination of consonant articulation location by tactile stimulation of the forearm. 2010 IEEE Haptics Symposium, 47–54. https://doi.org/10.1109/HAPTIC.2010.5444681
Yeganeh, N., Makarov, I., Unnthorsson, R., & Kristjánsson, Á. (2023). Effects of stimulus frequency and location on vibrotactile discrimination performance using voice coil actuators on the forearm. Actuators, 12(6), Article 6. https://doi.org/10.3390/act12060224
Yoo, Y., Hwang, I., & Choi, S. (2022). Perceived intensity model of dual-frequency superimposed vibration: Pythagorean sum. IEEE Transactions on Haptics, 15(2), 405–415. https://doi.org/10.1109/TOH.2022.3144290
Zhu, L., Cao, Q., & Cai, Y. (2020). Development of augmented reality serious games with a vibrotactile feedback jacket. Virtual Reality & Intelligent Hardware, 2(5), 454–470. https://doi.org/10.1016/j.vrih.2020.05.005