
[:en]
Abstract
Heart rate constitutes one of the most important physiological parameters for humans and is linked to the prognosis of several diseases. Moreover, its unobtrusive measurement is necessary in several real-life applications, such as remote monitoring of older adults or infants, or monitoring people while driving or exercising. Most state-of-the art methods are able to achieve significantly high values of accuracy. Thus, focus should be given to user satisfaction—an aspect that is typically underestimated or even ignored. Therefore, in this paper we present a user evaluation study of three non-invasive methods for heart-rate measurement. More specifically, we evaluated an implementation of a state-of-the-art algorithm that is based on remote video measurements taken by a typical camera and then compared the algorithm to (a) a low-cost bracelet with an integrated photoplethysmography sensor and (b) a freely available Android mobile app that uses a phone’s camera and flash. All three methods provide for low-cost, because they do not require any special kind of equipment, and non-invasiveness, as at most they require slight physical contact with participants. The methods were thoroughly evaluated with a focus on user satisfaction. The user evaluation was performed by real users using questionnaires to assess user satisfaction.
Keywords
heart-rate measurement, camera, photoplethysmography, user evaluation
Introduction
The heart rate is undoubtedly one of the most important physiological parameters for humans. It has been proved that it may contribute to the prognosis of cardiovascular diseases and also of the life expectancy even of healthy humans (Fox et al., 2007). The most acceptable way to measure the heart rate is the electrocardiogram (ECG or EKG). However, this method requires several sensors and may cause severe discomfort to patients, especially when it is used for a long period of time. Of course, the cost of an ECG makes it inapplicable for home use. Pavlidis et al. (2007) were among the first to propose a method for the measurement of heart rate using a human-computer interface. More specifically, they proposed the use of a thermal camera that was connected as a computer peripheral. Since then, many research efforts have aimed to monitor physiological parameters such as the heart or the respiratory rate without any contact to any medical instrument. Instead, they are based on visual information, captured using a camera.
In this work, our goal was to assess the user experience of such a method and to compare this experience to two popular low-cost approaches. Our main priority was to collect the opinion of real users, regarding mainly the user experience and the accuracy of such methods. More specifically, we implemented the state-of-the-art method that was proposed by Balakrishnan et al. (Balakrishnan, Durand, & Guttag, 2013). This method made use of a low-cost web camera and a typical computer. In brief, the participants sat in front of a camera and their heart rate was detected using a computer vision algorithm. We implemented and compared the aforementioned approach in terms of user satisfaction of a low-cost bracelet, equipped with a photoplethysmography (PPG) sensor and of a freely available Android mobile application. The latter required a mobile phone equipped with a camera and an integrated flash LED. The application was selected based on both its popularity and user ratings. Moreover, using the bracelet as a point-of-reference, we compared the accuracies of the other two approaches.
Photoplethysmography
We should herein note that both the bracelet and the mobile application are based on a technique known as photoplethysmography (PPG). This technique detects blood volume changes within the microvascular tissue of the skin surface using an optical sensor (Allen, 2007). This technique is based on the observation that skin tissue exhibits significantly different values of light absorption depending on the volume of blood flowing into the veins. Thus, light absorption is expected to change within the duration of a cardiac pulse. This property is exploited by PPG-based techniques that calculate the rate of such changes and corresponds to the heart rate. Therefore, the bracelet uses an LED light to illuminate the skin region of where it is placed. Then, it measures the amount of light that is reflected using a photodiode. Similarly, by using the camera of a mobile phone, the heart rate may be estimated using the frequency of change of pixel intensity values. In that case, the integrated flash of the phone is used to illuminate the skin of the participant’s finger while the camera is used to capture video, that is, the intensity values.
Problem Statement
A plethora of methods for measuring heart rate has been proposed in the literature during the last few years. However, we should emphasize that almost all these works focus on accuracy, while user satisfaction is neither examined nor discussed. Nevertheless, it may be observed that high accuracy values are nowadays feasible for all kinds of methods. Yet, robustness under several activities such as exercising still remains a challenge. Moreover, because in several real-life applications such as Ambient Assisted Living, it is typically sufficient to detect abrupt changes or irregularities so as to decide whether there exists a necessity of warning or intervention. Thus, achieving a near-perfect accuracy may not be necessary. Therefore, in this research, instead of accuracy, our goal was to focus on user experience. Of course, we performed an evaluation of the accuracy of the three aforementioned methods, while we let real-life users decide whether they considered it to be adequate for their personal needs or not. Concluding, to the best of our knowledge, there does not exist in the literature another evaluation approach like the one we present in this paper and based on the aforementioned discussion, we feel that because accuracy is already high, other factors such as the assessment of user experience should now become a priority.
The motivation for choosing the aforementioned methods is as follows. Camera-based methods, such as the one we evaluated, may be used in several cases, for example, in assisted living, or when the user is driving, exercising, or sleeping. This method is contactless and may be used even in scenarios when users are unaware that they are observed. Its main disadvantage is that it requires users to face the camera and be quite steady, at least for a few seconds. Bracelets may be continuously used, for example, during the whole day and may be programmed to measure heart rate at any given interval, but users may feel discomfort when they wear it for long periods of time. Also, when it is not appropriately tight, measurements may not be accurate. Finally, measuring the heart rate using a mobile application is probably the least expensive method because it only requires a low-cost mobile phone. Nevertheless, its main disadvantage is that they are the least intuitive to use and difficult to achieve accurate measurements. To our belief, the three aforementioned methods are the least invasive, while requiring typical, inexpensive hardware.
Heart Rate Measurement Using Pulse Oximeter
Without any doubt, the electrocardiogram (ECG) is considered to be the “gold standard” for measuring the heart rate and also for the prognosis of several cardiovascular diseases. However, it is an expensive device that may also cause discomfort to patients or even physical pain when it is used for a long time. For example, a number of electrodes are placed using conductive gel on several body areas of the patients, such as chest, hands, and legs. A low-cost, yet reliable alternative for measuring the heart rate is the fingertip pulse oximeter. It is considered to be a noninvasive and painless test that primarily aims to measuring oxygen saturation level but also provides the heart rate. It is a small, clip-like device, based on PPG, that is often designed to attach not only to fingers but also to toes or earlobes.
Heart Rate Measurement from a Camera
There exist several approaches that make use of a typical camera to remotely estimate the heart rate. The majority of these approaches typically consist of the following steps:
- video capturing
- heuristic selection of facial regions or extraction of interest points
- color channel selection (Note that the majority of approaches work on the green channel because green light is better absorbed by blood, while the light is able to penetrate into the skin deeper.)
- temporal filtering to remove the effects of respiration, low-frequency motion, or changes in posture
- feature selection (Where several methods such as principal components analysis [PCA] are used so as to discard irrelevant or redundant data [Jolliffe, 2002].)
- signal analysis, typically in the spectral domain (Where the goal is to estimate the heart rate based on a set of signals that have been extracted and processed, during the aforementioned steps.)
Among the plethora of research works in this domain, we should note the early and pioneering work of Takano and Ohta (2007) that was based on brightness changes of skin within time-lapse video sequences. Moreover, the work of Poh, McDuff, and Picard (2010) has probably marked the beginning of intensive research in the field of heart rate estimation from a camera, having inspired the majority of relevant works that have been presented during the last decade. Upon detection and tracking of the face, they extracted the Red, Green and Blue channels for each video frame, forming three sequences that were then normalized and decomposed using independent component analysis (ICA; Comon, 1994). They heuristically selected the second component as the one that corresponds to the heart rate. After applying fast Fourier transform (FFT), they ended up with the power spectrum and selected the most powerful frequency as the one of the heart rate.
The first approach that we evaluated was based on the work of Balakrishnan et al. (2013). It makes use of a low-cost web camera and a typical personal computer. We selected this approach because it does not rely on any heuristics. More specifically, it is based on the theoretical and also experimentally proven assumption that slight head motion, when the subject tries to remain still, is due to the flow of blood within vessels. Thus, this motion “follows” the heart rate.
The method may be summarized into the following steps:
- Automatically extract the face region; we used the Viola-Jones algorithm (Viola & Jones, 2004).
- Exclude the regions of the eyes and nose (selected based on statistics of their locations and sizes).
- Extract a set of interest points from the remaining regions. Such points are typically extracted using a well-founded mathematical definition and are proven to be stable to be invariant to several changes such as scaling, illumination, and so on. At this step, good features to track (GftT) are extracted (Shi & Tomasi, 1994).
- Track the motion on the vertical axis (i.e., the y-axis) of the features extracted at the previous step using the Kanade-Lucas-Tomasi algorithm (KLT; Lucas & Kanade, 1981; Tomasi & Kanade, 1991). Note that the motion of each point to the y-axis corresponds to a 1-D signal, thus, from the set of all extracted points, a set of such signals results.
- Perform an interpolation procedure in order to approximate the sampling rate of an ECG, which is approximately 250Hz. Do this for each of the aforementioned signals.
- Perform a temporal filtering procedure to eliminate frequencies out of this interval because the normal heart rate of a human adult is between 45 and 120 beats/min (i.e., between 0.75 and 2Hz).
- Apply a fifth order Butterworth single processing filter to filter frequencies lower than 0.75Hz that may appear mainly due to respiration and also due to slight motion.
- Apply PCA to remove redundant information on the aforementioned set of signals.
- Determine the heart rate results from the frequency of the most periodic signal (i.e., the one having a frequency with the highest spectral power) among the first five components of PCA.
PPG-Based Heart Rate Measurement Using a Mobile Phone
During the last few years, recent advances in the field of imaging have allowed the use of low-cost and high-quality cameras in affordable smartphones. There exist several techniques inspired by traditional photoplethysmography (PPG) that work using the integrated camera of a smartphone to measure the heart rate directly from the subject’s finger. More specifically, these techniques typically require the finger to be placed on top of the camera lens so that it is in contact with it while being illuminated by the camera’s integrated flash LED (see Figure 1b). The applied algorithms are typically simpler variations of those that work on personal computers because they should meet the requirement to run at (almost) real-time using low-spec smartphones, whose computational power is significantly inferior compared to typical personal computers.
Among the first works we should note is the one of Pelegris, Banitsas, Orbach, and Marias (2010) that used a simple heuristic rule to define whether a point of the waveform of the intensity corresponds to a peak in presence of noise. Moreover, the method proposed by Grimaldi, Kurylyak, Lamonaca, and Nastro (2011) was based on the idea that the change of blood volume within the finger follows the one of the heart rate. They first computed the maximum and minimum value of the Red channel and heuristically selected a threshold in between them. Then for each frame they selected the number of pixels above this threshold, forming a signal. Experimental evaluation indicated that this signal corresponded to an inverted PPG. More recent works exploit the increasing processing power of recent smartphones, proposing more complex approaches. For example, Peng, Zhou, Lin, and Zhang (2015) selected a region of 80 × 80 pixels in the center of the captured image, and then extracted the Red channel. Then, they applied a heuristic statistical algorithm to remove any noise originating either by abrupt motion or illumination changes. They used a low and a high-pass Butterworth filter to remove noise from the intensity signal, and upon an interpolation step, they extracted the interval between two consecutive heart beats and ended up with the heart rate.
PPG-Based Heart Rate Measurement Using a Smart-Bracelet
Another novelty that has recently emerged is wearable technology. Several devices have been presented that share the common goal of making technology pervasive by incorporating it into daily life by either enhancing the functionality of clothing or by providing clothing accessories. Modern wearables typically focus on sensing users’ daily activities such as motion and sleep or physiological parameters such as the heart rate. To enable interaction with the user, they are often equipped with vibration motors, LEDs, small LCD screens, and buttons. Several implementations (e.g., smartwatches) are also capable of analyzing the collected data, keeping a full history, and providing personalized recommendations to users. Wearables are also typical examples of “things” within Internet of Things (IoT) ecosystems. Their sensing measurements may be sent to cloud services for processing. Upon processing, some kind of actuation may take place, for example, by vibration or screen notifications.
Many commercial wearable products that provide heart rate measurement have become available during the last few years. Notable implementations are chest belts/straps, headbands, rings, headphones, or even shirts and socks. Of course, smartwatches and bracelets/wristbands are undoubtedly the most popular ones because they combine low cost with practicality, and they may be worn during the whole day, no matter the user’s activities. Typically, they incorporate a PPG sensor: A series of green LEDs that illuminate the area of the skin and a photodiode is used to measure absorption changes due to blood pulse. Results are either transmitted to a connected mobile phone or displayed on the wearable’s screen.
Methods
The fingertip pulse oximeter is considered to be a reliable low-cost method for measuring heart rate. Our initial intention was to use such a device as a point of reference throughout our experiments. However, when using it throughout a series of our preparatory experiments, the participants reported discomfort when it was used for more than a few seconds. Because we did not want to overload the participants with sensors, which might negatively affect their experience, our first, preliminary experiment was to verify whether the smart bracelet could be used as the point of reference. Upon a preliminary series of experiments on 20 users, the average error of measurements with the smart bracelet compared to those with the oximeter was less than 1%, which corresponds to less than 1 beat per minute. This error, in our opinion, was satisfactory for our goals. Thus, we decided to use the smart bracelet as the point of reference.
Thus, the goals of our experiment were as follows: Evaluate in terms of user satisfaction (a) an algorithm that is able to run on a typical personal computer using its web camera, (b) a PPG-based mobile phone application, and (c) a PPG-based bracelet. Moreover, we sought to evaluate the accuracy of the algorithm and the mobile phone application by using the bracelet as the point of reference.
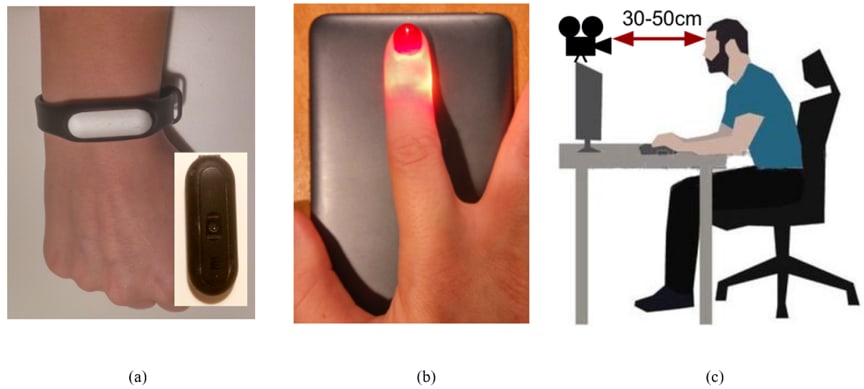
Figure 1. (a) Bracelet worn by a participant, note the PPG sensor, (b) placing a finger on top of phone camera, and (c) position during measurements’ acquisition.
We implemented the camera-based methodology of Balakrishnan et al. in Python 3.5.1. We used the OpenCV library for face detection, face region selection, keypoint extraction and tracking (Bradski & Kaehler, 2008). Moreover, we used the SciPy library for interpolation and signal filtering (Pedregosa et al., 2011). Also, for PCA we used the scikit-learn library (Jones, Oliphant, & Peterson, 2014). Moreover, we used two typical, low-cost cameras (approximate cost of 25-30€): the HD Logitech C270 and C525 for video capturing. Both allowed for a max resolution of 1280 × 720 pixels at 30 frames per second. All experiments were conducted using personal computers with relatively old Intel™ processors: one with a Core™ i7-960 Processor (8M Cache, 3.20 GHz) with 12GB of RAM and another with Core™ i5-2540M with 8GB of RAM. For the mobile application, instead of implementing an algorithm we decided to use a freely available application. Upon searching freely available Android applications in Google Play, we selected the Android Instant Heart Rate: Heart Rate & Pulse Monitor[1]. It makes use of the phone’s camera and integrated flash, requiring the user’s finger to remain on the camera for a few seconds (Figure 1b). Note that this app was among the most popular ones, having approximately 10–50M downloads (Google Play does not provide more accurate results) and an average rating of 4.3/5 resulting from more than 280,000 users. We used a low-cost smartphone, that is, the Xiaomi Redmi Note 2 (introduced in 2015, with an approximate cost of 150€) for connecting the bracelet via Bluetooth and for running the app. The phone’s camera had a resolution of 1920 × 1080 at 30 fps. For the bracelet, because our goal was to evaluate low-cost implementations, we used the Xiaomi Mi Band 1S[2], a low-cost bracelet (approximately 15€) that integrates a PPG sensor (Figure 1a). It connects to a smartphone using Bluetooth. Measurement of heart rate was triggered by an application that accompanies the wristband. After a few seconds, the result was displayed on the phone’s screen.
Our experiment took place in two different rooms that were simultaneously illuminated by both natural light (i.e., from the window) and artificial light (i.e., from ceiling lighting). The first was an office space in our institution, and the second was the living room of a typical house. It involved 20 participants (8 female and 12 male). They were undergraduate or graduate students and research, teaching, and technical staff; their ages varied between 20–40 years old, and none of them had any previous experience with any of the three methods. All participants were sitting on a chair and in front of a desk. A web camera was placed approximately face high (the chair’s height was accordingly adjusted for every participant). The distance of the face to the camera was between 30–50 cm (Figure 1c). Their finger was placed on the camera of the smartphone (Figure 1b). The bracelet was worn in the right hand, placed according to the manufacturer’s instructions. All three methods were controlled by an assistant rather than the participant to avoid any abrupt movements. Prior to the evaluation, we made two to three measurements with the oximeter to ensure correct placement of the bracelet. Participants were in rest, that is, they did not have any physical activity before the measurements. All three methods required approximately the same amount of time. Upon the end of taking a triplet of measurements, we proceeded with the next interval of measurements after waiting a few seconds. From each participant, we acquired 10 triplets of measurements.
Results
We present in the following sections the results for user satisfaction and for the accuracy of the heart rate estimation for each method.
User Satisfaction
For the evaluation of the user experience, we created a questionnaire based on several well-known approaches, considered to be good practices for such evaluations, within the broad field of human-machine interaction. More specifically, we used questions and ideas from the works of Chin, Diehl, and Norman (1988) and Lund (2001). These questions are depicted in Table 1, divided into four categories that aim to capture the users’ qualitative answers in terms of usefulness, ease of use, ease of learning, and satisfaction. Note that we opted for a Likert scale of values 1–5, which we felt was satisfactory for the needs of the problem at hand (Likert, 1932). Upon the completion of the accuracy experiments, we let the participants familiarize themselves with the camera-based method for as much as time as they wanted. Moreover, we asked them to use the bracelet and the mobile application for a few days. After this period, each user completed the questionnaire for each of the three methods.
Table 1. The questionnaire used for the evaluation of the three methods.
|
Question |
Answer |
||||||
|
Usefulness |
|
1 |
2 |
3 |
4 |
5 |
|
|
1. Do you find the system/app to be useful? |
Not at all |
◯ |
◯ |
◯ |
◯ |
◯ |
A lot |
|
2. Does the system/app suit your needs? |
Not at all |
◯ |
◯ |
◯ |
◯ |
◯ |
A lot |
|
3. Do you find the system/app to be accurate? |
Not at all accurate |
◯ |
◯ |
◯ |
◯ |
◯ |
Very accurate |
|
4. Do you find the system/app to be fast? |
Very slow |
◯ |
◯ |
◯ |
◯ |
◯ |
Very fast |
|
5. Do you think that the system/app may be used by everyone? |
Definitely not |
◯ |
◯ |
◯ |
◯ |
◯ |
Definitely yes |
|
Ease of use |
|
1 |
2 |
3 |
4 |
5 |
|
|
6. Do you think that the system/app is easy to use? |
Definitely not |
◯ |
◯ |
◯ |
◯ |
◯ |
Definitely yes |
|
7. Do you find the system/app to be user friendly? |
Definitely not |
◯ |
◯ |
◯ |
◯ |
◯ |
Definitely yes |
|
8. Do you find the system/app desirable to use? |
Definitely not |
◯ |
◯ |
◯ |
◯ |
◯ |
Definitely yes |
|
9.Do you think that the system/app may be used without any instructions given? |
Definitely not |
◯ |
◯ |
◯ |
◯ |
◯ |
Definitely yes |
|
10. Do you think that the system/app may be successfully used every time? |
Definitely not |
◯ |
◯ |
◯ |
◯ |
◯ |
Definitely yes |
|
Ease of learning |
|
1 |
2 |
3 |
4 |
5 |
|
|
11. Is it easy to remember how to use the system/app? |
Definitely not |
◯ |
◯ |
◯ |
◯ |
◯ |
Definitely yes |
|
12. Did you easily learn to use the system/app? |
Definitely not |
◯ |
◯ |
◯ |
◯ |
◯ |
Definitely yes |
|
Satisfaction |
|
1 |
2 |
3 |
4 |
5 |
|
|
13. Do you think that the system/app is plausible to use? |
Definitely not |
◯ |
◯ |
◯ |
◯ |
◯ |
Definitely yes |
|
14. Would you recommend the system/app to a friend? |
Definitely not |
◯ |
◯ |
◯ |
◯ |
◯ |
Definitely yes |
|
15. Are you satisfied by the system/app? |
Definitely not |
◯ |
◯ |
◯ |
◯ |
◯ |
Definitely yes |
From the answers of each question and based on the technical report of Bertram, we extracted three basic descriptive statistics: the mean, median, and mode values (Bertram, 2007; Lewis, 1993, 2014). We also calculated the four quartile values. Moreover, quartile values are defined as those values that segment sorted data into equal parts. In our case, because data values are between 1 and 5, there exist four quartile values. The results along with summaries of users’ answers are depicted in the Appendix Table 1 for the camera-based approach, in Appendix Table 2 for the mobile phone-based approach, and in the Appendix Table 3 for the bracelet.
We performed an omnibus Friedman test on questionnaire scores averaged across the 15 items of the questionnaire for the independent variable of method used for heart rate measurement. The Friedman test indicated a statistically significant difference regarding the method the users preferred, χ2(2) = 13.132, p = 0.001. Also, to examine the differences, the Friedman test was followed up with paired Wilcoxon signed-rank tests. Mean ranks of all three methods and test statistics between pairs of methods are depicted in Tables 2 and 3, respectively. As seen in Table 3, statistically significant differences were observed between the mobile app and the camera (z = -2.951, p = 0.003), and also between the mobile app and the bracelet (z = -3.464, p = 0.001). On the other hand, the difference between the camera and the bracelet was not statistically significant (z = -0.119, p = 0.906). The paired comparisons indicated that the user experience with the mobile app was better than the ones with the camera and the bracelet. However, as we later discuss, our impression upon observation of additional results, including discussion with the users, was that the camera-based method is the preferable method.
Table 2. Mean ranks of the three methods, calculated by the Wilcoxon signed-rank tests.
|
Method |
Mean rank |
|
Camera |
2.18 |
|
Mobile app |
1.38 |
|
bracelet |
2.45 |
Table 3. Wilcoxon signed-rank test results between pairs of methods.
|
Method A |
Method B |
Z |
p |
|
Mobile app |
Camera |
-2.951 |
0.003 |
|
Bracelet |
Camera |
-0.119 |
0.906 |
|
Bracelet |
Mobile app |
-3.464 |
0.001 |
We also had participants complete the System Usability Scale (SUS) questionnaire (Brooke, 1996). SUS is a widely used, 10-item questionnaire, often adopted for usability engineering, designed to measure perceived usability. It produces a single score per user and method which can range between 0 and 100. Because the SUS is a general questionnaire not specific to dimensions like accuracy or speed of measurement, it can be applied for comparison of dissimilar systems. Therefore, we feel that its role is complementary to our custom questionnaire because it could be easily used for comparison of the results of our study to future usability studies.
Participants’ responses to the SUS appear in Appendix Tables 7–9. The camera-based approach had an average score (with 95% confidence interval) of 78.38 ± 6.03, the mobile app was 70.00 ± 4.73, while the bracelet was 70.75 ± 7.35. Because the confidence intervals overlapped, we conducted a one-way within-subjects (repeated measures) ANOVA analysis on the SUS results (see Appendix Table 11), followed by Bonferroni multiple comparisons (see Appendix Table 12). These results indicated a significant main effect of Device, F(2, 38) = 12.6, p < 0.0001. The Bonferroni comparisons indicated a significant difference between camera and mobile app (p < 0.0001) and between camera and bracelet (p = 0.006), with camera outperforming both other methods. There was no significant difference between the mobile app and the bracelet. The perceived usability of the devices using the Sauro-Lewis curved grading scale (Sauro & Lewis, 2016) was B+ (camera), C (bracelet), and C (mobile app).
Conclusions from the analysis of our own questionnaire (favoring the mobile app) were different from the SUS (favoring the camera-based approach). This may be because, in addition to perceived usability (ease-of-use), our questionnaire also measured usefulness, learnability, and satisfaction. It is reasonable to hypothesize that the different content of the questionnaires led to these different results. Therefore, we feel that although the conclusions between the questionnaires are different, important conclusions may be extracted from each, considering the content of their questions.
To investigate this hypothesis, we conducted a comparison of responses to the common “ease” question from both questionnaires: Item 6 in our questionnaire (“Do you think that the system/app is easy to use?”) and Item 3 in the SUS (“I thought the system was easy to use”). A within-subjects ANOVA with two independent variables, Questionnaire and Method, indicated a statistically significant main effect of Method, F(2, 38) = 5.703, p = 0.007, but no main effect of Questionnaire, F(1,19) = 1.896, p = 0.185, and no Method x Questionnaire interaction, F(2, 38) = 0.149, p = 0.862. The means for each questionnaire and method were the following:
- Camera: Our questionnaire Item 6: 4.5; SUS Item 3: 4.4
- Bracelet: Our questionnaire Item 6: 4.35; SUS Item 3: 4.15
- Mobile: Our questionnaire Item 6: 4.05; SUS Item 3: 4.0
To further explore the effect of Method, because the effect of Questionnaire was not significant, we averaged across the Questionnaire variable to get a combined Ease rating for each device, then conducted three paired t-tests. The results were the following:
- The combined Ease ratings for Camera were highly significantly better than for Mobile, t(19) = 4.344, p < .0001.
- The Mobile and Bracelet difference approached significance (p < .10), but did not achieve the criterion of p < .05, t(19) = -1.831, p = .083.
- Camera and Bracelet were not significantly different, t(19) = 1.322, p = .202.
These results provided support for the hypothesis regarding the cause of different outcomes between the two questionnaires because participants’ ratings of Ease were very similar across questionnaires, but showed a significant difference across methods.
Accuracy of Heart Rate Measurements
Results regarding the accuracy of the camera and the mobile phone application when using the bracelet as a benchmark are depicted in Table 4. To evaluate the accuracy in increased values of the heart rate (and following the paradigm of Gupta, McDuff, & Raskar, 2016), we conducted two series of experiments. Within the first, participants were at rest the whole time, that is, for the whole series of measurements. Within the second part, the heart rate of ten of the participants (four women and six men) was measured immediately upon approximately five minutes of intense physical activity (fitness bike); their heart rate increased far beyond 100 beats per minute, that is, they were in stress. Both approaches showed similar error values, with the mobile application showing nominally superior performance, especially during the first part of the experiments.
Table 4. Error of camera and smart mobile phone application approaches, compared to the bracelet. Numbers indicate beats per minute (BPM).
|
|
Camera |
Mobile app |
|||
|
Mean |
Std |
Mean |
Std |
||
|
Error |
Part 1: rest |
5.32 |
4.23 |
3.48 |
2.93 |
|
Part 2: upon exercising |
7.13 |
5.28 |
3.12 |
2.64 |
|
Conclusion
In this work, we conducted a realistic evaluation of three low-cost, non-invasive methods for the estimation of heart rate with 20 participants. Specifically, we evaluated (a) a method that required a camera and a personal computer, (b) a mobile application that worked on a smart mobile phone and made use of its embedded camera and LED, and (c) a smart bracelet that was connected to a smart mobile phone and was equipped with a PPG sensor. We focused mainly on user experience, assessed with the standard SUS and with a custom questionnaire, but also evaluated the accuracy of all three methods.
Most likely due to differences in the content of their items, analysis of the questionnaires revealed different outcomes. Conclusions from the analysis of our custom questionnaire (which favored the mobile app) were different from the SUS (which favored the camera-based approach). The questionnaires produced similar outcomes for perceived usability, but in addition to perceived usability, our custom questionnaire addressed additional elements of user experience such as usefulness, learnability, and satisfaction. Upon careful observation of the results of the first part of the evaluation, we feel that we have to emphasize the following.
First, based on users’ ratings of perceived usability (SUS), measuring the heart rate using a camera seemed to be the easiest method for the majority of users. The major drawbacks of this approach, according to the results of the custom questionnaire, were desirability and plausibility of use. We feel that because participants did not have the necessary technical background, it was hard for them to believe that the results were accurate; therefore, it was difficult for them to trust it. Yet, as we later discuss, in real-life conditions, such an approach should be mainly used for user monitoring. We should also emphasize that the users felt the need for instructions, something not necessary in the aforementioned scenario. Finally, the users were able to immediately understand the correct position they should have and were satisfied mostly because no contact was needed.
Second, the usage of a smart bracelet was perceived as the second most usable method (SUS). The users did not have any previous experience with such a device and were really enthusiastic with the ease of use. They also felt that the usage was very intuitive because all they had to do was open an application and press a button on the screen. Compared to the previous method and upon studying the results of the statistical analysis, users were very satisfied with the amount of time required for a measurement. Also, according to the users, this was the best method in terms of repetitiveness of successful results. Of course, this should have been expected because it was the only method that used hardware designed for the specific use. The accuracy of results relies on the correct fit at the wrist. Fortunately, the results indicate that the bracelet’s design enabled users to easily achieve the best possible fit. Among our main concerns was that the bracelet needed to be quite tight to ensure accurate measurements. We expected that this would be considered as a disadvantage by most users. However, none of them considered that as annoying or discomforting. We should also note that users were very positive for the bracelet’s low cost, yet we feel that extra capabilities that a more expensive one is able to offer (e.g., LCD screen) would further increase the users’ positive views.
Last, although the mobile application was not perceived to be as usable as the camera-based method (SUS), the results of our custom questionnaire indicated that users perceived some advantages of the mobile application. We emphasize that it was free of charge, demonstrated increased accuracy compared to the camera-based approach, and provided an intuitive interface. We personally feel that the major disadvantage of the mobile app is that while measuring, the users felt some kind of burning on their finger because it had to be in contact with the flash LED the whole time, which likely led to its lower scores for perceived usability. The measuring time was approximately equal to the other approaches (8–12 seconds); however, in this specific case, it annoyed the majority of the users. Statistical analysis of the results showed that with this method it was more difficult for the users to obtain consistently accurate measurements. On the other hand, it is a portable method that does not require any hardware other than a mobile phone, and the necessary software can be easily downloaded and installed at any time.
We should herein note that the SUS scores of the mobile application and bracelet were almost equal, yet inferior to the one of the camera-based application. Discussion with users suggested that the mobile app was overall the least preferred method, for the reasons discussed above. Concluding, we feel that our choice for providing both a custom questionnaire aiming to measure usefulness, ease of use, ease of learning, and satisfaction, and also the more generic SUS questionnaire, provided more information than we would have acquired using just one of them. Although analyses of the questionnaires led to different conclusions, because our main goal was to assess the user experience focusing on perceived usability, and the outcomes of both questionnaires were similar with regard to ease-of-use, we have prioritized the SUS results and discussion with participants, both of which indicated an overall preference for the camera-based method.
Plans for future work include the deployment of all the aforementioned approaches within a real-life scenario in the context of the SYNTELESIS research project, which is based on an open IoT-enabled ecosystem and aims to develop innovative technologies and applications in the fields of information and communications technology, health, culture, and tourism (Pierris, Kothris, Spyrou, & Spyropoulos, 2015). More specifically, existing infrastructure will be exploited to support novel technologies and applications extending from smart devices and sensors to intelligent data storage, processing, and management. Our work within SYNTELESIS will focus on the development of algorithms and methods for multimodal information fusion for human action and event recognition, with application to the recognition of activities of daily living and human physiological parameters within a smart monitoring environment. Among our goals is to evaluate the accuracy of heart-rate measurement approaches in real-life conditions and also to assess the user experience of real-life users upon their usage at a longer time period and within daily living. More specifically, in the case of the camera-based method, we also plan to use HD cameras, embedded cameras of tablets, smart TVs, and even smart mirrors. Other possible applications that are also relevant to the aforementioned use case include monitoring during exercising, in-car monitoring, baby monitoring, and within the broader area of telemedicine and so on. Concluding, it is our strong belief that non-invasive approaches include all the prerequisites to evolve into a popular application of daily life.
Recommendations
All three methods for non-invasive heart-rate measurement can be transformed into IoT services running in the cloud. In the case of the camera-based method of measurement, the sensor (camera) could be deployed, for example, at the home of a person. A low-cost computer system or a VLSI implementation of a feature extraction algorithm could undertake the feature extraction step. Features could then be sent to processing cloud services for the estimation of the heart rate, and a decision-making step would then take place so as to detect a possible anomaly that would trigger an appropriate actuation, for example, notify a caretaker. Note that processing would only require features; no actual video data would “leave” the house, so as to respect privacy issues. Moreover, there is no necessity for storing raw video data; upon heart rate estimation, they could be immediately discarded. Of course, because the other two methods require a mobile phone for their use, they could also be transformed into IoT services and may obviously be available for monitoring even outside home environment.
Tips for Usability Practitioners
Finally, we offer several suggestions for usability practitioners within the field of human-computer interaction and more specifically within the area of physiological measurements using cameras and/or wearables:
- Always explain in detail how devices fit on the body and allow users to experiment with the devices so as to get familiar.
- If possible, let the users borrow them, so as to use them within their home environment in their daily life.
- Make users feel comfortable during experiments. Make clear that they could stop any session of measurements or experiments should they feel discomfort.
- When using cameras, it is important to assure users that no video data are stored (if that is the case).
- Before the beginning of experiments, make sure that everything works correctly; volunteering users may not like delays.
- Be the one to demonstrate the process of measurements, so that users are assured that it is not harmful.
- Prior to the experiments, let the users know the amount of time needed for the evaluation process and for answering questionnaires or for taking part in interviews; provide an estimation as accurate as possible.
- Be prepared to answer technical questions from users with simplified language; avoid complicated terminology and confusing details.
- When using more than one questionnaire, be prepared to encounter (and justify) different results.
Acknowledgements
We acknowledge support of this work by the project SYNTELESIS “Innovative Technologies and Applications based on the Internet of Things (IoT) and the Cloud Computing” (MIS 5002521) which is implemented under the “Action for the Strategic Development on the Research and Technological Sector,” funded by the Operational Programme “Competitiveness, Entrepreneurship and Innovation” (NSRF 2014-2020) and co-financed by Greece and the European Union (European Regional Development Fund). Eirini Mathe has received funding from the Hellenic Foundation for Research and Innovation (HFRI) and the General Secretariat for Research and Technology (GSRT), under grant agreement No 273 (Funding Decision: ΓΓΕΤ122785/I2/19-07-2018). The authors gratefully acknowledge Dr. James (Jim) R. Lewis for his helpful comments and suggestions throughout the revision process of this work.
References
Allen, J. (2007). Photoplethysmography and its application in clinical physiological measurement. Physiological Measurement, 28(3), R1.
Balakrishnan, G., Durand, F., & Guttag, J. (2013). Detecting pulse from head motions in video. In IEEE Conference on Computer Vision and Pattern Recognition (CVPR; pp. 3430–3437). Portland, OR: IEEE.
Bertram, D. (2007). Likert scales… are the meaning of life. CPSC 681-Topic Report.
Bradski, G., & Kaehler, A. (2008). Learning OpenCV: Computer vision with the OpenCV library. O’Reilly Media, Inc.
Brooke, J. (1996). SUS: A ‘quick and dirty’ usability scale. In P. Jordan, B. Thomas, & B. Weerdmeester (Eds.), Usability Evaluation in Industry (pp. 189–194). Taylor & Francis.
Chin, J. P., Diehl, V. A., & Norman, K. L. (1988). Development of an instrument measuring user satisfaction of the human–computer interface. In E. Soloway, D. Frye, & S. B. Sheppard (Eds.), Proceedings of CHI 1988 (pp. 213–218). Washington, DC: ACM.
Comon, P. (1994). Independent component analysis, a new concept? Signal Processing, 36(3), 287–314.
Fox, K., Borer, J. S., Camm, A. J., Danchin, N., Ferrari, R., Sendon, J. L. L., … & Heart Rate Working Group. (2007). Resting heart rate in cardiovascular disease. Journal of the American College of Cardiology, 50(9), 823–830.
Grimaldi, D., Kurylyak, Y., Lamonaca, F., & Nastro, A. (2011). Photoplethysmography detection by smartphone’s videocamera. In Proceedings of the 6th IEEE International Conference on Intelligent Data Acquisition and Advanced Computing Systems (Vol. 1, pp. 488–491). Prague, Czech Republic: IEEE.
Gupta, O., McDuff, D., & Raskar, R. (2016). Real-time physiological measurement and visualization using a synchronized multi-camera system. In Proceedings of the IEEE Conference on Computer Vision and Pattern Recognition Workshops (pp. 46–53). Las Vegas, NV: IEEE.
Lewis, J. R. (1993). Multipoint scales: Mean and median differences and observed significance levels. International Journal of Human‐Computer Interaction, 5(4), 383–392.
Lewis, J. R. (2014). Usability: Lessons learned… and yet to be learned. International Journal of Human-Computer Interaction, 30(9), 663–684.
Jolliffe, I. (2002). Principal component analysis. John Wiley & Sons, Ltd.
Jones, E., Oliphant, T., & Peterson, P. (2014). SciPy: Open source scientific tools for Python. Available at https://www.scipy.org/
Likert, R. (1932). A technique for the measurement of attitudes. Archives of Psychology, 22, 5–55.
Lucas, B. D., & Kanade, T. (1981). An iterative image registration technique with an application to stereo vision. In Proceedings of the 7th International Joint Conference on Artificial Intelligence (pp. 674–679). Vancouver, BC, Canada: Morgan Kaufmann.
Lund, A. M. (2001) Measuring Usability with the USE Questionnaire. STC Usability SIG Newsletter, 8(2), 1–4.
Pavlidis, I., Dowdall, J., Sun, N., Puri, C., Fei, J., & Garbey, M. (2007). Interacting with human physiology. Computer Vision and Image Understanding, 108(1), 150–170.
Pedregosa, F., Varoquaux, G., Gramfort, A., Michel, V., Thirion, B., Grisel, O., … & Vanderplas, J. (2011). Scikit-learn: Machine learning in Python. Journal of Machine Learning Research, 12, 2825–2830.
Pelegris, P., Banitsas, K., Orbach, T., & Marias, K. (2010, August). A novel method to detect heart beat rate using a mobile phone. In Engineering in Medicine and Biology Society (EMBC), 2010 Annual International Conference of the IEEE (pp. 5488–5491). Buenos Aires, Argentina: IEEE.
Peng, R. C., Zhou, X. L., Lin, W. H., & Zhang, Y. T. (2015). Extraction of heart rate variability from smartphone photoplethysmograms. Computational and Mathematical Methods in Medicine, Article ID 516826.
Pierris, G., Kothris, D., Spyrou, E., & Spyropoulos, C. (2015). SYNAISTHISI: An enabling platform for the current internet of things ecosystem. In Proceedings of the 19th Panhellenic Conference on Informatics (pp. 438–444). Athens, Greece: ACM.
Poh, M. Z., McDuff, D. J., & Picard, R. W. (2010). Non-contact, automated cardiac pulse measurements using video imaging and blind source separation. Optics Express, 18(10), 10762–10774.
Sauro, J., & Lewis, J. R. (2016). Quantifying the user experience: Practical statistics for user research (2nd ed.). Morgan Kaufmann.
Shi, J., & Tomasi. C. (1994). Good features to track. In Computer Society Conference on Vision and Pattern Recognition (pp. 593–600). Seattle, WA: IEEE.
Takano, C., & Ohta, Y. (2007). Heart rate measurement based on a time-lapse image. Medical Engineering & Physics, 29(8), 853–857.
Tomasi, C., & Kanade, T. (1991). Detection and tracking of point features (Tech. Report CMU-CS-91–132). Carnegie Mellon University.
Viola, P., & Jones, M. J. (2004). Robust real-time face detection. International Journal of Computer Vision, 57(2), 137–154.
Appendix
For the following tables, Tables 1 through 3 capture the answers of all participants to our questionnaire, and Tables 4 through 6 present the statistical analysis for the aforementioned answers. Tables 7 through 9 capture the answers of all participants to the SUS questionnaire, and Tables 10 through 12 present the respective estimates, the one-way ANOVA analysis within subjects, and the Bonferroni pairwise comparisons between devices for the aforementioned answers.
Appendix Table 1. Participant answers from the evaluation of user experience for the algorithm that estimates heart rate using a camera and a personal computer for our questionnaire (Q = question).
|
Our Questionnaire – Heart rate measurement from camera |
||||||||||||||||||||
|
Q |
Participant |
|||||||||||||||||||
|
1 |
2 |
3 |
4 |
5 |
6 |
7 |
8 |
9 |
10 |
11 |
12 |
13 |
14 |
15 |
16 |
17 |
18 |
19 |
20 |
|
|
1 |
3 |
5 |
5 |
5 |
5 |
4 |
4 |
5 |
5 |
5 |
5 |
5 |
5 |
4 |
5 |
4 |
5 |
5 |
5 |
3 |
|
2 |
3 |
5 |
5 |
3 |
4 |
2 |
4 |
5 |
4 |
5 |
5 |
5 |
4 |
5 |
5 |
4 |
5 |
5 |
5 |
4 |
|
3 |
4 |
3 |
4 |
4 |
4 |
4 |
4 |
4 |
4 |
4 |
4 |
5 |
4 |
5 |
5 |
4 |
4 |
4 |
5 |
3 |
|
4 |
5 |
4 |
5 |
4 |
5 |
4 |
4 |
4 |
4 |
4 |
4 |
5 |
5 |
4 |
5 |
3 |
5 |
4 |
5 |
3 |
|
5 |
5 |
5 |
5 |
4 |
5 |
4 |
4 |
5 |
5 |
5 |
4 |
5 |
5 |
4 |
5 |
4 |
5 |
4 |
5 |
4 |
|
6 |
4 |
5 |
5 |
4 |
5 |
4 |
4 |
5 |
5 |
5 |
5 |
5 |
4 |
4 |
5 |
4 |
5 |
4 |
5 |
3 |
|
7 |
3 |
4 |
5 |
3 |
4 |
4 |
4 |
3 |
5 |
4 |
4 |
4 |
4 |
4 |
5 |
3 |
5 |
4 |
5 |
3 |
|
8 |
1 |
4 |
4 |
5 |
4 |
3 |
4 |
4 |
4 |
4 |
4 |
5 |
4 |
4 |
4 |
5 |
4 |
4 |
5 |
2 |
|
9 |
2 |
4 |
5 |
3 |
3 |
4 |
4 |
5 |
5 |
4 |
3 |
4 |
5 |
5 |
5 |
5 |
4 |
4 |
5 |
2 |
|
10 |
3 |
4 |
5 |
4 |
4 |
2 |
4 |
5 |
5 |
4 |
3 |
3 |
4 |
4 |
5 |
4 |
4 |
5 |
5 |
3 |
|
11 |
4 |
5 |
4 |
5 |
5 |
4 |
5 |
5 |
5 |
5 |
4 |
5 |
5 |
5 |
5 |
4 |
4 |
5 |
5 |
3 |
|
12 |
5 |
5 |
5 |
5 |
5 |
5 |
5 |
4 |
5 |
4 |
4 |
5 |
4 |
4 |
4 |
5 |
4 |
5 |
5 |
4 |
|
13 |
3 |
4 |
5 |
5 |
4 |
2 |
4 |
3 |
4 |
4 |
5 |
5 |
4 |
4 |
4 |
5 |
3 |
4 |
5 |
3 |
|
14 |
3 |
5 |
4 |
5 |
4 |
4 |
4 |
5 |
5 |
4 |
5 |
4 |
3 |
5 |
5 |
4 |
4 |
5 |
5 |
3 |
|
15 |
3 |
5 |
5 |
5 |
5 |
3 |
4 |
5 |
5 |
4 |
5 |
4 |
3 |
4 |
4 |
5 |
4 |
5 |
4 |
3 |
Appendix Table 2. Participant answers from the evaluation of user experience for the mobile phone application for heart rate estimation for our questionnaire (Q = question).
|
Our Questionnaire – Heart rate measurement using a mobile phone |
||||||||||||||||||||
|
Q |
Participant |
|||||||||||||||||||
|
1 |
2 |
3 |
4 |
5 |
6 |
7 |
8 |
9 |
10 |
11 |
12 |
13 |
14 |
15 |
16 |
17 |
18 |
19 |
20 |
|
|
1 |
4 |
5 |
4 |
4 |
4 |
4 |
4 |
5 |
4 |
5 |
5 |
4 |
4 |
3 |
4 |
5 |
4 |
3 |
4 |
4 |
|
2 |
3 |
4 |
5 |
4 |
4 |
5 |
4 |
4 |
4 |
5 |
5 |
4 |
4 |
4 |
4 |
4 |
4 |
3 |
4 |
3 |
|
3 |
3 |
4 |
5 |
4 |
3 |
3 |
5 |
4 |
4 |
3 |
3 |
3 |
4 |
4 |
4 |
3 |
4 |
3 |
3 |
4 |
|
4 |
3 |
5 |
5 |
5 |
4 |
2 |
3 |
4 |
4 |
3 |
3 |
4 |
4 |
4 |
4 |
4 |
3 |
4 |
3 |
3 |
|
5 |
5 |
4 |
4 |
5 |
5 |
4 |
4 |
5 |
5 |
4 |
4 |
3 |
3 |
4 |
4 |
4 |
4 |
3 |
3 |
4 |
|
6 |
4 |
4 |
4 |
4 |
5 |
4 |
4 |
5 |
5 |
4 |
4 |
4 |
3 |
5 |
4 |
4 |
3 |
3 |
4 |
4 |
|
7 |
4 |
4 |
4 |
4 |
5 |
3 |
1 |
2 |
5 |
3 |
3 |
5 |
4 |
4 |
4 |
4 |
4 |
4 |
3 |
4 |
|
8 |
4 |
5 |
4 |
5 |
4 |
3 |
3 |
4 |
4 |
4 |
3 |
5 |
4 |
4 |
3 |
3 |
3 |
3 |
4 |
3 |
|
9 |
4 |
4 |
5 |
3 |
4 |
2 |
3 |
5 |
4 |
4 |
3 |
4 |
3 |
4 |
4 |
3 |
4 |
3 |
5 |
4 |
|
10 |
3 |
4 |
5 |
4 |
3 |
3 |
4 |
5 |
2 |
3 |
3 |
4 |
3 |
3 |
4 |
3 |
4 |
3 |
4 |
4 |
|
11 |
4 |
5 |
5 |
5 |
4 |
4 |
4 |
4 |
4 |
5 |
4 |
3 |
4 |
4 |
3 |
4 |
3 |
3 |
4 |
4 |
|
12 |
5 |
5 |
5 |
5 |
4 |
5 |
4 |
4 |
3 |
4 |
3 |
3 |
4 |
3 |
4 |
3 |
4 |
3 |
3 |
4 |
|
13 |
4 |
5 |
4 |
4 |
4 |
4 |
5 |
1 |
2 |
3 |
2 |
4 |
3 |
4 |
4 |
2 |
4 |
3 |
3 |
4 |
|
14 |
4 |
5 |
4 |
5 |
4 |
4 |
4 |
3 |
4 |
4 |
3 |
3 |
4 |
3 |
3 |
4 |
3 |
3 |
4 |
4 |
|
15 |
3 |
5 |
5 |
5 |
4 |
4 |
4 |
3 |
3 |
4 |
3 |
3 |
3 |
4 |
3 |
3 |
3 |
3 |
4 |
4 |
Appendix Table 3. Participant answers from the evaluation of user experience for the bracelet for heart rate estimation for our questionnaire (Q = question).
|
Our Questionnaire – Heart rate measurement using a smart-bracelet |
||||||||||||||||||||
|
Q |
Participant |
|||||||||||||||||||
|
1 |
2 |
3 |
4 |
5 |
6 |
7 |
8 |
9 |
10 |
11 |
12 |
13 |
14 |
15 |
16 |
17 |
18 |
19 |
20 |
|
|
1 |
4 |
5 |
5 |
4 |
5 |
4 |
4 |
5 |
5 |
5 |
5 |
5 |
5 |
5 |
4 |
5 |
4 |
5 |
5 |
5 |
|
2 |
4 |
5 |
3 |
4 |
4 |
5 |
5 |
5 |
4 |
5 |
4 |
4 |
3 |
4 |
5 |
4 |
5 |
4 |
5 |
5 |
|
3 |
3 |
4 |
4 |
4 |
4 |
2 |
4 |
4 |
5 |
5 |
4 |
4 |
4 |
5 |
4 |
5 |
5 |
5 |
5 |
5 |
|
4 |
4 |
4 |
5 |
4 |
5 |
3 |
5 |
5 |
3 |
4 |
4 |
3 |
5 |
4 |
4 |
3 |
4 |
5 |
4 |
3 |
|
5 |
5 |
5 |
4 |
5 |
5 |
4 |
5 |
4 |
3 |
5 |
4 |
5 |
4 |
5 |
5 |
4 |
5 |
5 |
4 |
5 |
|
6 |
3 |
4 |
4 |
4 |
5 |
5 |
5 |
5 |
3 |
4 |
4 |
5 |
5 |
4 |
4 |
4 |
5 |
4 |
5 |
5 |
|
7 |
4 |
4 |
4 |
4 |
3 |
3 |
2 |
5 |
4 |
5 |
5 |
4 |
5 |
4 |
3 |
5 |
5 |
4 |
5 |
4 |
|
8 |
5 |
5 |
4 |
4 |
3 |
3 |
4 |
5 |
3 |
4 |
5 |
4 |
5 |
4 |
4 |
4 |
5 |
4 |
4 |
5 |
|
9 |
4 |
4 |
5 |
3 |
4 |
3 |
3 |
5 |
4 |
4 |
4 |
5 |
4 |
3 |
5 |
4 |
4 |
4 |
5 |
4 |
|
10 |
3 |
4 |
4 |
4 |
5 |
3 |
4 |
4 |
4 |
4 |
5 |
5 |
4 |
4 |
5 |
4 |
4 |
4 |
5 |
5 |
|
11 |
4 |
5 |
4 |
5 |
5 |
4 |
4 |
4 |
4 |
5 |
5 |
5 |
4 |
5 |
4 |
4 |
5 |
5 |
4 |
4 |
|
12 |
5 |
5 |
5 |
5 |
5 |
5 |
4 |
5 |
4 |
5 |
4 |
5 |
5 |
5 |
5 |
5 |
5 |
5 |
4 |
5 |
|
13 |
4 |
5 |
3 |
4 |
4 |
4 |
3 |
5 |
3 |
4 |
4 |
4 |
5 |
3 |
5 |
4 |
3 |
4 |
4 |
3 |
|
14 |
4 |
5 |
5 |
5 |
4 |
4 |
4 |
4 |
4 |
4 |
4 |
4 |
4 |
5 |
5 |
4 |
5 |
4 |
5 |
4 |
|
15 |
5 |
5 |
4 |
5 |
5 |
4 |
3 |
4 |
4 |
4 |
4 |
4 |
5 |
5 |
4 |
5 |
4 |
4 |
5 |
4 |
Appendix Table 4. Statistical analysis of the results from the evaluation of user experience for the algorithm that estimates heart rate using a camera and a personal computer (Qi: i-th quartile value, i.e., Q1:25%, Q2:50% – median, Q3: 75%, Q4 – max) and for our own questionnaire.
|
Heart rate measurement from camera |
||||||||||||
|
Question |
Statistics |
i-th quartile (Qi) |
Answer |
|||||||||
|
Mean |
Median |
Mode |
Q1 |
Q2 |
Q3 |
Q4 |
1 |
2 |
3 |
4 |
5 |
|
|
1 |
4.6 |
5 |
5 |
4 |
5 |
5 |
5 |
0 |
0 |
2 |
4 |
14 |
|
2 |
4.35 |
5 |
5 |
4 |
5 |
5 |
5 |
0 |
1 |
2 |
6 |
11 |
|
3 |
4.1 |
4 |
4 |
4 |
4 |
4 |
5 |
0 |
0 |
2 |
4 |
14 |
|
4 |
4.3 |
4 |
4 |
4 |
4 |
5 |
5 |
0 |
0 |
2 |
10 |
8 |
|
5 |
4.6 |
5 |
5 |
4 |
5 |
5 |
5 |
0 |
0 |
0 |
8 |
12 |
|
6 |
4.5 |
5 |
5 |
4 |
5 |
5 |
5 |
0 |
0 |
1 |
8 |
11 |
|
7 |
4 |
4 |
4 |
3.75 |
4 |
4.25 |
5 |
0 |
0 |
5 |
10 |
5 |
|
8 |
3.9 |
4 |
4 |
4 |
4 |
4 |
5 |
1 |
1 |
1 |
13 |
4 |
|
9 |
4.05 |
4 |
5 |
3.75 |
4 |
5 |
5 |
0 |
2 |
3 |
7 |
8 |
|
10 |
4 |
4 |
4 |
3.75 |
4 |
5 |
5 |
0 |
1 |
4 |
9 |
6 |
|
11 |
4.6 |
5 |
5 |
4 |
5 |
5 |
5 |
0 |
0 |
1 |
6 |
13 |
|
12 |
4.6 |
5 |
5 |
4 |
5 |
5 |
5 |
0 |
0 |
0 |
8 |
12 |
|
13 |
4 |
4 |
4 |
3.75 |
4 |
5 |
5 |
0 |
1 |
4 |
9 |
6 |
|
14 |
4.3 |
4 |
5 |
4 |
4 |
5 |
5 |
0 |
0 |
3 |
8 |
9 |
|
15 |
4.25 |
4 |
5 |
4 |
4 |
5 |
5 |
0 |
0 |
4 |
7 |
9 |
Appendix Table 5. Statistical analysis of the results from the evaluation of user experience for the mobile phone application for heart rate estimation (Qi: i-th quartile value, i.e., Q1:25%, Q2:50% – median, Q3: 75%, Q4 – max) and for our own questionnaire.
|
PPG-based heart rate measurement using a mobile phone |
||||||||||||
|
Question |
Statistics |
i-th quartile (Qi) |
Answer |
|||||||||
|
Mean |
Median |
Mode |
Q1 |
Q2 |
Q3 |
Q4 |
1 |
2 |
3 |
4 |
5 |
|
|
1 |
4.15 |
4 |
4 |
4 |
4 |
4.25 |
5 |
0 |
0 |
2 |
13 |
5 |
|
2 |
4.05 |
4 |
4 |
4 |
4 |
4 |
5 |
0 |
0 |
3 |
13 |
4 |
|
3 |
3.65 |
4 |
3 |
3 |
4 |
4 |
5 |
0 |
0 |
9 |
9 |
2 |
|
4 |
3.7 |
4 |
4 |
3 |
4 |
4 |
5 |
0 |
1 |
7 |
9 |
3 |
|
5 |
4.05 |
4 |
4 |
4 |
4 |
4.25 |
5 |
0 |
0 |
4 |
11 |
5 |
|
6 |
4.05 |
4 |
4 |
4 |
4 |
4 |
5 |
0 |
0 |
3 |
13 |
4 |
|
7 |
3.7 |
4 |
4 |
3 |
4 |
4 |
5 |
1 |
1 |
4 |
11 |
3 |
|
8 |
3.75 |
4 |
4 |
3 |
4 |
4 |
5 |
0 |
0 |
8 |
9 |
3 |
|
9 |
3.75 |
4 |
4 |
3 |
4 |
4 |
5 |
0 |
1 |
6 |
10 |
3 |
|
10 |
3.55 |
3.5 |
3 |
3 |
3.5 |
4 |
5 |
0 |
1 |
9 |
8 |
2 |
|
11 |
4 |
4 |
4 |
4 |
4 |
4 |
5 |
0 |
0 |
4 |
12 |
4 |
|
12 |
3.9 |
4 |
4 |
3 |
4 |
4.25 |
5 |
0 |
0 |
7 |
8 |
5 |
|
13 |
3.45 |
4 |
4 |
3 |
4 |
4 |
5 |
1 |
3 |
4 |
10 |
2 |
|
14 |
3.75 |
4 |
4 |
3 |
4 |
4 |
5 |
0 |
0 |
7 |
11 |
2 |
|
15 |
3.65 |
3.5 |
3 |
3 |
3.5 |
4 |
5 |
0 |
0 |
10 |
7 |
3 |
Appendix Table 6. Statistical analysis of the results from the evaluation of user experience for the bracelet for heart rate estimation (Qi: i-th quartile value, i.e., Q1:25%, Q2:50% – median, Q3: 75%, Q4 – max) and for our own questionnaire.
|
PPG-based heart rate measurement using a smart-bracelet |
||||||||||||
|
Question |
Statistics |
i-th quartile (Qi) |
Answer |
|||||||||
|
Mean |
Median |
Mode |
Q1 |
Q2 |
Q3 |
Q4 |
1 |
2 |
3 |
4 |
5 |
|
|
1 |
4.7 |
5 |
5 |
4 |
5 |
5 |
5 |
0 |
0 |
0 |
6 |
14 |
|
2 |
4.35 |
4 |
4 |
4 |
4 |
5 |
5 |
0 |
0 |
2 |
9 |
9 |
|
3 |
4.25 |
4 |
4 |
4 |
4 |
5 |
5 |
0 |
1 |
1 |
10 |
8 |
|
4 |
4.05 |
4 |
4 |
3.75 |
4 |
5 |
5 |
0 |
0 |
5 |
9 |
6 |
|
5 |
4.55 |
5 |
5 |
4 |
5 |
5 |
5 |
0 |
0 |
1 |
7 |
12 |
|
6 |
4.35 |
4 |
4 |
4 |
4 |
5 |
5 |
0 |
0 |
2 |
9 |
9 |
|
7 |
4.1 |
4 |
4 |
4 |
4 |
5 |
5 |
0 |
1 |
3 |
9 |
7 |
|
8 |
4.2 |
4 |
4 |
4 |
4 |
5 |
5 |
0 |
0 |
3 |
10 |
7 |
|
9 |
4.05 |
4 |
4 |
4 |
4 |
4.25 |
5 |
0 |
0 |
4 |
11 |
5 |
|
10 |
4.2 |
4 |
4 |
4 |
4 |
5 |
5 |
0 |
0 |
2 |
12 |
6 |
|
11 |
4.45 |
4 |
4 |
4 |
4 |
5 |
5 |
0 |
0 |
0 |
11 |
9 |
|
12 |
4.8 |
5 |
5 |
5 |
5 |
5 |
5 |
0 |
0 |
0 |
4 |
16 |
|
13 |
3.9 |
4 |
4 |
3 |
4 |
4 |
5 |
0 |
0 |
6 |
10 |
4 |
|
14 |
4.35 |
4 |
4 |
4 |
4 |
5 |
5 |
0 |
0 |
0 |
13 |
7 |
|
15 |
4.35 |
4 |
4 |
4 |
4 |
5 |
5 |
0 |
0 |
1 |
11 |
8 |
Appendix Table 7. Participant answers from the evaluation of user experience for the algorithm that estimates heart rate using a camera and a personal computer for the SUS questionnaire (Q = question).
|
SUS – Heart rate measurement from camera |
||||||||||||||||||||
|
Q |
Participant |
|||||||||||||||||||
|
1 |
2 |
3 |
4 |
5 |
6 |
7 |
8 |
9 |
10 |
11 |
12 |
13 |
14 |
15 |
16 |
17 |
18 |
19 |
20 |
|
|
1 |
5 |
4 |
4 |
4 |
5 |
5 |
4 |
3 |
4 |
5 |
4 |
5 |
5 |
4 |
5 |
5 |
3 |
4 |
5 |
4 |
|
2 |
2 |
3 |
1 |
2 |
2 |
2 |
2 |
2 |
2 |
2 |
2 |
2 |
1 |
1 |
3 |
2 |
2 |
1 |
2 |
2 |
|
3 |
4 |
3 |
5 |
4 |
5 |
5 |
5 |
5 |
5 |
4 |
4 |
4 |
4 |
5 |
4 |
4 |
5 |
4 |
5 |
4 |
|
4 |
3 |
2 |
1 |
3 |
3 |
2 |
1 |
2 |
3 |
2 |
3 |
2 |
3 |
2 |
2 |
3 |
2 |
2 |
3 |
2 |
|
5 |
4 |
3 |
4 |
4 |
4 |
3 |
4 |
3 |
3 |
4 |
4 |
4 |
4 |
4 |
3 |
4 |
3 |
4 |
4 |
4 |
|
6 |
2 |
3 |
3 |
2 |
1 |
2 |
2 |
2 |
1 |
2 |
2 |
2 |
1 |
2 |
1 |
1 |
1 |
2 |
2 |
3 |
|
7 |
5 |
4 |
4 |
5 |
4 |
5 |
5 |
5 |
5 |
4 |
5 |
4 |
4 |
5 |
4 |
5 |
4 |
4 |
4 |
4 |
|
8 |
1 |
3 |
2 |
2 |
1 |
2 |
2 |
2 |
2 |
3 |
2 |
1 |
1 |
1 |
2 |
2 |
2 |
2 |
2 |
1 |
|
9 |
4 |
5 |
5 |
5 |
4 |
4 |
5 |
5 |
5 |
3 |
4 |
4 |
5 |
4 |
3 |
4 |
4 |
5 |
4 |
3 |
|
10 |
1 |
3 |
2 |
1 |
2 |
2 |
2 |
3 |
2 |
3 |
2 |
2 |
2 |
1 |
1 |
1 |
2 |
2 |
2 |
3 |
Appendix Table 8. Participant answers from the evaluation of user experience for the mobile phone application for heart rate estimation for the SUS questionnaire (Q = question).
|
SUS – PPG-based heart rate measurement using a mobile phone |
||||||||||||||||||||
|
Q |
Participant |
|||||||||||||||||||
|
1 |
2 |
3 |
4 |
5 |
6 |
7 |
8 |
9 |
10 |
11 |
12 |
13 |
14 |
15 |
16 |
17 |
18 |
19 |
20 |
|
|
1 |
4 |
4 |
4 |
4 |
4 |
3 |
4 |
3 |
5 |
4 |
4 |
4 |
4 |
4 |
3 |
4 |
4 |
4 |
4 |
4 |
|
2 |
3 |
2 |
3 |
2 |
3 |
3 |
2 |
2 |
2 |
2 |
2 |
2 |
2 |
1 |
2 |
1 |
2 |
2 |
1 |
1 |
|
3 |
3 |
4 |
4 |
4 |
4 |
5 |
5 |
4 |
4 |
4 |
4 |
4 |
4 |
3 |
4 |
4 |
4 |
4 |
4 |
4 |
|
4 |
2 |
3 |
2 |
2 |
2 |
2 |
2 |
2 |
1 |
1 |
2 |
2 |
2 |
2 |
2 |
2 |
2 |
3 |
2 |
2 |
|
5 |
3 |
3 |
2 |
3 |
3 |
3 |
3 |
3 |
2 |
4 |
2 |
4 |
4 |
4 |
4 |
4 |
4 |
4 |
3 |
3 |
|
6 |
3 |
2 |
2 |
3 |
2 |
3 |
2 |
3 |
2 |
3 |
2 |
3 |
2 |
3 |
3 |
2 |
3 |
2 |
3 |
2 |
|
7 |
4 |
5 |
4 |
5 |
4 |
3 |
4 |
3 |
4 |
4 |
4 |
4 |
4 |
4 |
4 |
4 |
4 |
4 |
4 |
4 |
|
8 |
4 |
3 |
2 |
4 |
2 |
2 |
1 |
2 |
4 |
2 |
3 |
4 |
3 |
4 |
3 |
2 |
1 |
4 |
3 |
2 |
|
9 |
4 |
4 |
4 |
4 |
4 |
3 |
4 |
3 |
4 |
4 |
4 |
5 |
5 |
4 |
5 |
3 |
4 |
5 |
4 |
3 |
|
10 |
2 |
2 |
1 |
2 |
2 |
1 |
1 |
3 |
1 |
3 |
2 |
2 |
2 |
1 |
2 |
2 |
3 |
1 |
3 |
2 |
Appendix Table 9. Participant answers from the evaluation of user experience for the bracelet for heart rate estimation for the SUS questionnaire (Q = question).
|
SUS – PPG-based heart rate measurement using a smart-bracelet |
||||||||||||||||||||
|
Q |
Participant |
|||||||||||||||||||
|
1 |
2 |
3 |
4 |
5 |
6 |
7 |
8 |
9 |
10 |
11 |
12 |
13 |
14 |
15 |
16 |
17 |
18 |
19 |
20 |
|
|
1 |
4 |
4 |
4 |
4 |
4 |
5 |
5 |
5 |
4 |
5 |
4 |
5 |
4 |
5 |
3 |
4 |
3 |
4 |
5 |
4 |
|
2 |
3 |
2 |
1 |
2 |
2 |
2 |
3 |
1 |
1 |
2 |
1 |
2 |
2 |
2 |
2 |
1 |
1 |
3 |
2 |
2 |
|
3 |
4 |
5 |
4 |
5 |
4 |
5 |
4 |
3 |
4 |
4 |
4 |
5 |
5 |
4 |
4 |
4 |
4 |
3 |
4 |
4 |
|
4 |
3 |
4 |
3 |
2 |
4 |
4 |
3 |
2 |
2 |
2 |
2 |
2 |
2 |
2 |
2 |
2 |
2 |
2 |
2 |
2 |
|
5 |
3 |
4 |
3 |
2 |
3 |
2 |
4 |
3 |
3 |
4 |
2 |
3 |
3 |
4 |
3 |
4 |
4 |
4 |
4 |
4 |
|
6 |
3 |
3 |
3 |
4 |
4 |
4 |
4 |
2 |
3 |
2 |
2 |
2 |
1 |
2 |
3 |
2 |
2 |
3 |
3 |
4 |
|
7 |
4 |
4 |
4 |
3 |
3 |
3 |
3 |
4 |
3 |
4 |
3 |
3 |
3 |
4 |
4 |
4 |
5 |
5 |
5 |
3 |
|
8 |
4 |
3 |
3 |
3 |
3 |
2 |
2 |
2 |
2 |
1 |
1 |
1 |
1 |
2 |
2 |
1 |
2 |
3 |
4 |
2 |
|
9 |
4 |
4 |
5 |
4 |
3 |
4 |
4 |
4 |
5 |
3 |
4 |
5 |
4 |
4 |
4 |
4 |
4 |
4 |
4 |
4 |
|
10 |
2 |
2 |
2 |
2 |
2 |
2 |
2 |
1 |
1 |
3 |
1 |
2 |
2 |
1 |
2 |
2 |
2 |
2 |
2 |
2 |
Appendix Table 10. Estimates of the three devices from the SUS questionnaire.
|
Method |
Mean |
Std. error |
95% Confidence interval |
|
|
Lower bound |
Upper bound |
|||
|
Camera |
78.375 |
1.348 |
75.553 |
81.197 |
|
Mobile app |
70.000 |
1.058 |
67.787 |
72.213 |
|
Bracelet |
70.750 |
1.643 |
67.310 |
74.190 |
Appendix Table 11. Results of one-way ANOVA analysis within-subjects (repeated measures) for the answers of the SUS questionnaire. Methods are camera, mobile app, and bracelet.
|
Source |
Sum of squares |
Degrees of freedom |
Mean square |
F |
P |
|
|
Method |
Sphericity assumed |
858.958 |
2 |
429.479 |
12.600 |
.000 |
|
Greenhouse-Geisser |
858.958 |
1.793 |
479.112 |
12.600 |
.000 |
|
|
Huynh-Feldt |
858.958 |
1.968 |
436.559 |
12.600 |
.000 |
|
|
Lower-bound |
858.958 |
1.000 |
858.958 |
12.600 |
.002 |
|
|
Error (method) |
Sphericity assumed |
1295.208 |
38 |
34.084 |
|
|
|
Greenhouse-Geisser |
1295.208 |
34.063 |
38.023 |
|
|
|
|
Huynh-Feldt |
1295.208 |
37.384 |
34.646 |
|
|
|
|
Lower-bound |
1295.208 |
19.000 |
68.169 |
|
|
|
Appendix Table 12. Bonferroni pairwise comparisons between devices, for the answers of the SUS questionnaire. Mean differences noted with * are significant at the .05 level.
|
Method A |
Method B |
Mean difference A-B |
Std. error |
Sig. |
95% Confidence interval |
|
|
Lower bound |
Upper bound |
|||||
|
Camera |
Mobile app |
8.375* |
1.605 |
.000 |
4.163 |
12.587 |
|
Bracelet |
7.625* |
2.127 |
.006 |
2.043 |
13.207 |
|
|
Mobile app |
Camera |
-8.375* |
1.605 |
.000 |
-12.587 |
-4.163 |
|
Bracelet |
-.750 |
1.769 |
1.000 |
-5.393 |
3.893 |
|
|
Bracelet |
Camera |
-7.625* |
2.127 |
.006 |
-13.207 |
-2.043 |
|
Mobile app |
.750 |
1.769 |
1.000 |
-3.893 |
5.393 |
|
[1] https://play.google.com/store/apps/details?id=si.modula.android.instantheartrate
[2] http://www.mi.com/en/miband/
[:]