Abstract
In this study, we report the findings of a comparative usability evaluation of a tag-based interface and the present conventional interface in the Australian banking context. The tag-based interface is based on user-assigned tags to banking resources with support for different types of customization, while the conventional interface is based on standard HTML objects such as dropdown boxes, lists, and tables, with limited customization. A total of 30 online banking users between the ages of 21 to 50 participated in the study. Each participant carried out a set of tasks on both interfaces and completed a post-test usability questionnaire. Additional feedback was sought from the participant through a post-evaluation debriefing session. Efficiency, effectiveness, and user satisfaction were considered to evaluate the usability of the interfaces. The results of the evaluation show that the tag-based interface improved usability over the conventional interface in terms of user satisfaction in both online and mobile contexts. This outcome is particularly apparent in the mobile context among inexperienced users. We conclude that there is a potential for the tag-based interface to improve user satisfaction of online and mobile banking, and also to positively affect the adoption and acceptance of mobile banking, particularly in Australia.
Practitioner’s Take Away
The following are tips for usability practitioners:
- Conduct a pilot study to debug the details of your test procedure.
- Use SUS for a quick and easy measure of perceived usability.
- Use task completion times and activity/observation logs to measure the actual usability (efficiency and effectiveness).
- Prior to evaluation, brief and familiarize the participants with the different interfaces via a demo and test activity.
- Prior to evaluation, go through the SUS questionnaire with each participant to ensure he/she thoroughly understands every question as the language used may be a little hard to understand especially for non-native English speakers.
- Conduct a debriefing session to reaffirm the answers provided by the participant for the SUS questionnaire and also to ascertain the usability problems that were observed during evaluation.
- Compare and contrast the summative experience ratings with the SUS scores to better understand the perceived usability of the interfaces evaluated.
Introduction
Tags are a Web 2.0 technology, enabling users to assign keywords to Web resources (e.g., photo, video, people, etc.) primarily for the purpose of information management (see Figure 1; Flickr is a website that allows users to manage and share photographs online). Tags are a popular and easy-to-use technology (Smith, 2007); personal, contextual, and dynamic (Marlow, Naaman, Boyd, & Davis, 2006); and a source of knowledge about users (Durao & Dolog, 2009). Tags aid users to recall and retrieve information content, and when represented as tag clouds (see Figure 1 and 2), they facilitate visual information retrieval (Hassan-Montero & Herrero-Solana, 2006). Tags can also help to establish associations between like minded individuals through analysis of tag semantics (Durao & Dolog, 2009; Qi Xin, Uddin, & Geun-Sik, 2010).
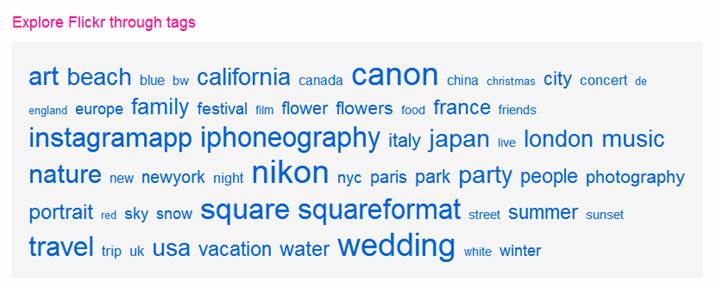
Figure 1. Flickr photo tag cloud (source:
http://www.flickr.com/explore/, Reproduced with permission of Yahoo! Inc. (c)2012 Yahoo! Inc. FLICKR is a registered trademark of Yahoo! Inc.)
The tag-cloud shown in Figure 1 is weighted based on tag occurrence frequency. Frequency is represented through varying font sizes where a higher frequency has a larger font size and vice-versa.
Tags are widely used in the financial services domain to aid personal financial management (see Figure 2, a sample financial tag cloud) via either external tools such as Mint1 or bank provided tools such as Australia-New Zealand (ANZ) Bank’s MoneyManager2 service. These tools enable users to assign tags to annotate transactional data for purposes such as budgeting, expense tracking, cash flow analysis, etc. However, the tools only allow users to assign tags to financial transactions at a high level such as category or description, but not at a fine-grained level for resources such as bank accounts or billers. There may be compelling advantages to assigning tags at a lower level of detail, particularly in the online and mobile banking contexts, which could open the doors to tag-based interaction alongside personal financial management.
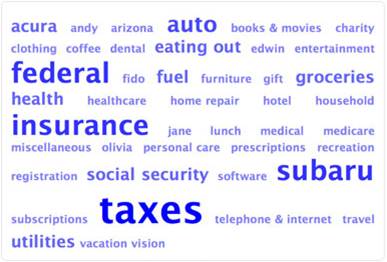
Figure 2. Financial tag cloud
The tag-cloud shown in Figure 2 is weighted based on tag transaction amount. Amount is represented through varying font sizes where a higher frequency has a larger font size and vice-versa.
The earlier mentioned characteristics of tags, particularly personal and contextual, appear suitable to afford customized interactions that are unique to every individual based on tags assigned to resources. We refer to this notion as tag-based interaction. To date, tags have yet to be studied in the online and mobile banking contexts to afford customized interactions. Such research is important as customization is cited as a key determinant of user satisfaction of online banking in Australia (Rahim & JieYing, 2009).
In this study, we explored the use of tags to facilitate customization based on a conceptual interaction customization framework put forward by Fung (2008).
We hypothesized that tag-based interaction can improve usability, especially the user satisfaction of online and mobile banking. Aside from usability, other motivations for this study include mobile banking adoption issues such as privacy and security (Wessels & Drennan, 2010). Through the use of personal tags, users may feel more comfortable carrying out banking transactions using their mobile devices especially in public places given that only tags are displayed on screen, which is less likely to be meaningful to other individuals.
The rest of this article is structured as follows. In the next section we provide background on our work. Then we outline the method and process of our evaluation. Next we report on the evaluation results and discuss the findings. Subsequently we present a list of challenges related to the tag-based interface/interaction and recommend a set of potential solutions. Finally we conclude the study and describe future work.
Background
In this section, we introduce the range of taggable resources identified in online and mobile banking and the different types of customization supported via user-defined tags.
Taggable Resources
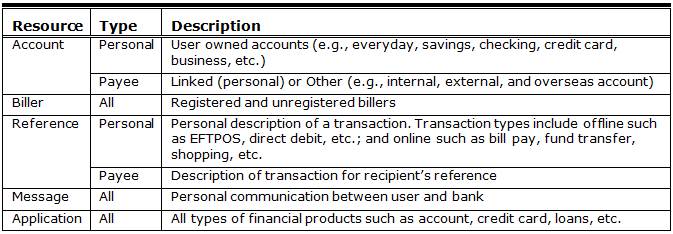
There are five types of key resources in online and mobile banking: bank account, biller, reference, message, and application (Ravendran, MacColl, & Docherty, 2011a, 2011b). These resources were identified through examination of the online and mobile banking websites of two leading banks3 in Australia. The examination specifically focused on personal banking as it appeals to a larger audience.
Table 1. Taggable Resources
Customization
We adopted the conceptual interaction customization model based on human-to-human interaction proposed by Fung (2008). In our earlier work (Ravendran et al., 2011b), we framed interaction customization as part of a broader work on customization as seen in the literature. This was important to both understand and distinguish interaction customization from other types of customization. Interaction customization encompasses three types: remembrance-based, comprehension-based, and association-based.
The following sections provide a brief definition of each interaction type and discuss the application of tags to facilitate these interactions in the banking context.
Remembrance-based
The remembrance-based customization is defined as customization through simple remembering of user’s information based on the recurrence rate of a particular action on a website (Fung, 2008). This customization can be fulfilled through tags assigned to resources that are presented as tag clouds (Ravendran et al., 2011a, 2011b). This provides a visual retrieval interface that can simplify and ease the execution of past or recurring transactions. Simply by clicking on a tag, related information about a transaction that the tag is associated with can be retrieved and displayed. If a selected tag is associated with two or more tags then the tag cloud can be filtered to show tags that are co-occurring with the selected tag. This removes the need to navigate to a different page or perform a manual search query. This also means, to carry out a past or recurring transaction, users will only need to update necessary information such as amount (if different) and possibly retain other details. The following scenario and Figure 3 is an example of remembrance-based customization in the online context.
Scenario: Recurring monthly mobile bill payment. User selects “mobile” (1) tag from tag cloud. As a result, the form is auto-completed and relevant tags are pre-selected (checkmark).
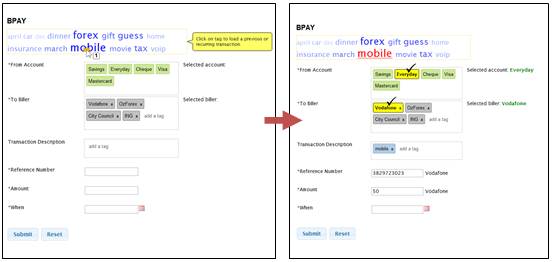
Figure 3. Recurring bill payment
Comprehension-based
The comprehension-based customization is defined as customization through recognition of user’s behaviors used to provide assistance towards fulfilling the user’s needs (Fung, 2008). This customization can be fulfilled by inferring possible banking actions (i.e., fund transfer) based on tags selected by a user (Ravendran et al., 2011a, 2011b). Such an inference is possible for tags with certain types of relations (e.g., account to account, account to biller). Using these relations and simple pre-defined rules (e.g., transfer from Savings account to Visa account is valid but not the other way around) possible actions can be populated. The actions may also constitute different types of services or features offered by the bank for a particular need that otherwise may not be known to the user. By providing users with relevant options, banks may be able to provide subtle suggestions to users based on their personal banking usage. For example, if a user performs fund transfers to a selected payee two months in a row, then a new option suggesting the user to schedule a monthly transfer may be provided. The following is an example of comprehension-based customization in the online context.
Scenario: New fund transfer from Everyday account to John’s account. User selects “Everyday” (1) and then “John” (2) tags. The possible actions are populated as “Transfer from Everyday to John” and “View transaction history of Everyday involving John”.
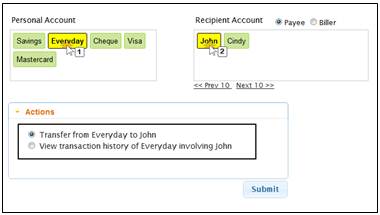
Figure 4. New fund transfer
Association-based
The association-based customization is defined as customization through association of a user’s behaviors with other individuals who share similar interests or needs (Fung, 2008). This customization can be fulfilled by recommending tags to users (Ravendran et al., 2011a, 2011b). Tags can be associated and recommended to users based on certain criteria such as biller name or type. For example, when users select the biller Vodafone, a mobile service provider, tags associated with this specific biller can be recommended (i.e., phone, mobile, etc.). Tags associated with a particular resource can be either defined by users (folksonomy) or system (taxonomy), or both combined (automanual folksonomies; Smith, 2007). The relevance and appeal of recommended tags may be further improved by making sense out of the underlying meanings of tags via semantic analysis (Durao & Dolog, 2009; Qi Xin et al., 2010). This in turn could assist in forming more relevant associations between like-minded individuals within a community of users through discovery of semantic relationship between tags. As a result, recommendations that potentially deliver greater value are plausible, for example, a set of related services based on user’s banking usage. Below is an example of association-based customization in the online context.
Scenario: Tag recommendation for multiple bill payment (mobile and money transfer): User selects “Vodafone” (1) and then “OzForex” (2) biller tags, and then enters or selects a description (3). As a result, a set of related tags are shown that are used in the context of the selected billers.
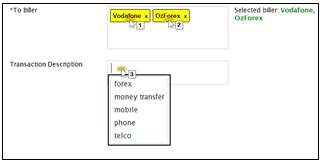
Figure 5. Tag recommendation
1Mint, http://www.mint.com
2ANZ MoneyManager, http://www.anz.com/ANZ-moneymanager/default.asp
3Commonwealth Bank (http://commbank.com.au) and Suncorp Bank (http://www.suncorp.com.au)
Method and Procedure
The following sections discuss the method, evaluation procedures, interfaces, and participants.
Method
To evaluate the usability of the interfaces, we adapted the System Usability Scale (SUS; Brooke, 1996) by replacing system with website. The SUS is a 10-item questionnaire, with Likert scales, that gives an overview of perceived usability in terms of efficiency, effectiveness, and satisfaction as perceived by the user. According to Tullis and Stetson (2004) who compared SUS against other usability questionnaires specifically for website usability assessment, SUS yields among the most reliable results across sample sizes. To yield reasonably reliable results, at least 12-14 participants should be used in a study. Furthermore, as an extension we added an 11th item on “user-friendliness” with adjective descriptions of rating levels of 1-7 (Worst Imaginable, Awful, Poor, OK, Good, Excellent, and Best Imaginable). The purpose of this item was to inquire about the summative experience of participants. This strategy was suggested by a study that empirically evaluated nearly 10 years worth of SUS data collected on numerous products in all phases of the development lifecycle (Bangor, Kortum, & Miller, 2008). The study regarded SUS as a highly robust and versatile tool used in more than 200 studies for usability evaluation. To further ensure SUS is a suitable instrument for our study, we conducted a pilot study with a small group of banking users (see the Procedure – Pilot Study section).
Apart from SUS, we also recorded user activity on the interfaces and logged task completion times. This information was used to examine the actual efficiency and effectiveness, and also to identify potential usability issues on the interfaces
Procedure
Before the start of the evaluation, each participant filled out a pre-test questionnaire that collected demographic details along with computer, Internet, and online banking experience. Subsequently, each participant was given a set of banking tasks (see Table 2) identified from our pilot study as suitable and generic. The tasks were essentially made up of two key activities: bill payment and fund transfer. Each participant completed the tasks in both the conventional and tag-based interfaces. During testing, we observed each participant and maintained an observation log. After completion of the tasks, each participant received an extended SUS questionnaire, which was then followed by a debriefing session to gather additional feedback.
To ensure the absence of any pre-meditated associations in terms of experience and brand commitment with a participant, a fictional banking website was used called XBANK Online Banking. In order to further engage participants with the study, we provided a scenario that outlined XBANK as a new online banking provider committed to better user satisfaction. Participants were told the goal of the XBANK study was to evaluate the usability of two interfaces. The participants were informed that they were a select group of users who were selected to be part of the evaluation. For the purpose of the evaluation, participants were told that he/she owned five accounts: Savings, Everyday, MasterCard, Visa, and Check. The order in which the interfaces and tasks were introduced was counterbalanced.
The study’s goals, objectives, and tasks were explained in an information sheet. The evaluation procedure was detailed at the beginning of each session and in order to familiarize each participant with the interfaces, a brief demo and a test activity was given. Participants assigned tags to banking resources on their own with the tag-based interface.
Table 2. Evaluation Tasks

Post-evaluation debriefing
A post-evaluating debriefing was conducted with each participant upon completion of the usability questionnaire. We asked participants about the overall experience with both interfaces, particularly the challenges and issues faced with the tag-based interface. Additionally, we questioned participants about the degree to which information was made available in both interfaces and their preference. We also asked participants on their perception of tag suggestions as a way to ease tagging. Finally, we sought feedback on the design of the tag-based interface and potential improvements.
Pilot study
A pilot study involving a small group of eight banking users was carried out (Ravendan, MacColl, & Docherty, 2012). The goal of the pilot was to tease out early design impediments and other usability issues prevalent in both interfaces, and to debug the test procedure. Also, we asked participants their five most common online and/or mobile banking tasks. The pilot study helped assess the adapted SUS questionnaire and its ability to offer a reflective and consistent view of users’ perceived usability with the online and mobile contexts. The results showed that users’ views were reflective and consistent of their feedback gathered during debriefing. There was a notable difference between the SUS scores for the conventional and tag-based interfaces. The difference was especially apparent with banking users without prior experience in mobile banking.
Interfaces
For the purpose of this evaluation, we developed a tag-based prototype and a test website that mimicked the conventional banking interface in both online and mobile contexts. We designed the conventional interface with reference to the online and mobile banking websites of Commonwealth Bank and Suncorp Bank (mentioned above). The following sections outline the two interfaces that were evaluated in this study.
Conventional interface
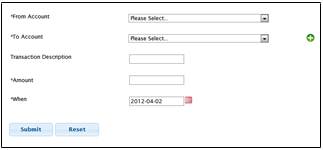
The conventional interface was based on standard HTML objects (dropdowns, checkboxes, tables, and menus) with minimal customization (see Figure 6). From our observation of websites with conventional interfaces, only remembrance-based customization is being supported in the conventional interface. This is achieved via dropdown selection where previously entered information is remembered. For instance, when a user selects a biller that he or she has paid to before from the dropdown selection, the biller details are automatically populated, avoiding the need for the user to re-enter the biller details.
 /p>
/p>
Figure 6. Conventional interface
Tag-based interface
We designed an early web-based prototype with tag integration for a few key resources namely bank account, biller, and reference. Tag-based visualization that included tag clouds and individual tags represented as clickable boxes were used. In Ravendran et al. (2011a, 2011b), a detailed discussion on the design and implementation of the tag-based interface and the different customization types in both online and mobile banking contexts was presented. In this study, we evaluated our tag-based prototype against the conventional banking interface.
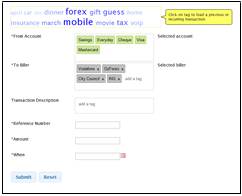
Figure 7. Tag-based interface (online)
Participants
The population of interest for this study is online and mobile banking users. A total of 30 banking users were randomly recruited from the university: 17 males and 13 females between the age group of 21 to 50 (21-30=60%, 31-40=33%, 41-50=7%). The recruitment process was conducted through emails, which were sent to university staff and students. In order to compensate participants for their time and effort, we offered a gift card worth $15. Altogether, there were 22 students and 8 staff who participated in the study. The larger number of participants from the younger age group (21-30) was pertinent to this study given banking customization is most appealing and relevant among this age group (Rahim & JieYing, 2009). According to the pre-test questionnaire, all participants had at least one active online banking account at the time of participation and were familiar with online banking with no less than one year of experience. However, not all participants had prior experience in mobile banking. Figure 6 shows the mobile banking usage and only 54% of the participants had prior experience with mobile banking, while 46% of the participants had never used mobile banking before. Some of key reasons cited for not using mobile banking include security and privacy concerns, high risk of mistyping on a mobile device, and preference for a bigger display screen. Figure 7 shows the most common banking activities carried out by participants via their online/mobile banking provider, which include fund transfer, bill payment, check balance, view history, and credit card payment. Participants had very similar levels of experience with computers and the Web, and indicated that they enjoy using computers and the Internet. Most participants (90%) were familiar with the concept of tags primarily through websites such as Facebook and YouTube, but not in the financial sense. Participation was entirely voluntary, and each individual gave written consent to participate in the study.
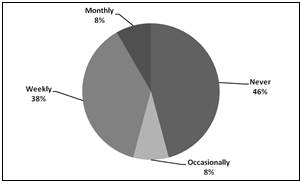
Figure 8. Mobile banking usage
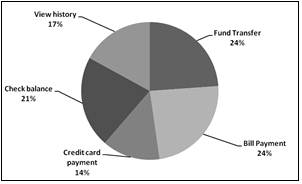
Figure 9. Banking activities
Results
Firstly, we focused on the subjective measures of usability. The following figures 10 and 11 show the computed average SUS scores and summative experience ratings by banking context. The SUS score range was 0-100, and the summative experience rating range was 1-7 (1 = Worst Imaginable, 2 = Awful, 3 = Poor, 4 = OK, 5 = Good, 6 = Excellent, 7 = Best Imaginable).
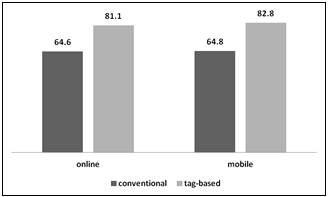
Figure 10. Average SUS scores (online and mobile)
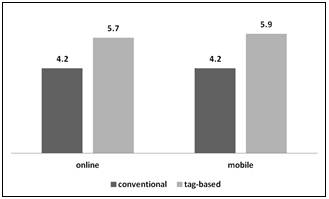
Figure 11. Average summative experience ratings (online and mobile)
Figures 10 and 11 show higher SUS scores and ratings for the tag-based interface compared to the conventional interface in both online and mobile banking. The average SUS scores for the tag-based interface are 81.1 and 82.8, and the average summative experience rating is 5.7 for online and 5.9 for mobile (both in the Excellent range). In contrast, the average SUS scores for the conventional interface are 64.6 and 64.8, and the average summative experience rating is 4.2 (both in the OK range) for both contexts.
To test the significance of the result, we conducted a paired t-test analysis with an alpha of 0.05 (CI: 95%). The t-test analysis showed the differences in the scores and ratings were significant (n=30, p<0.05) in both online (p<0.002) and mobile (p<0.001) contexts.
Given that not all participants of our study had prior experience in mobile banking, we grouped the SUS scores and summative experience ratings by participants’ familiarity with mobile banking. As mentioned above, 54% of participants were familiar with mobile banking. The various levels of familiarity among participants were grouped into two basic categories: inexperienced and experienced.
Figures 12 and 13 show the average SUS scores and summative experience ratings by familiarity with mobile banking.
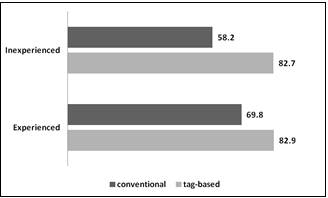
Figure 12. Average SUS Scores by familiarity with mobile banking
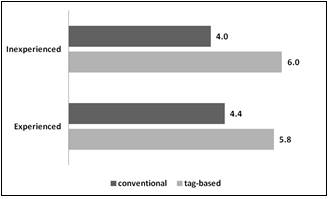
Figure 13. Average summative experience ratings by familiarity with mobile banking
Figure 12 shows the average SUS scores for participants without prior experience are 58.2 and 82.7 for the conventional and tag-based interfaces, respectively. For participants with experience, the average SUS scores are 69.8 and 82.9, respectively. This indicates that participants without prior experience in mobile banking experienced the biggest difference of 24.5%, while the experienced participants recorded a difference of 13.1%. Figure 13 lends support to this outcome by illustrating an increase of 2 rating points among inexperienced participants with an overall individual rating of 4.0 and 6.0 for the conventional and tag-based interfaces. Those ratings are about one rating higher compared to the increase observed with experienced participants with an overall individual rating of 4.4 and 5.8.
Task Completion
All participants managed to complete the given tasks in both contexts. Thus, there was no difference in effectiveness between the two interfaces. The following figure shows the average time spent in seconds on each task by all participants in the online and mobile contexts.
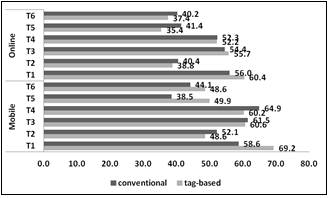
Figure 14. Average task completion times
Figure 14 illustrates that participants in general completed their tasks within a shorter period of time in the online context compared to the mobile context. Overall, the tag-based interface was faster online for 4 out of 6 tasks and 3 out of 6 tasks in the mobile context. The average completion times for the conventional and tag-based interfaces for the online context are 47.4s and 46.7s, and 53.3s and 56.2s for the mobile context. In the online context, participants were faster on the tag-based interface for tasks 2, 4, 5, and 6, but slower for tasks 1 and 3. While in the mobile context, participants were faster on the tag-based interface for tasks 2, 3, and 4 but slower for tasks 1, 5, and 6. Participants spent the most amount of time on task 1 on the tag-based interface in both contexts (60.4s and 69.2s, online and mobile respectively) and a considerably lesser amount of time for the remaining tasks. To ascertain the significance of the task completion times, we conducted a paired t-test analysis with an alpha of 0.05 (CI: 95%). The results showed that the differences of the average task completion times are not significant for either online (p=0.61) or mobile (p=0.36) contexts. Thus, there was no difference in efficiency between the two interfaces.
Discussion
The results from this study support our hypothesis that a tag-based interface can improve usability, particularly user satisfaction, of online and mobile banking. The paired t-test analysis showed that the SUS scores and summative experience ratings were significantly higher with the tag-based interface. Conversely, the difference in average efficiency, measured through task completion times, was not significant in either context. There was no difference in effectiveness, measured by task completion rates, between the interfaces. We did not expect to see a difference in efficiency primarily due to participants’ lack of experience with the tag-based interface. Likewise, the familiarity and generic nature of the evaluation tasks may have made them very easy to complete, and as a result all tasks were successfully completed.
Based on the SUS scores and summative experience ratings, participants were more satisfied with the tag-based interface than the conventional interface. This outcome is more apparent in the mobile context compared to the online context. That finding is possibly due to the ability to carry out transactions via simple tag selections, which in effect reduces the effort required of users on mobile devices. The favorable rating of user-friendliness for tags compared to the conventional design may result from participants finding it easier and simpler to interact via their own tags.
Interestingly, participants with no prior experience in mobile banking were more satisfied with the tag-based interface compared to mobile-experienced participants (see Figure 10 and 11). Alternatively, with the conventional interface, a difference of about 11% was observed as an effect of past mobile banking experiences, which is consistent with the findings reported by Sauro (2011). The high levels of satisfaction observed among inexperienced mobile banking participants suggest that there is a potential for the tag-based interface to positively affect the adoption and acceptance of mobile banking, which is important given that the global customer base of mobile banking is expected to reach close to one billion users by 20154.
As part of the post-evaluation debriefing, we asked participants about minimal information on screen (tag-based) versus detailed information on screen (conventional). Participants preferred seeing minimal information on screen by default and being presented with detailed information when they request it. This may be strongly tied to the security and privacy concerns of banking users especially those related to mobile banking (Wessels & Drennan, 2010). In addition, from our observations and debriefing with participants, the notion of providing tag suggestions as a way to encourage the user to tag and re-use tags already present in the system was well received especially in the mobile context where many found it cumbersome to tag. It was obvious that they preferred to select suggested tags that were appropriate rather than typing their own. However when they did enter their own tags, they expected them to be shown on the top of the list of suggested tags.
The actual user performance is not significantly improved in both contexts. However, participants perceived the tag-based interface as one that can improve their performance and appear to be more satisfied and inclined to use the tag-based interface than the conventional interface. One possible explanation for the poor user performance on the tag-based interface is the unfamiliarity and lack of experience with the new tag-based interaction style. Also, in the mobile context, this issue may have been further exacerbated by a smaller display. Nevertheless, longer task completion times were anticipated for this study partly due to the way the study was carried out (see the Limitations section).
Challenges and Recommendations
In this section we outline the challenges we identified with the tag-based interface, and we provide recommendations for meeting those challenges. These issues are not based on the quantitative data we described above; they are based on qualitative observations made during task performance and on comments from participants during the post-task interviews. There are four issues: minimal information on the tag-based screen, idiosyncratic and ambiguous tags, tagging behavior due to use of the conventional interface, and navigation through a large number of tags.
The first issue is the limitation around the level of information displayed on tag-based screens. The conventional interface provides all relevant information by default to a banking user for decision making. Alternatively, the tag-based interface only displays tags on screen, placing an increased level of responsibility on users to recall or recognize a tag with regards to a resource such as bank account or biller. Therefore, it is important to enable users to retrieve relevant information associated with a tag effortlessly and unobtrusively when required. This ensures users are confident and comfortable with the interface as locus of control (Shneiderman & Plaisant, 2004) remains with them.
This issue can be remedied through dynamic tooltip popups (i.e., jquery tooltip5). Dynamic tooltip popups allow information to be displayed on demand in an unobtrusive fashion. The browser events “hover” and “tap” can be used to trigger the tooltip in online and mobile contexts, respectively. This places a reduced level of effort to view detailed information associated with a tag. From our work, we found that the majority of users prefer information on demand, especially in the mobile context. In addition, visual cues such as font and background color can be used to deliver subtle messages to users. For example, the color green can indicate a healthy account balance and red for an unhealthy account balance. Likewise, font colors can help indicate transaction status: green for success, orange for pending, and red for failure.
The second issue is related to assignment of tags that lack meaning, particularly those that are idiosyncratic and ambiguous. The use of idiosyncratic tags, which at first may appear to users as easy and very personal, can impede the usability of the interface especially in the presence of a large number of tags. Users generally struggle to remember or contextualize tags assigned to transactions that are not meaningful enough like “##21” assigned to a bill payment of 21 dollars, for example. Moreover, idiosyncratic tags need to be excluded from cross-user tag suggestions that otherwise could distort the quality of suggestions and users’ perceived usefulness. Conversely, ambiguous tags can stem from overly generic or synonymous keywords used to describe or categorize a resource. For example, a mobile bill payment tagged as “bill pay” or “payment” does not offer much detail about the transaction nor context for future recall.
This issue can be alleviated by suggesting tags, and educating and training users on tagging best practices. Firstly, through the use of tag suggestions, users can be persuaded to choose an appropriate tag instead of entering their own. Also, to increase the chances of users selecting a suggested tag, the tag suggestion popup can be displayed in a focus of form input box rather than on a keystroke. In other words, the tag suggestion list is shown even before the user starts typing, and tags are filtered as the user types. Secondly, a more sustainable and long-term approach may be education and training on tagging best practices.
The third issue is concerned with the tagging behavior of users, largely influenced by the way in which the conventional interface functions. Instead of inserting discrete and meaningful keywords as tags, users provide a one-line description that is generally lengthy and specific. For example, a rent payment in the month of April was described as “rental payment apr 12” or “rent up to 21 apr.” These descriptions, despite being useful references, do not permit reuse or simple categorization of transactions.
This issue can be addressed by inserting more than one tag. In the example above, tags such as “rental payment” and “april” can help to categorize and simplify the process of tracking and reconciliation. Also, in the following instance, the primary tag “rental payment” can be retained and the secondary tag “april” can be changed to “may,” for example. As a result, tags can be re-used for similar transactions with the option of adding more contexts through addition or replacement of tags.
The fourth and final issue is the challenge of navigating through large numbers of tags (>100). This is likely to become a problem in the long-term, exacerbated by random and unorganized assignment of tags. Also, this issue is a potential challenge for users who use online banking more extensively than others and have a multitude of financial needs. The issue itself is likely to have a more significant impact in the mobile context than online given the display constraints due to smaller screen sizes. Nevertheless, regardless of the banking context, users are likely to find it cumbersome to navigate through their tags for each transaction they conduct. Therefore, a simple and convenient way to discriminate and select tags is essential and paramount.
This issue can be addressed through the addition of several design features. First, a search feature that allows users to quickly lookup tags based on tag name and related transactional details such as date or amount. That feature can be more intuitive by filtering tags as users type. Furthermore, tags can be sorted based on usage in both online and mobile contexts. As a result, the most commonly used tags are shown first by default. Second, the ability to edit past tags can be incorporated to allow users to reorganize and manage their tags. This is important and part of the learning process to better understand the utility of tags and ways to tag effectively.
Limitations
Participants’ lack of experience and familiarity with tags/tagging specifically in the banking context affected the outcome of this study. We believe this played an important role in the actual user performance. In an effort to evaluate the usability of the tag-based interface in a real-world setting, we did not explain what each customized interaction entailed in detail, instead leaving participants to “discover.” We only offered explanation in the event participants experienced difficulties in completing a particular task. We believe this was a good way to assess the overall usability of the tag-based interface, especially to tease out design issues and make the interaction as intuitive as possible.
The results of this study were also influenced by the evaluation tasks. Although the tasks were meant to be generic, participants who had conducted similar transactions in real life to the ones given during the study might have been able to better relate to and be personally engaged with the tasks as opposed to others who did not. This may have influenced the tags assigned and also the perceived usefulness of the customizations offered.
Conclusion
In this study, we report on the comparative usability evaluation between a tag-based interface and a conventional interface in both online and mobile banking contexts. The results suggest that user satisfaction can be improved by adopting a tag-based interface. This is particularly true for inexperienced mobile banking users where a more significant improvement was observed. As a result, we conclude that the tag-based interface may positively affect mobile banking adoption and acceptance mainly from a usability point of view. Also, this study highlights the key issues and challenges identified relating to the use of tags for interaction and offers potential solutions to tackle them.
Future Work
In this study, we evaluated the first-time use of tags in a banking context. A longitudinal study would examine the long-term effects of the tag-based interface. Such a study, according to Vaughan and Courage (2007), can help understand the long-term usability issues, which are not usually found during users’ first encounter with a new technology.
Additionally, a study of the affective aspects of interaction (i.e., aesthetics) could help us to further understand other dimensions that affect usability. The visual representation of tags may well have influenced user’s perceived usability, which may explain the increased levels of user satisfaction observed in both online and mobile contexts.
4Global Industry Analysts,
http://www.prweb.com/releases/2010/02/prweb3553494.htm
5Jquery Tooltip, http://jquerytools.org/demos/tooltip/index.html
References
- Bangor, A., Kortum, P. T., & Miller, J. T. (2008). An empirical evaluation of the System Usability Scale. International Journal of Human-Computer Interaction, 24(6), 574-594.
- Brooke, J. (1996). SUS – A quick and dirty usability scale. In P. Jordan (Ed.), Usability evaluation in industry (pp. 189-194). London: Taylor&Francis.
- Durao, F., & Dolog, P. (2009). A personalized tag-based recommendation in social web systems. International Workshop on Adaptation and Personalization for Web 2.0. Trento, Italy.
- Fung, T. (2008). Banking with a personalized touch: Examining the impact of website customization on commitment. Electronic Commerce Research, 9(4), 296-309.
- Hassan-Montero, Y., & Herrero-Solana, V. (2006). Improving tag-clouds as visual information retrieval interfaces. International Conference on Multidisciplinary Information Sciences and Technologies. Mérida, Spain.
- Marlow, C., Naaman, M., Boyd, D., & Davis, M. (2006). HT06, tagging paper, taxonomy, Flickr, academic article, to read.
17th Conference on Hypertext and Hypermedia. Odense, Denmark: ACM. - Qi Xin, M., Uddin, M. N., & Geun-Sik, J. (2010). The wordNet based semantic relationship between tags in folksonomies. 2nd International Conference on Computer and Automation Engineering (ICCAE). Singapore.
- Rahim, M. M., & JieYing, L. (2009). An empirical assessment of customer satisfaction with Internet Banking applications: An Australian experience.
12th International Conference on Computers and Information Technology (ICCIT). Dhaka, Bangladesh. - Ravendan, R., MacColl, I., & Docherty, M. (2011a). Mobile banking customization via user-defined tags. 23rd Australian Computer-Human Interaction Conference. Canberra, Australia: ACM.
- Ravendan, R., MacColl, I., & Docherty, M. (2011b). Online banking customization via tag-based interaction. 13th IFIP TC13 International Conference Workshop on Data-Centric Interactions (DCI) on the Web. Lisbon, Portugal: CEUR-WS.
- Ravendan, R., MacColl, I., & Docherty, M. (2012). Tag-based interaction in online and mobile banking: A preliminary study of the effect on usability.
10th Asia Pacific Computer-Human Interaction (APCHI). Matsue, Japan: ACM. - Sauro, J. (2011). A practical guide to the system usability scale: Background, benchmarks & best practices.
North Charleston, South Carolina: Booksurge LLC. - Shneiderman, B., & Plaisant, C. (2004). Designing the User Interface: Strategies for Effective Human-Computer Interaction (4th ed.). Boston, MA: Pearson Addison Wesley.
- Smith, G. (2007). Tagging: People-powered metadata for the social web. Berkeley, CA: New Riders Publishing.
- Tullis, T. S., & Stetson, J. N. (2004). A comparison of questionnaires for assessing website usability.
Paper presented at the Usability Professionals’ Association Conference. Minneapolis, Minnesota. - Vaughan, M., & Courage, C. (2007). SIG: capturing longitudinal usability: What really affects user performance over time?
Proceedings of ACM SIGCHI (pp. 2149-2150). California, USA: ACM. - Wessels, L., & Drennan, J. (2010). An investigation of consumer acceptance of M-banking.
International Journal of Bank Marketing, 28(7), 547-568.
