
[:en]
Abstract
Agriculture accounts for the majority of the Ethiopian economic structure. Despite the strength and volume of agriculture related information and training available through Ethiopia’s vast public extension system, ensuring farmers receive up-to-date data and knowledge in a timely, complete, and quality manner remains a great challenge. The current practice for delivering agricultural information to farmers in Ethiopia is not adequate or efficient, especially for smallholder farmers. The information is mainly dispersed through agricultural extension officers, farmer-to-farmer visits, and mass media campaigns.
This paper presents a design and evaluation of an SMS-based agricultural information system that serves as a platform where rural farmers and extension officers can share agricultural information. Development of the system followed a Rapid Application Development (RAD) methodology. The system was evaluated for usability, accuracy, performance, and significance. The usability testing was based on the System Usability Scale (SUS) method. User queries and the corresponding responses recorded by the system were used to determine the accuracy of the system. The performance of the system was analyzed by gathering data for the amount of time it took to process the messages and send responses based on a user’s request. Based on feedback from 20 participants using the SUS, the system, with the score ranging from 0 to 100, scored 87.63. The Query Understanding Engine (QUE) accurately translated 90% of all incoming user requests. The mean average response system time was 3.34 seconds. These results show that the problem of a lack of appropriate and easily accessible agricultural information can be solved using a system like the one developed in this research.
Keywords
Agricultural information, Agricultural knowledge service, Mobile phone, SMS, SMS-based Agricultural Information System, Usability, Rural farmer
Introduction
Agriculture covers the activities of tilling, herding, and planting. The majority of Ethiopia’s workforce and economic output is agriculturally based (Gebre-Selassie & Bekele, 2012). The country has tremendous potential because of its agricultural resources like land, livestock, plants, water, and minerals. Accelerating agricultural growth in Ethiopia has potential for wide-ranging impacts beyond smallholder farmers and rural development. However, the practice of agricultural activities has remained more or less static for years, resulting in unproductive practices possibly due to a lack of use of innovative technologies in the agricultural system. As well, the sector is dominated by small-scale farmers who practice a mixed agriculture style that employs traditional technology (such as harvesting grain with sickles, using oxen or horses to thresh, and ploughing with oxen) that results in a low input and low output production system. On the other hand, the activities of the farmers are limited by the lack of current agricultural information that is necessary to improve their agricultural lives.
The lack of access to agricultural information represents a significant barrier, especially for poor smallholder farmers in rural areas. Agricultural information and knowledge services are critical for farmers’ production. However, there has been little effort put forth to provide this access to current agricultural information that can help transform farmers’ output (Ethiopian Agricultural Transformation Agency, 2014). During Ethiopia’s Growth and Transformation Plan (Phase I), the government set an Agricultural Transformation Agenda that prioritized interventions into agricultural activities with the highest potential to achieve the overall growth (Ethiopian Agricultural Transformation Agency, 2017). To achieve both the transformation plan and a positive impact for smallholder farmers, the government uses agricultural experts (extension officers) to provide agricultural information and trainings at each level of the structure.
In 2010, the government established the Ethiopian Agricultural Transformation Agency (ATA), a strategy- and delivery-oriented government agency that aimed to accelerate the growth and transformation of Ethiopia’s agriculture sector by providing access to vital agricultural advice and information to farmers (http://www.ata.gov.et/). As a new initiative by the Ethiopian agriculture system, the agency developed an interactive voice response (IVR) system to deliver information directly to farmers through mobile phones. However, there have been some issues such as a longer than anticipated interaction design phase and inefficient transaction processing services that have prevented the system to be used at its full capacity.
Despite the strength and volume of agriculture related information training available through Ethiopia’s vast public extension system, ensuring that farmers receive up-to-date data and knowledge in a timely manner remains a great challenge. Both information officers and smallholder farmers found the current system did not satisfy their information needs. With the current system, it is hard for a farmer to get notifications such as for weather alerts, climate changes, warnings, and seasonal information. Also, the farmers are not able to request information or inform authorities about environmental challenges such as flooding, pests, disease, and erosion. In one way or the other, rural farmers are suffering from the lack of agricultural information an appropriate agricultural information system can provide. This is particularly the case for the remote, rural smallholder farmers who make up the majority of the sector.
To alleviate the problem, systems that take into account the existing technological innovations are required. In this present day of information communication technology, the use of mobile phones to provide accurate and quick information to farmers is an essential tool for sustainable economic development through providing effective communication services in the areas of travel, harvesting, productivity, and understanding of market analysis (Fafchamps & Minten, 2012; Mittal & Mehar, 2012). With this technology, farmers could have the benefit of greater access to farm-related information that can have an impact by improving the capability of farmers for effective cultivation and for reduction of farm-related diseases. An agricultural information system via mobile phones can facilitate an effective knowledge service for supporting the farmers in problem-solving, decision making, and early warning.
Designing a real-time Short Message Service (SMS) based agricultural information systems is the focus of this study. SMS text messaging via mobile phones can be used to deliver shorter often time-critical messages. SMS can be a good way to provide a knowledge service, especially an automatic interchange of short messages that provide information from an automated agricultural information system. A system for the bulk distribution of these text messages can be sent to targeted farmers to notify them of important weather, proactive alerts, seasonal information, and other farm cultivation tips. Besides the agricultural knowledge service, the system can notify farmers of the possible occurrence of a plant or crop disease, pests, sudden flood, unseasonal rain, wind, drought, and other warning notifications, as well as the best time to harvest a crop. Moreover, farmers will be able to have access to a Frequently Asked Questions (FAQ) database that can allow them to request information about certain farm-related subjects.
This research project is aimed to investigate the possibility of designing and developing an SMS-based agricultural information system for rural farmers in Ethiopia. The project’s goal is to test and evaluate this type of system for usability, accuracy, performance, and significance to determine if such a system can be used as a platform where farmers and agricultural officers share agricultural information.
Related Work
Mobile-based information system applications that use SMS are getting to be the first choice for many Africans because there is poor and inadequate telecom infrastructure that does not consistently support voice and IP services (Jaiswal, 2011; Zhang et al., 2007). Unlike voice and IP services, SMS is a “best effort service” in which a message can get through even when the network is busy for hours or when there is not enough free capacity in a network. They can be applied for services that require instant messaging to the consumer such as providing market price information, health monitoring, and emergency alerts. Various applications developed in Africa have showed that SMS-based applications can serve a variety of purposes. The following have used multi-lingual SMS-based systems successfully: The Food and Agriculture Market Information System in the COMESA region (an economic organization in Africa), Regional Agriculture Trade Intelligence Network in East Africa, ESOKO (a digital solution and service) in Ghana, and MFarm (connects farmers with their buyers) in Kenya (Chemweno, 2012; Joshi & Pathak, n. d.).
Mobile phones are being used in Ethiopia to send SMS-based information through a mobile network. This technology is being used by organizations for promotion, announcements, collecting funds, and sending comments to a large user group (Ethio-Telecom Annual Report, 2017). These SMS-based systems are a “store and send” type of technology. In contrast, an Unstructured Supplementary Service Data (USSD) system allows companies (for example) to use short messages in live, open sessions between a user and a company. The USSD systems are rare except for a little effort by the Commercial Bank of Ethiopia (CBE). The CBE uses USSD to enable customers to access their bank accounts, make fund transfers, payments, and balance inquiries using short messages. The Ethiopian Agricultural Transformation Agency (ATA) uses an interactive voice response (IVR) system where farmers, using their mobile phones, call an 8028 hotline to receive agricultural information. However, the IVR system, currently used by the ATA, has been shown to have usability issues due to a variety of reasons. First, the system requires a long procedure to register the user and select a particular service from a menu of items. Second, a farmer has no option to request information. Third, it is not possible to get the service offline (had it been an SMS-based system, once it is downloaded to their mobile phone, they can read downloaded messages anytime and anywhere regardless of the availability of a network). Lastly, even though the system can provide different statistics (e.g., the number of callers), it is impossible to evaluate the usability of the system and satisfaction of the user by retrieving data from the system dashboard which are critical inputs to improve the service. This study used the 8028 hotline IVR system as an initial bench mark to design and develop the system that is discussed in this article.
Research Design
The following sections discuss the research design providing descriptions of the population who could use the proposed technology, our sampling size, the data source and collection methods, the setup and evaluation procedures, and the development tool and methodology.
In Ethiopia, there is only one mobile service provider—Ethio telecom. Ethio telecom is owned and maintained by the Ethiopian government. For this study, we worked as consultants for Ethio telecom to design and determine if an SMS-based information system can be used effectively to give farmers agricultural information.
Population
To satisfy the objective of our study, we chose to include a population that included farmers, extension officers, agricultural experts, and system experts (such as analysts and designers).
Sampling Size
We selected 20 participants (ten rural farmers, two agricultural knowledge experts, five agricultural extension officers, and three system experts) to be in this study. The selection was influenced by the knowledge and experience each participant had and their availability to take part in the study.
Data Source
To collect the data, we created SMS accounts for each participant using the Ethio telecom system. Private software companies provided training about current technology that could be used in the study. The Agricultural Bureau and Ministry of Agriculture office provided the agricultural knowledge and data.
Data Collection Methods
We collected the relevant data using interviews and SUS questionnaires. The SUS questionnaires were based on the method developed by John Brooke in 1986 (1996). The following are the steps we used in collecting data for each participant:
- The researchers trained each participant on how to use the system and the SUS.
- Each participant completed the SUS while the researcher was in the room. If the participant had a question, the researcher would clarify what was meant by the question.
- The researcher collected the SUS questionnaires from each participant and analyzed the results.
- Steps 1-3 were repeated until the last iteration of the study.
Experimental Setup and Evaluation Procedures
The development process of the prototype system involved a series of iterations. Different versions of the system were produced at each level of iteration, and each version was tested and evaluated by the participants using the SUS to determine the usability, accuracy, performance, and significance of the system. This process continued until the participants were satisfied with a prototype. Technical system experts (from Ethio telecom and from the agriculture bureau) and a software developer tested the functionality of the design in the lab. The individual SUS score was determined from each participant’s response using the method of Brooke (1996). Then, all the participants’ SUS values were averaged. Finally, the conceptual design (architecture) of the system was redesigned for each version of the prototype until the final version.
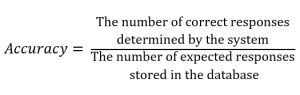
Determining the accuracy of the system was measured by how many queries were sent by the participants who correctly understood the system as determined by the Query Understanding Engine (QUE) questionnaire. We used Equation 1 to determine how many correct responses were sent to participants.
Equation 1:
To test the system performance, we measured how long it took for the system to process participant queries (inputs) and then how long it took to respond to the participant. The response time was recorded for each participant interacting with three of the system modules. Because participants interacted with a system a number of times, different time statistics were measured. Hence, the average of the maximum registered time, average of the minimum registered time, and the average of these two were computed and used as a system’s response time. After computing the mean average response time (at), we used Equations 2 and 3 to compute the minimum time (mt) and maximum time (Mt) response time.
Equations 2 and 3:
![]()
![]()
Development Tool and Methodology
The system was developed using the Rapid Application Development (RAD) methodology. We chose the RAD method because it is fast and less error prone. Because we are familiar with the GlassFish server and Java, we used them to program the tool.
System Design
The system design involved both technical and operational aspects. Figure 1 depicts an overview of the design methodology we used to guide the design and development of the system from the perspective of users, services, and the facilities needed to offer the available services.
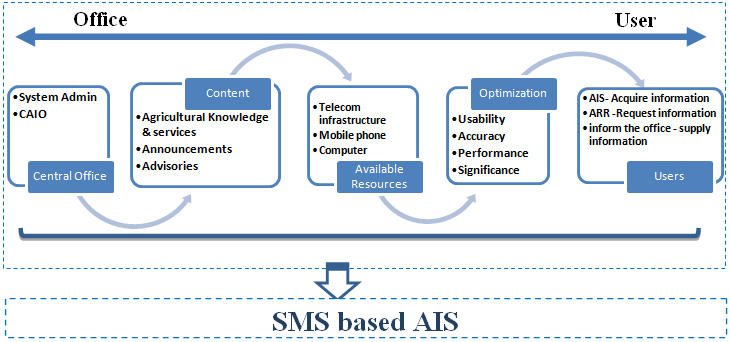
Figure 1. Overview of the system design methodology.
Conceptual Architectural Design of the System
An agricultural information system (AIS) can be constructed using a mobile platform to send and receive short agricultural messages and also to receive expert advice through an agriculture expert knowledgebase. Figure 2 depicts the proposed conceptual architecture for an SMS-based AIS.
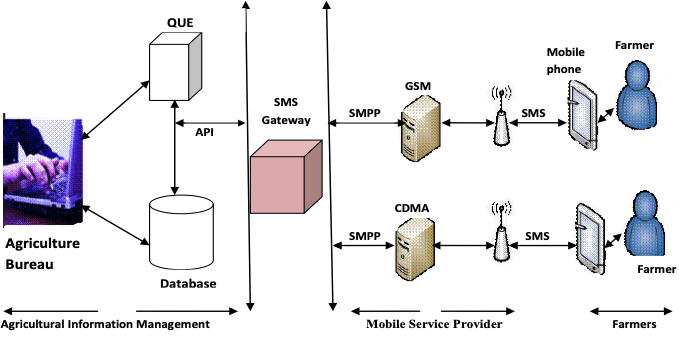
Figure 2. Architectural design for an SMS-based Agricultural Information System (AIS).
System Features
The developed system consisted of key functional modules that included a Query Understanding Engine (QUE), SMS gateway, database, and web interface. As shown in Figure 3, the system attempts to handle five major activities within this module: register users, broadcast messages to multiple users, handle system-driven AIS services (maintain and collate incoming SMS messages into a database), perform the Automatic Request Response (ARR), and inform the Chief Agricultural Information Officer (CAIO). Each version of the prototype was tested and evaluated using M-choice SMS/USSD simulator software to test the functionality of the software. The final version was temporarily hosted on the Ethio-Telecom system for practical testing and evaluation of the system’s usability, accuracy, performance (speed), and significance using standard mobiles and smartphones.
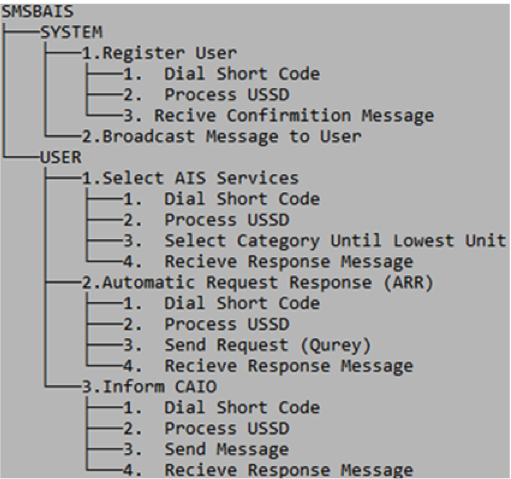
Figure 3. Functional decomposition of the SMSbAIS.
Design of the Interaction
Figure 4 shows how the relationship and flow of the key system functional modules, system functions, and actors who use these functions.
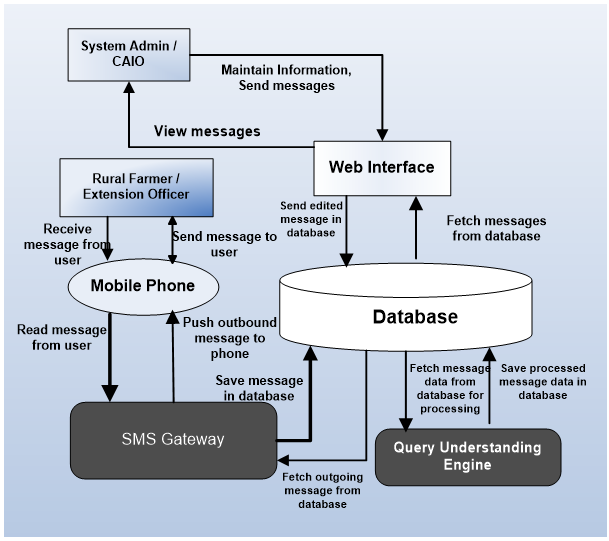
Figure 4. Actors, functions, and functional modules of the system.
Conceptual Framework
In order to address the challenges mentioned in the earlier sections, a conceptual framework was formulated to guide the design and development of SMSbAIS. Figure 5 shows a pictorial representation of the framework.
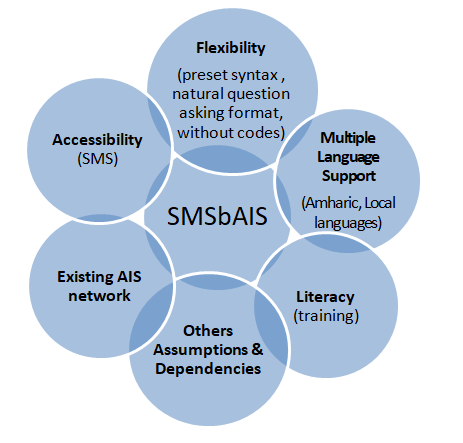
Figure 5. SMSbAIS conceptual framework.
This framework helps to ensure accessibility of important agricultural information for rural farmers in Ethiopia. The system should be tailored to local languages that the majority of the population speaks. This framework also prioritizes a more flexible syntax where users can send SMS messages using a preset syntax or a natural question format. This kind of system requires basic literacy skills—reading and writing in the target users’ own languages. It should also be noted that the framework assumed the existing AIS model designed for a rural community in Ethiopia.
The Prototype System
SMSbAIS is designed to provide both push and pull services. Push services are just broadcasting SMS messages, where messages are automatically sent based on pre-set criteria. Pull services are services given on demand/request, where users can extract information by texting the codes. Each function of the system has facilities that help a user go back to the previous option and/or automatically end the interaction using the asterisk (*) and the number/hash (#) keys, respectively. Figure 6 depicts the major services of the prototype system, which are identified as pull services. Once users register, they can access the system and get the services labeled 2, 3, and 4.
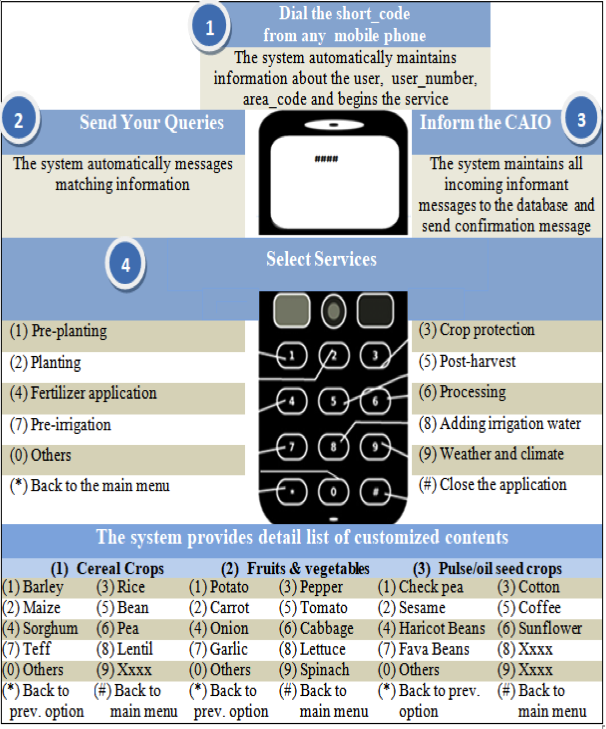
Figure 6. Overview of SMSbAIS services.
Results and Discussions
Attainment of the objectives set in this research was measured by analyzing data collected using the questionnaire and data generated from the database. The evaluation was made via testing the system based on its usability, accuracy, performance, and significance testing.
Usability Testing
The collected data were analyzed using the standard SUS method (Brooke, 1996). Use of the SUS for analyzing usability encompasses all aspects of the system that determined usability performance such as effectiveness, efficiency, user satisfaction, user perception, and overall ease of use. Figure 7 shows the average SUS score obtained during each iteration of the prototype system from a total of 20 participants involved in a total of 8 iterations. This gives a total of 200 responses in a single iteration, that is, 1,600 responses in all iterations. The average SUS score was found to be optimal (87.63) during the fifth iteration. The values showed a very slight difference after the fifth iteration because the participants did not find significant differences and reported the same level of satisfaction and ease of use during the interaction with the prototypes for the sixth through eighth iterations, which correlates by similar scores as in the fifth iteration.
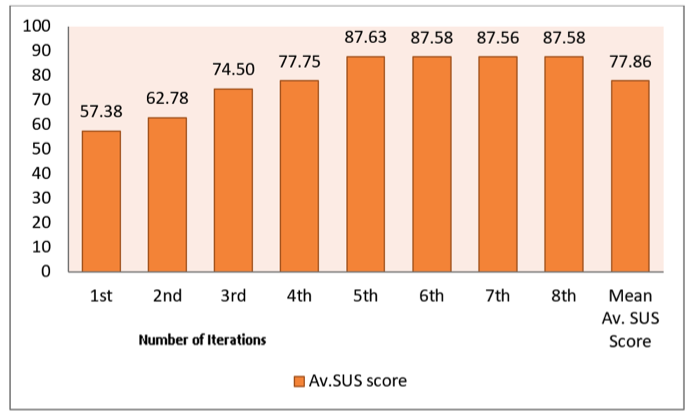
Figure 7. Average SUS score distribution for 8 consecutive iterations.
The mean average SUS score was 77.86. As shown in Figure 7, different versions of the system obtained a varying SUS score. The fifth iteration scored the highest SUS score value. In addition, this version of the prototype system gained the highest level of user satisfaction during the experiment. Because of this, the system experts and the researchers selected the fifth version as the final version of the prototype, and the remaining measurements for this experiment used this fifth iteration of the prototype. Table 1 shows the detailed SUS results for the final version.
Table 1. Detail Results of the SUS Score for the 20 Participants
|
Participant |
Q1 |
Q2 |
Q3 |
Q4 |
Q5 |
Q6 |
Q7 |
Q8 |
Q9 |
Q10 |
SUS Score |
||||
|
p1 |
5 |
1 |
5 |
1 |
5 |
1 |
3 |
1 |
4 |
1 |
92.50 |
||||
|
p2 |
4 |
1 |
5 |
2 |
5 |
1 |
4 |
1 |
3 |
2 |
85.00 |
||||
|
p3 |
5 |
1 |
4 |
1 |
4 |
1 |
5 |
1 |
5 |
3 |
90.00 |
||||
|
p4 |
5 |
2 |
5 |
1 |
5 |
2 |
5 |
2 |
4 |
1 |
90.00 |
||||
|
p5 |
5 |
1 |
5 |
1 |
5 |
1 |
4 |
2 |
5 |
2 |
92.50 |
||||
|
p6 |
4 |
1 |
5 |
1 |
4 |
1 |
5 |
1 |
4 |
2 |
90.00 |
||||
|
p7 |
5 |
3 |
4 |
1 |
3 |
2 |
4 |
1 |
5 |
2 |
80.00 |
||||
|
p8 |
5 |
1 |
5 |
1 |
5 |
1 |
5 |
2 |
5 |
1 |
97.50 |
||||
|
p9 |
5 |
1 |
5 |
2 |
4 |
2 |
4 |
1 |
4 |
1 |
87.50 |
||||
|
p10 |
4 |
2 |
5 |
1 |
5 |
2 |
5 |
1 |
5 |
2 |
90.00 |
||||
|
p11 |
5 |
1 |
5 |
2 |
5 |
3 |
5 |
1 |
4 |
1 |
90.00 |
||||
|
p12 |
4 |
2 |
4 |
1 |
3 |
1 |
4 |
1 |
3 |
2 |
77.50 |
||||
|
p13 |
5 |
1 |
5 |
2 |
5 |
2 |
4 |
1 |
4 |
1 |
90.00 |
||||
|
p14 |
4 |
1 |
4 |
1 |
4 |
1 |
4 |
2 |
5 |
2 |
85.00 |
||||
|
p15 |
5 |
2 |
4 |
2 |
5 |
1 |
5 |
1 |
4 |
1 |
90.00 |
||||
|
p16 |
4 |
1 |
5 |
1 |
4 |
2 |
4 |
2 |
5 |
3 |
82.50 |
||||
|
p17 |
5 |
2 |
4 |
1 |
3 |
1 |
5 |
1 |
4 |
1 |
87.50 |
||||
|
p18 |
5 |
1 |
5 |
2 |
4 |
2 |
4 |
1 |
3 |
1 |
85.00 |
||||
|
p19 |
4 |
2 |
5 |
1 |
5 |
1 |
3 |
1 |
4 |
1 |
87.50 |
||||
|
p20 |
5 |
1 |
5 |
2 |
3 |
2 |
5 |
1 |
3 |
2 |
82.50 |
||||
|
Avg. SUS Score |
87.63 |
||||||||||||||
As stated by Jeff Sauro (2011), the average acceptable usability is a SUS score of 68. A SUS score above a 68 would be considered above average and anything below 68 is below average. Table 2 shows the general guideline on the interpretation of SUS scores. Based on the guidelines, the usability of this system is Grade “A” with an “Excellent” rating.
Table 2. General Guideline for SUS Scores
|
SUS Score |
Grade |
Adjective Rating |
Recommendation |
|
> 78.9 |
A |
Excellent |
Users are more likely to be recommending the product to a friend. |
|
78.8–72.6 |
B |
Good |
You’re doing OK, but could improve. |
|
72.5–62.7 |
C |
Okay |
|
|
62.6–51.7 |
D |
Poor |
|
|
< 51 |
F |
Awful |
Accuracy
Analyzing for accuracy of the system in regards to the understanding of queries was done by comparing responses of the system to expected responses. For a total of 150 messages, the system accurately responded to 135 messages. The other 15 messages were not accurately understood, so a researcher needed to intervene to accurately interpret those responses.
Performance Testing
An interaction log file that involves the amount of time taken by the system (server) was generated and used to analyze the performance (speed) of the system with respect to participants’ requests. Testing involved all three of the system modules (services). Table 3 shows the time statistics (generated based on Equations 2 and 3) used by the system during interaction with participants for the given services. Hence, the average response time, in seconds, for 20 participants was 3.09 (Inform CAIO), 3.26 (AIS services), and 3.65 (ARR). The average response time for ARR services is significantly higher than the other services because the ARR undergoes further transactions and processes that require searching and matching.
Table 3. The Average Response Time for Each Functional Module
|
Test |
Inform CAIO |
AIS Services |
ARR |
||||||
|
Avg. Max Res. Time |
Avg. Min Res. Time |
Mean Avg. |
Avg. Max Res. Time |
Avg. Min Res. Time |
Mean Avg. |
Avg. Max Res. Time |
Avg. Min Res. Time |
Mean Avg. |
|
|
p1 |
3.27 |
2.64 |
2.96 |
3.11 |
2.96 |
3.04 |
4.23 |
3.06 |
3.65 |
|
p2 |
3.46 |
2.71 |
3.09 |
3.65 |
2.89 |
3.27 |
4.06 |
3.65 |
3.86 |
|
p3 |
4.23 |
3.01 |
3.62 |
3.21 |
2.69 |
2.95 |
3.97 |
3.06 |
3.52 |
|
p4 |
3.59 |
2.41 |
3.00 |
4.09 |
3.12 |
3.61 |
3.85 |
2.89 |
3.37 |
|
p5 |
3.78 |
2.35 |
3.07 |
4.23 |
3.01 |
3.62 |
4.12 |
3.25 |
3.69 |
|
p6 |
3.47 |
2.01 |
2.74 |
3.62 |
3 |
3.31 |
3.76 |
3.09 |
3.43 |
|
p7 |
4.09 |
3.21 |
3.65 |
3.99 |
2.36 |
3.18 |
4.23 |
3.69 |
3.96 |
|
p8 |
3.21 |
2.09 |
2.65 |
4.03 |
2.45 |
3.24 |
3.96 |
3.16 |
3.56 |
|
p9 |
3.98 |
2.13 |
3.06 |
3.21 |
2.17 |
2.69 |
4.02 |
3.57 |
3.80 |
|
p10 |
4.06 |
3.34 |
3.70 |
3.69 |
2.36 |
3.03 |
4.96 |
3.89 |
4.43 |
|
p11 |
3.07 |
2.46 |
2.77 |
3.98 |
2.26 |
3.12 |
4.75 |
3.21 |
3.98 |
|
p12 |
3.56 |
2.94 |
3.25 |
3.96 |
2.65 |
3.31 |
3.65 |
2.79 |
3.22 |
|
p13 |
3.49 |
2.67 |
3.08 |
4.03 |
3.01 |
3.52 |
3.76 |
2.86 |
3.31 |
|
p14 |
3.67 |
2.46 |
3.07 |
3.67 |
2.99 |
3.33 |
3.94 |
3.01 |
3.48 |
|
p15 |
4.03 |
2.79 |
3.41 |
3.94 |
2.98 |
3.46 |
3.12 |
2.56 |
2.84 |
|
p16 |
3.26 |
2.54 |
2.90 |
3.91 |
3.21 |
3.56 |
3.73 |
2.79 |
3.26 |
|
p17 |
3.04 |
2.06 |
2.55 |
3.64 |
3.01 |
3.33 |
4.67 |
3.67 |
4.17 |
|
p18 |
3.40 |
2.41 |
2.91 |
4.79 |
2.09 |
3.44 |
4.79 |
3.29 |
4.04 |
|
p19 |
3.58 |
2.34 |
2.96 |
4.35 |
2.04 |
3.20 |
3.65 |
2.79 |
3.22 |
|
p20 |
3.73 |
3.01 |
3.37 |
3.86 |
2.17 |
3.02 |
4.89 |
3.77 |
4.33 |
|
Avg. |
3.60 |
2.56 |
3.09 |
3.85 |
2.67 |
3.26 |
4.11 |
3.20 |
3.65 |
As shown in Table 3, each test contains the average maximum or minimum response time for each system service from which the mean average response time (more representative time) is calculated. These values are collected from a minimum of 15 transactions of the first 20 participants in the database for a period of three weeks. Figure 8 shows the distribution of mean average response time for each system service. It also verified that the ARR service takes more time to respond to user requests for the previously explained reason. The mean average response time value is taken as the performance (speed) of the system, which is calculated from the final mean average response time value of the three services (3.09, 3.26, and 3.65, respectively). Therefore, the results were promising at 3.34 seconds. With further optimization, the system could perform even better.
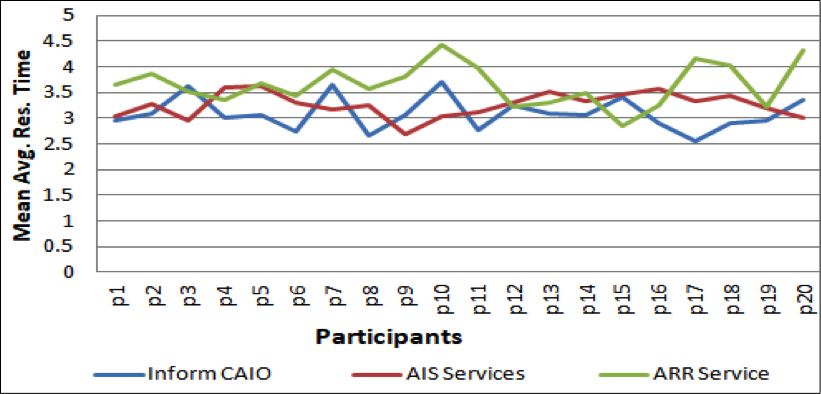
Figure 8. Mean average response time distribution of system services for 20 participants.
Significance Testing Using T-Tests
T-tests are used to compare two small sets of quantitative data when samples are collected independently of one another. We used a t-test for testing the significance of the difference between the SUS score means between two independent iterations. Paired two samples for means was used because each iteration of the system was tested for the same group of people (the 20 participants) with which the researchers were working with for testing and evaluation besides completing the SUS questionnaires. The results of the significance testing using a t-test is presented in Table 5 which was computed from raw SUS score data shown in Table 4.
Table 4. Raw SUS Score Data for Each Iteration
|
Observation |
Iteration1 |
Iteration2 |
Iteration3 |
Iteration4 |
Iteration5 |
Iteration6 |
Iteration7 |
Iteration8 |
|
p1 |
50.00 |
57.50 |
85.00 |
85.00 |
92.50 |
84.50 |
84.00 |
84.50 |
|
p2 |
55.00 |
60.00 |
85.00 |
85.00 |
85.00 |
94.50 |
94.50 |
94.50 |
|
p3 |
57.50 |
52.50 |
77.50 |
85.00 |
90.00 |
92.50 |
92.50 |
92.50 |
|
p4 |
55.00 |
60.00 |
72.50 |
75.00 |
90.00 |
87.50 |
87.50 |
87.50 |
|
p5 |
62.50 |
65.00 |
75.00 |
77.50 |
92.50 |
85.00 |
85.00 |
85.00 |
|
p6 |
57.50 |
72.50 |
80.00 |
80.00 |
90.00 |
92.50 |
92.50 |
92.50 |
|
p7 |
57.50 |
62.50 |
82.50 |
85.00 |
80.00 |
92.50 |
92.50 |
92.50 |
|
p8 |
65.00 |
72.50 |
80.00 |
82.50 |
97.50 |
87.50 |
87.50 |
87.50 |
|
p9 |
50.00 |
60.00 |
75.00 |
77.50 |
87.50 |
90.00 |
90.00 |
90.00 |
|
p10 |
65.00 |
70.00 |
75.00 |
77.50 |
90.00 |
85.00 |
85.00 |
85.00 |
|
p11 |
50.00 |
57.50 |
75.00 |
82.50 |
90.00 |
87.50 |
87.50 |
87.50 |
|
p12 |
57.50 |
72.50 |
80.00 |
82.50 |
77.50 |
85.00 |
85.00 |
85.00 |
|
p13 |
50.00 |
62.50 |
77.50 |
77.50 |
90.00 |
82.50 |
82.50 |
82.50 |
|
p14 |
65.00 |
65.00 |
65.00 |
70.00 |
85.00 |
92.50 |
92.50 |
92.50 |
|
p15 |
60.00 |
60.00 |
70.00 |
77.50 |
90.00 |
90.00 |
90.60 |
90.00 |
|
p16 |
45.00 |
50.00 |
62.50 |
67.50 |
82.50 |
82.50 |
82.00 |
82.50 |
|
p17 |
60.00 |
62.50 |
70.00 |
70.00 |
87.50 |
90.00 |
90.00 |
90.00 |
|
p18 |
60.00 |
60.00 |
65.00 |
70.00 |
85.00 |
82.50 |
82.50 |
82.50 |
|
p19 |
70.00 |
75.50 |
72.50 |
77.50 |
87.50 |
85.00 |
85.00 |
85.00 |
|
p20 |
55.00 |
57.50 |
65.00 |
70.00 |
82.50 |
82.50 |
82.50 |
82.50 |
|
Average SUS |
57.38 |
62.78 |
74.50 |
77.75 |
87.63 |
87.58 |
87.56 |
87.58 |
Table 5. Detail Results for T-Test: Paired Two Sample for Means at Pα = 0.05
|
|
Iteration 1 |
Iteration 2 |
Iteration 3 |
Iteration 4 |
Iteration 5 |
Iteration 6 |
Iteration 7 |
Iteration 8 |
|
Mean |
57.38 |
62.78 |
74.50 |
77.75 |
87.63 |
87.58 |
87.56 |
87.58 |
|
Variance |
40.44408 |
47.30197 |
45.13158 |
33.48684 |
22.02303 |
15.87566 |
16.50261 |
15.87566 |
|
Observations |
20 |
20 |
20 |
20 |
20 |
20 |
20 |
20 |
|
Hypothesized Mean Difference |
0 |
0 |
0 |
0 |
0 |
0 |
0 |
|
|
df |
19 |
19 |
19 |
19 |
19 |
19 |
19 |
|
|
t Stat |
-4.75153 |
-6.4244 |
-5.63845 |
-6.72878 |
0.036567 |
0.422379 |
-0.42238 |
|
|
P(T<=t) two-tail |
0.000139 |
3.69E-06 |
1.95E-05 |
1.98E-06 |
0.971211 |
0.67749 |
0.67749 |
|
|
t Critical two-tail |
2.093024 |
2.093024 |
2.093024 |
2.093024 |
2.093024 |
2.093024 |
2.093024 |
|
When we ran a t-test based on the standard P-value (Pα = 0.05), we were looking for three things: alpha levels, t-scores, and mean difference. The results of the t-test statistics shown in Table 5 were compared and analyzed based on the following steps:
- Compare the alpha level (i.e., 0.05) to the p-value in the output. If the p-value in the output is smaller than the alpha level, reject the null hypothesis.
- Compare the t-critical, two-tail value in the output with the t-value. If the t-value is larger than the t-critical value, reject the null hypothesis.
- Compare the difference between the means of the two consecutive iterations (groups). If the mean of the two groups are far apart (greater), we can be fairly confident that there is a real difference between them and reject the null hypothesis.
- In order to fully reject the null hypothesis, we used both values (p, t, and mean difference) in combination.
Applying the above steps resulted in the statistics shown in Table 6. The results show that there exists a statistically significant difference between consecutive system iteration in the first four iterations. Based on our observed result, consecutive iteration between the fifth, sixth, seventh, and eight iterations proved consistent with the hypothesis. In addition to this, the observed difference between the sample means (between these consecutive iterations) was not convincing enough to say that the average SUS score values differ significantly.
Table 6. Analysis for P Value, T-Stat, and Mean Difference Based on the Principle
|
|
Iteration 1 |
Iteration 2 |
Iteration 3 |
Iteration 4 |
Iteration 5 |
Iteration 6 |
Iteration 7 |
Iteration 8 |
|
Mean |
57.38 |
62.78 |
74.50 |
77.75 |
87.63 |
87.58 |
87.56 |
87.58 |
|
t Stat |
-4.75153 |
-6.4244 |
-5.63845 |
-6.72878 |
0.036567 |
0.422379 |
-0.42238 |
|
|
P(T<=t) two-tail |
0.000139 |
3.69E-06 |
1.95E-05 |
1.98E-06 |
0.971211 |
0.67749 |
0.67749 |
|
|
t Critical two-tail |
2.093024 |
2.093024 |
2.093024 |
2.093024 |
2.093024 |
2.093024 |
2.093024 |
|
|
P(T<=t) two-tail <Pα |
Reject |
Reject |
Reject |
Reject |
Accept |
Accept |
Accept |
|
|
t-stat>t Critical two-tail OR |
Reject |
Reject |
Reject |
Reject |
Accept |
Accept |
Accept |
|
|
Mean difference |
-5.4 |
-11.725 |
-3.25 |
-9.875 |
0.05 |
0.02 |
-0.02 |
|
Conclusion and Recommendation
A mobile SMS system is a potential solution to get accurate information to flow faster and correctly to an intended audience with minimal cost and effort. The SMS-based agricultural information system developed during the course of this research addressed specific challenges faced by rural farmers and showed that it is possible to meet the research objectives. The results of this research show that the problem of a lack of appropriate and easily accessible agricultural information can be solved using a system like the one developed in this research by following a framework that targets solutions to challenges faced in accessing agricultural information in a rural community. As the primary researchers on this project, we highly recommend future research in areas of inclusion of additional languages and enhancement of query understanding engine and learning. For future research, acceptance testing and accepting user replies (inputs) using a natural language (i.e., common speech) would be a beneficial addition to this type of solution.
Tips for Usability Practitioners
The following tips can be useful for practitioners running similar research projects:
- In testing the usability of systems that produces more than two versions, it is wise to use a combination of the SUS method and t-test or analysis of variance (ANOVA) methods.
- Database records and system statistics can be good options to objectively evaluate system performance and find ways for further optimization.
Acknowledgements
The authors would like to thank all those people who took their time to take part in the experiments. We also thank the anonymous reviewers for their constructive comments.
References
Brooke, J. (1996). SUS: A ‘quick and dirty’ usability scale. In P. Jordan, B. Thomas, & B. Weerdmeester (Eds.), Usability Evaluation in Industry (pp. 189–194). London, UK: Taylor & Francis.
Chemweno, K. (2012). SMS based rural agricultural markets monitoring information system in Kenya (Master’s thesis in Computer Science, University of Nairobi). Available at http://erepository.uonbi.ac.ke/bitstream/handle/11295/13048/Chemweno_SMS%20based%20rural%20agricultural%20markets%20monitoring%20information%20system%20in%20Kenya.pdf?sequence=3&isAllowed=y
Ethio-Telecom Annual Report (2017).Retrieved January, 2018, at https://www.budde.com.au/Research/Ethiopia-Telecoms-Mobile-and-Broadband-Statistics-and-Analyses.
Ethiopian Agricultural Transformation Agency (2014). ATA Annual Report 2013/14: Transforming Agriculture in Ethiopia. Retrieved from Available at http://www.ata.gov.et/download/annual-report-transforming-agriculture-in-ethiopia/
Ethiopian Agricultural Transformation Agency (2017). ATA Annual Report 2016/17: Agricultural Transformation Agenda. Available at http://www.ata.gov.et/download/annual-report-201617/
Fafchamps, M., & Minten, B. (2012). Impact of SMS-based agricultural information on Indian farmers. The World Bank Economic Review, 26(3), 383–414. https://doi.org/10.1093/wber/lhr056
Gebre-Selassie, A., & Bekele, T. (2012). A review of Ethiopian agriculture: Roles, policy and small-scale farming systems. In Global growing casebook: Insights into African Agriculture (pp. 36–65). Available at http://global-growing.org/sites/default/files/GG_Casebook.pdf
Jaiswal, P. K. (2011). SMS Based Information Systems (Master’s thesis, University of Eastern Finland). Available at http://cs.uef.fi/sipu/2011_MSc_Jaiswal_Pankaj.pdf
Joshi, M. R., & Pathak, V. M. (n. d.). A survey of SMS based information systems. School of Computer Science, North Maharashtra University, Jalgaon, MS, India. Available at https://arxiv.org/ftp/arxiv/papers/1505/1505.06537.pdf
Mittal, S., & Mehar, M. (2012). How mobile phones contribute to growth of small farmers? Evidence from India. Quarterly Journal of International Agriculture, 51(3), 227–244. doi: http://dx.doi.org/10.22004/ag.econ.155478
Sauro, J. (2011). Measuring usability with the System Usability Scale (SUS). Retrieved from https://measuringu.com/sus/
Zhang, G., Gao, W., Wang, X., Jiang, X., Ping, Y., & Yang, H. (2007). Study and design of an agricultural SMS system based on a GSM modem. New Zealand Journal of Agricultural Research, 50(5), 1089-1092. doi: 10.1080/00288230709510390
[:]