
Introduction
Across the planet, human-driven climate change is having a great and increasing impact. Some areas will experience more intense hurricanes, while others will experience other effects, including increased droughts and severe wildfires. Hurricanes, in particular, are increasing in impact and rapidly intensifying, causing greater damage. Just last year, Hurricane Ian brought strong winds, heavy rainfall, and coastal storm surges to Cuba, Florida, North Carolina, and South Carolina. The hurricane’s incessant winds, rainfall, and storm surges resulted in $112.9 billion in damage and over 150 deaths (NHC, 2023). In the aftermath, there were numerous reports in the press about how problems in communicating hindered the public’s response. Improving warning design to help the public make informed decisions about how to protect themselves during extreme weather is complex but increasingly necessary to save lives.
I am part of an interdisciplinary team made up of researchers from a range of fields including UX, weather prediction, environmental anthropology, data visualization, and community psychology. We investigate the influence of design choices in graphical products on non-expert comprehension. Our mission is to transform weather forecast information into a format that improves public understanding and decision-making. In this article, I discuss the complexities in designing hurricane forecast products as revealed through my team’s user-centered design journey.
Problems in Forecasting
Improved forecast models have provided a more accurate understanding of the risks posed by impending hurricanes, but adequately communicating those risks in an actionable way to the public is a complex undertaking. Current forecast products were designed for expert users—forecasters, risk managers, and other decision-makers—but are widely consumed by the public (NHC, n.d.). This has led to many types of misinterpretation that have been well-documented in academic literature (Bostrom et al., 2018; Broad et al., 2007; Millet et al., 2020; Ruginski et al., 2016). Furthermore, existing hurricane forecast products do not contain recommendations for preparatory actions as suggested in warning design guidelines.
People’s individual context also influences their comprehension of the warning products and how they prepare for, respond to, and recover from hurricane hazards. Previous efforts to address design issues in hurricane forecast products have been focused primarily on improving visualization of the uncertainty surrounding the hurricane path. However, these attempts do not address the potential mismatch between the type of information that the forecast products provide and the information that the public needs to make decisions.
Forecast Products
When hurricanes threaten, people access information about them from different sources (Broad et al., 2007; Dash & Gladwin, 2007; Evans et al., 2022; Huang et al., 2012). They rely on television, radio, websites, mobile apps, and informal social networks to evaluate risk and make decisions. The hurricane risks are communicated through various forms, both visual and non-visual. Frequently, media show the “Cone of Uncertainty” (COU), a product created by the National Hurricane Center (NHC), officially named the “Tropical Cyclone Track and Watch/Warning Graphic” (Figure 1). The COU contains many types of information, including the projected track line and its uncertainty, watches and warnings, and a legend that includes hurricane classifications. According to prior work, the COU is often misinterpreted, and the combination of information and the graphic features employed contribute to visual clutter and information overload. The focus of the graphic is to provide a forecast for the center of the storm together with its uncertainty, but this information may not be as relevant to the public as the size of the storm, the wind and rain distribution, or the storm surge, most of which are not presented in the graphic.
To address non-experts’ understanding of hurricane risks, weather organizations have expanded their repertoire of forecast products to include information that is more relevant to hurricane hazards. For example, the U.S. National Weather Service (NWS) developed the Hurricane Threats and Impacts (HTI) graphics in response to the need for more hazard-specific forecast Information.
The HTI graphic uses color-coded probability data to depict potential threatening conditions, accompanied with descriptions of the likely impacts (NWS, n.d.). The HTI graphics describe four different hazards: wind, storm surge, flooding rain, and tornadoes that arise from hurricanes making landfall (Figure 2). While the HTI graphics have been operational since 2015, they are not as widely used by the public as the graphics available from the NHC.
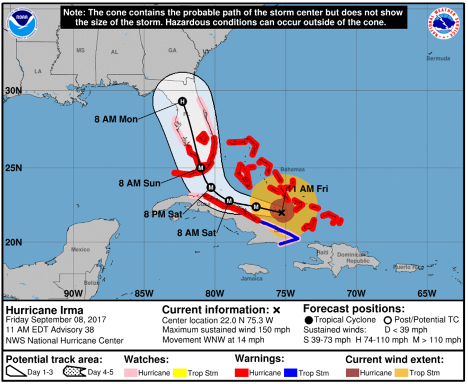
Figure 1. NHC Cone of Uncertainty (COU) product for Hurricane Irma. (Credit: National Hurricane Center)
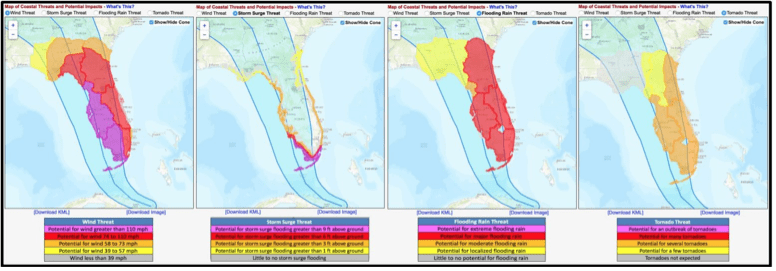
Figure 2. HTI graphics for Hurricane Irma. (Credit: Brian McNoldy)
Our Research Approach
Product redesign offers an opportunity to improve the communication effectiveness of hurricane forecast products. In our work, we have employed a user-centered design process (Figure 3) that integrates feedback from stakeholders and the public and uses visualization design principles to guide the development of redesign prototypes. Our generative research has included focus groups, surveys, participatory design, and experiments to provide a front-end analysis of users’ needs and preferences for effective risk communication. This approach has helped us address our goal of understanding how a key user group—members of the public—use hurricane forecast graphics and the context in which they are used. Our efforts have been stepwise, focusing on one or a few warning design characteristics at a time. The information gained from these methods served as input for visualization design, which we then tested iteratively to determine if the redesigns were usable, understandable, and elicited the necessary behavioral intent.

Figure 3. Process for our activities. (Credit: Alberto Cairo)
Lessons Learned
Drawing from prior work and our research, we have gained the following insights: 1) People are not getting the information they need. 2) People are not understanding or even recognizing uncertainty as a key parameter of the visualization. 3) UX issues are easy to spot but difficult to fix in a way that solves the problem. 4) Better graphical design may improve understanding but may not necessarily change people’s behaviors.
Satisfying User Needs
Existing forecast products do not provide users with the information they need for adequate guidance. People are interested in receiving clear information about the hazards and recommended necessary protective actions so that they can make informed decisions. People want locally tailored forecasts that reflect how the hurricane will impact them directly and what steps they need to take to prepare. Satisfying these information needs may require a movement toward more personalized hurricane risk information systems that take into account cognitive, cultural, geographical, linguistic, and economic circumstances.
Communicating Forecast Uncertainty
Weather forecasts, by definition, represent uncertainty. The COU, for example, provides the track forecast of the center of the hurricane together with an estimate of track forecast uncertainty. The graphic is a valued and valuable visualization, appropriate for emergency managers, meteorologists, and other experts, but it is also widely shown to, shared with, and accessed by the public. The graphic, however, is not one size fits all. It is well-known that the public often has difficulty interpreting the graphics and, in particular, the uncertainty surrounding the forecast path. For example, some people feel safer in locations just outside of the cone limits. Some people believe that there is no risk at all beyond the cone. However, there is a one-third chance that the center of the storm will not be within the cone at all. Some people also believe that areas along the central black line are in greater danger, but the size of the storm extends beyond the track line. Another misinterpretation is that the shape of the cone communicates information about the size or intensity of the storm, whereas the widening shape of the cone only communicates that there is greater uncertainty as the forecast moves further into the future. Research and design efforts are still needed to determine effective uncertainty visualization approaches for hurricane forecasts.
Addressing UX Issues
In our earlier efforts to make the COU easier for the public to understand, we focused on what we believed were obvious UX faux pas with easy fixes: changing cone style (bounded versus fuzzy border), employing a sequential color palette, expanding instructions, including contextual legends, and deconstructing the graphic (see Millet et al., 2022). We eliminated the cone’s hard boundary because of its link to common misinterpretations. We added the section, “How to Read the Cone,” for a textual explanation above the map. We changed the colors for watches and warnings to a sequential color palette ranging from light yellow to red to align with representations of tiered variables. We included contextual explanations of map abbreviations to provide situationally relevant information. We also included separate maps for watches, warnings, and the Cone of Uncertainty to minimize visual clutter. We found, however, that these design modifications appeared to have limited influence on user comprehension of the forecast. We found that participants’ comprehension of hurricane forecast information depended less on visualization design and more on numeracy, graphicacy, and hurricane characteristics that influence cone shape, such as translational speed and changes in the hurricane’s heading. We have determined that the users’ interpretive difficulties are inherent to the display type and even the information offered.
Understanding Behaviors
Many social and behavioral factors affect how people prepare for, respond to, and are impacted by hurricane hazards. Even if we develop hurricane forecast products that most people understand, their prior experience with hurricanes, their ability to take the recommended protective actions, and numerous other factors may impede an individual’s response to a hurricane event. How designers can consider this when developing hurricane forecast products remains largely unexplored, although each subsequent hurricane reinforces the need for such inquiry.
Communicating hurricane risk to the public effectively is a complex process that requires an interdisciplinary understanding of the cognitive, cultural, and visual aspects of risk comprehension. Although there has been significant research conducted into how the public understands and acts upon hurricane risk, there remain significant gaps and inconsistencies that need to be addressed in future research. For example, my colleague, located in a flood zone and urged to leave, refused to evacuate because her mother was in a local hospice. Others evacuate at the slightest provocation, without considering official recommendations. There is a large subset of the population that will not leave their pets behind, some who worry about leaving their homes unattended, and others who will not go to a shelter for refuge from the hurricane. Therefore, we recommend that research on how the public understands and acts upon hurricane risk should be both theoretically and methodologically pluralistic, and communication strategies based on such research should be constantly tested for ecological validity in real-world situations.
Next Steps
It is expected that hurricanes will become more intense as the climate warms (National Academies, 2018). With more intense hurricanes and more people moving to coastal areas, more effective communication will be needed so that people are in a better position to make decisions based on the levels of risk they face.The public needs concrete, actionable information emphasizing uncertainty, presenting hazard-specific information, and offering personalized guidance. The knowledge gained from prior work and our research activities inform the design of future hurricane forecast products. But more research is needed to solve these complex problems. Improving warning design to help at-risk communities understand, prepare for, and respond to the risks of hazardous hurricane events is a critical endeavor in which UX can make important contributions.
References
Bostrom, A., Morss, R., Lazo, J. K., Demuth, J., & Lazrus, H. (2018). Eyeing the storm: How residents of coastal Florida see hurricane forecasts and warnings. International Journal of Disaster Risk Reduction, 30, 105-119. doi.org/10.1016/j.ijdrr.2018.02.027
Broad, K., Leiserowitz, A., Weinkle, J., & Steketee, M. (2007). Misinterpretations of the “Cone of Uncertainty” in Florida during the 2004 hurricane season. Bulletin of the American Meteorological Society, 88(5), 651-668. doi:10.1175/BAMS-88-5-651
Dash, N., & Gladwin, H. (2007). Evacuation decision making and behavioral responses: Individual and household. Natural Hazards Review, 8(3), 69-77. doi.org/10.1061/(ASCE)1527-6988(2007)8:3(69)
Evans, S. D., Broad, K., Cairo, A., Majumdar, S. J., McNoldy, B. D., Millet, B., & Rauk, L. (2022). An interdisciplinary approach to evaluate public comprehension of the “Cone of Uncertainty” graphic. Bulletin of the American Meteorological Society.
Huang, S. K., Lindell, M. K., Prater, C. S., Wu, H. C., & Siebeneck, L. K. (2012). Household evacuation decision making in response to Hurricane Ike. Natural Hazards Review, 13(4), 283-296. http://dx.doi.org/10.1061/(ASCE)NH.1527-6996.0000074
Millet, B., Carter, A. P., Broad, K., Cairo, A., Evans, S. D., & Majumdar, S. J. (2020). Hurricane risk communication: Visualization and behavioral science concepts. Weather, Climate, and Society, 12(2), 193-211. doi.org/10.1175/WCAS-D-19-0011.1
Millet, B., Majumdar, S. J., Cairo, A., McNoldy, B. D., Evans, S. D., & Broad, K. (2022). Exploring the impact of visualization design on non-expert interpretation of hurricane forecast path. International Journal of Human–Computer Interaction, 1-16. https://doi.org/10.1080/10447318.2022.2121036
National Academies of Sciences, Engineering, and Medicine. (2018). Integrating social and behavioral sciences within the weather enterprise. National Academies Press. https://nap.nationalacademies.org/catalog/24865/integrating-social-and-behavioral-sciences-within-the-weather-enterpriseh
National Hurricane Center (n.d.). Definition of the NHC Track Forecast Cone. https://www.nhc.noaa.gov/aboutcone.shtml#:~:text=Definition%3A,%2C%2036%20hours%2C%20etc)
National Hurricane Center (2017). Irma graphics archive: 3-day forecast track, initial wind field and watch/warning graphic. https://www.nhc.noaa.gov/archive/2017/IRMA_graphics.php?product=3day_cone_with_line_and_wind
National Hurricane Center (2023, April 3). National Hurricane Center tropical cyclone report: Hurricane Ian. https://www.nhc.noaa.gov/data/tcr/AL092022_Ian.pdf
National Weather Service. (n.d.). Hurricane threats and impacts graphics FAQ. https://www.weather.gov/media/srh/tropical/HTI_Explanation.pdf
McNoldy, B. [@BMcNoldy]. (2018, October 8). They do seem to be under-used… these graphics have been available for every landfalling storm since June 2015 when NOAA [Image attached] [Tweet]. Twitter. ttps://twitter.com/bmcnoldy/status/
1049376440423276549?s=42&t=SkgzF0vGAFPZ1f9ePNDTBw
Ruginski, I. T., Boone, A. P., Padilla, L. M., Liu, L., Heydari, N., Kramer, H. S., Hegarty, M., Thompson, W. B., House, D. H., & Creem-Regehr, S. H. (2016). Non-expert interpretations of hurricane forecast uncertainty visualizations. Spatial Cognition & Computation, 16(2), 154-172.