
Abstract
Approximately 17 million workplace violence (WPV) events occur each year in healthcare settings in the United States. However, the majority of these events go undocumented. This study introduces a novel solution to this pervasive challenge by accommodating the socio-technical barriers that hinder WPV reporting among healthcare workers. As a minimum viable product, the Safety Pulse Aggregate Reporting System (SPARS) is meticulously designed to allow HCPs to quickly report the frequency of WPV events with minimal disruption to their demanding work environments.
Participants completed tasks based on real-world scenarios. Testing assessed perceived usability using the Post-Study System Usability Questionnaire (PSSUQ); the cognitive workload was assessed using the National Aeronautics and Space Administration Task Load Index (NASA-TLX). We measured performance as the time taken to complete a task in seconds.
Findings reveal a significant reduction in reporting time alongside usability and workload scores that indicate a potential for high adoption and usability. By offering a validated, user-friendly alternative for WPV event quantification, SPARS tackles the daunting issue of underreporting and serves as a supplementary tool for workplace safety programs. These insights lay the groundwork for future research in WPV reporting, which is particularly relevant for UX practitioners navigating complex conditions. Given the alarming rates of burnout and moral distress among healthcare professionals, the implications of this study are both significant and timely.
Keywords
Workplace violence, user-centered design, reporting, human-centered design, cognitive ergonomics, minimum viable product
Introduction
Between 2011 and 2020, at least 80 healthcare professionals (HCPs) died as a result of workplace violence (WPV) (U.S. Bureau of Labor Statistics, 2024). HCPs, the backbone of the healthcare system, face a daunting reality that eight out of 10 professionals will experience workplace violence each year (Öztaş et al., 2023; Sato et al., 2013). Anecdotal reports for some WPV suggested that violence occurred nearly every visit to certain patients’ rooms. HCPs were five to 12 times more likely to experience nonfatal WPV events compared to workers in other industries; HCPs’ exposure to WPV not only jeopardized patient safety, but it also contributed to alarming rates of burnout, post-traumatic stress disorder, other mental health complications, and increased intention for HCPs to leave their jobs (Arnetz et al., 2015; Havaei, 2021; Kratzke et al., 2022; May & Wisco, 2016). However, although most HCPs acknowledged the high prevalence of WPV, a lack of robust data hindered healthcare leaders’ ability to fully quantify the scope of the problem.
A minimum of 17 million WPV events were estimated to occur this year in healthcare settings, and less than 12% of the events will be reported (Bureau of Labor Statistics, 2024; Foster et al., 2022; Öztaş et al., 2023; Sato et al., 2013). Findings from previous work assessing the usability of an institutional WPV reporting system identified that the average time taken to complete a WPV report was 6.30 min (Foster et al., 2022). However, given the high rates of understaffing and the fast-paced nature of hospital settings, HCPs were tasked with constantly optimizing their impact under strenuous time constraints, leaving little time for voluntary tasks such as WPV reporting. Research denoted various barriers to WPV reporting such as complex reporting procedures, concerns about confidentiality, fear of retaliation, feelings of uselessness, lack of understanding regarding what circumstances constituted a WPV event, and the normalized exposure to aggressive or inappropriate behavior (Arnetz et al., 2015; Foster et al., 2022; Hedayati Emam et al., 2018; Sato et al., 2013).
To address this problem, this study proposed a minimum viable product for a novel WPV reporting application, the Safety Pulse Aggregate Reporting System (SPARS).
SPARS is a highly simplified mobile-friendly reporting application designed to further enable HCPs to contribute to a safer work environment with minimal disruption to the demands of their job and with less compromise to their personal comfort levels. SPARS allows HCPs to anonymously report the total number of WPV events they experienced or witnessed since their last report, as opposed to entering detailed accounts of each event. Although reporting the details of specific WPV events remains crucial to informing action on individual cases, we believe SPARS is distinctly designed to support initial or intermittent workplace safety strategies by providing more accurate estimations of WPV in a given work environment. SPARS’ design offers HCPs user-friendly features that encourage engagement among HCPs who may have been discouraged by the complexities of traditional reporting systems or who may not feel comfortable providing detailed reports. Therefore, this study aimed to assess the user-informed design of SPARS, a mobile-friendly aggregate reporting tool for HCPs to report WPV events in hospital settings.
Methods
We recruited HCPs using emails and flyers placed on staff bulletin boards (with the approval of the administration). Participants were eligible for the study if they were employees of the hospital system. HCPs who consented to participate underwent a 30-min virtual session in which they completed WPV-related tasks based on real-world scenarios. Prior to testing, we administered a pre-screener questionnaire to collect information regarding clinical roles and previous experience with WPV reporting.
We assessed cognitive workload using the National Aeronautics and Space Administration Task Load Index (NASA-TLX) (Hart, 2006), and we assessed perceived usability using the Post-Study System Usability Questionnaire (PSSUQ) (Lewis, 2002). Research by Lewis (2019) suggested that PSSUQ scores can be indicative of the SUS scores, which are widely used for a global assessment of system usability. Although we did not directly employ the SUS in our study, this correlation allowed us to infer the potential usability rating of our tool on the SUS scale. In applying the Sauro-Lewis Curved Grading Scale inferentially to our PSSUQ scores, we provided an estimated usability grade based on the well-established benchmarks of SUS scores (Lewis, 2019). We captured responses to the pre-screener questionnaire and usability assessment tools using QualtricsTM.
We measured performance by time-to-task completion in seconds. Following testing, participants answered explorative and probing open-ended questions so we could gather additional feedback on the design. Qualitative data informed the improvements in the reporting tool design as agreed upon among the research team.
We used one-tailed t-tests to test the mean scores of the PSSUQ (and its subscales) and NASA-TLX for statistical significance against published benchmarks (Hart, 2006; Lewis, 2019; Mazur et al., 2013). To control for multiple t-tests, we used the Benjamini-Hochberg procedure.
Ethical approval was obtained from the UNC-Chapel Hill Institutional Review Board (IRB Number: 21-3269).
Design
SPARS was developed in Qualtrics. The primary design objective of SPARS aimed to significantly improve the quantification of WPV events with respect to the distinct needs of HCPs. By way of this objective, SPARS included the following combination of key design features for the minimum viable product:
- Anonymity: To ensure the privacy and comfort of its users, SPARS eliminates the need for login credentials. This approach allows HCPs to submit reports without sharing personally identifiable information.
- Direct Access: To improve accessibility, SPARS can be accessed with a single click, bypassing common obstacles like login requirements and firewalls, which ensures HCPs can report incidents quickly and effortlessly.
- Minimalist Questions: The SPARS reporting form is limited to two questions that capture the quantity of WPV events experienced or witnessed (Figure 1). This feature acknowledges the inherent bystanders of WPV as important voices in the effort to mitigate WPV. The questions include these:
- Since your last report, how many times have you experienced the following situations/events?
- Since your last report, how many times have you witnessed the following situations/events?
- Aggregate Reporting: SPARS employs an aggregate reporting format using categorical option values. HCPs report the frequency of WPV incidents (such as “1 to 2 times” and “3 to 5 times”) instead of detailing each individual event. The choice of categorical options over precise numeric entries is grounded in initial feedback from HCPs, who expressed concerns that recalling and reporting exact numbers can be challenging. They feared that potential inaccuracies might deter them from reporting altogether.
- Definitions and Terms of Use: The tool includes clear definitions for each type of reportable WPV event. Additionally, language is incorporated to explain how the data is used to demonstrate transparency and address known data privacy concerns. For example, we included the following language to describe how the data is used and what HCPs can expect after reporting:
At the end of the research study period, all data collected will be used in a demonstration for unit and hospital leadership to show the effectiveness of the Safety Pulse tool in capturing how frequently workplace violence is occurring within our hospital units. This data will be aggregated by date, day of the week, time of day, etc., to identify patterns of reporting that can be used to build strategies for improvement. No personally identifiable information will ever be collected or shared. Therefore, no staff follow-up will occur as a result of submitting a Safety Pulse report.
- Integration of Support Resources: A common complaint of traditional institutional reporting systems is that they fail to offer HCPs real-time support as WPV events occur. We integrate contact information for WPV support resources readily available through their employer (such as chaplains, 24-hour hotlines, peer-support groups, and wellness programs). By including information on support resources, HCPs who experience WPV are not deterred from receiving the support they need due to having to seek out resources themselves. Moreover, the integration of support resources aligns with the increasing focus on proactive strategies to mitigate the negative mental health impact of WPV on healthcare workers. Initial feedback from HCPs informs the decision to organize the resources by hours of operation and job role.

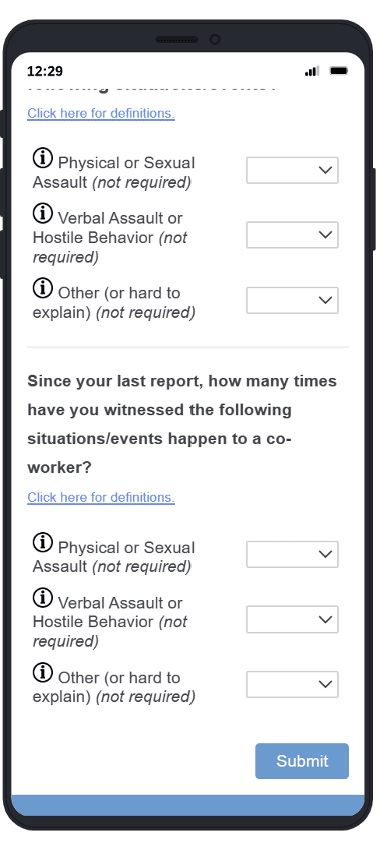
Figure 1. Screenshots of the home screen of SPARS.
Task Overview
Participants completed one of the following scenarios:
- Task 1: Please report on the following workplace violence you’ve experienced today: One incident of physical violence, two incidents of verbal abuse, and three incidents that are hard to describe.
- Task 2: Please report on the following workplace violence you’ve witnessed today: Three incidents of physical violence, two incidents of verbal abuse, and one incident that is hard to describe.
Results
Participants included 10 HCPs ranging from 25 to 44 years old, including nurses (n = 3), physicians (n = 1), students (n = 3), and non-clinical healthcare staff (n = 3). Sixty percent of participants had previously experienced WPV, and only half of those participants had submitted a WPV incident report in response to the occurrence. The first two of the 10 participants only participated in the qualitative assessment to identify any crucial usability items that should be addressed before proceeding with usability testing. Therefore, these two participants’ performances were not assessed in the NASA-TLX and PSSUQ.
The mean overall time to complete the report (SD) using the app was 7.5 s (2.59). The mean (SD and recommended human factors engineering (HFE) standard) for the global TLX score was 42.2 (31.6, > 35, and < 54; within acceptable range) (Hart, 2006; Mazur et al., 2013) (Table 1). The mean (SD and recommended HCI standard) PSSUQ score was 2.20 (0.55, < 2.82) (Lewis, 2002) (Table 2). The mean for overall PSSUQ, and PSSUQ subscales including system usefulness and interface quality, were found to be statistically significant compared to the benchmarks, p = .008, p = .008, and p = .0003, respectively (Table 3). The mean score for PSSUQ, scaled to 100, was 80.03 equating to B, which is significantly higher than the benchmark of 71.1 recommended by Lewis (2019), p = .01. Applying the Benjamini-Hochberg procedure indicated retention of all four significant values (Table 4). Furthermore, participants responded favorably to the integrated list of support programs, resources, and the explanation of how the data would be used and shared.
Table 1. Results from the NASA-TLX
| Measures | Mean (SD)* | Recommended HFE standard (Hart, 2006; Mazur et al., 2013) |
| Global NASA-TLX score | 42.2 (31.6) | > 35 and < 54 |
| Weighted subscale scores: | ||
| Mental demand | 4.33 (4.55) | |
| Physical demand | 1.00 (0.00) | |
| Temporal demand | 3.66 (3.20) | |
| Frustration | 1.2 (0.45) | |
| Effort | 2.33 (1.75) | |
| Performance | 13.00 (9.14) |
Table 2. Results from the PSSUQ
| Measures | Mean (SD) | Human-Computer Interaction recommended standards (Lewis, 2002) |
| Total PSSUQ Score | 2.20 (0.55) | < 2.82 |
| System Usefulness | 1.75 (0.50) | < 2.8 |
| Information Quality | 2.89 (0.81) | < 3.02 |
| Interface Quality | 1.89 (0.62) | < 2.49 |
Table 3. Mean Scores from the PSSUQ and NASA-TLX (p < .05) Derived by a One-Tailed t-test
| Metric | Mean | Std Dev | n | Benchmark | 90% CI | t (7 df) | p |
| PSSUQ100* | 80.0 | 9.23 | 8 | > 71.1** | 74.7 – 85.4 | 2.7365 | .01 |
| Total PSSUQ Score | 2.20 | 0.55 | 8 | < 2.82*** | 1.9 – 2.5 | -3.1884 | .008 |
| System Usefulness | 1.75 | 0.50 | 8 | < 2.80*** | 1.5 – 2.0 | -5.9397 | .0003 |
| Information Quality | 2.89 | 0.81 | 8 | < 3.02*** | 2.4 – 3.4 | -0.4539 | .3318 |
| Interface Quality | 1.89 | 0.62 | 8 | < 2.49*** | 1.5 – 2.3 | -2.7372 | .015 |
| NASA-TLX Global (low) | 42.2 | 31.65 | 8 | > 35 | 23.9 – 60.5 | 0.6445 | .27 |
| NASA-TLX Global (high) | 42.2 | 31.65 | 8 | < 54 | 23.9 – 60.5 | -1.0562 | .16 |
**Benchmark from Lewis (2019) based on minimum value for grade of C+ in the Sauro-Lewis curved grading scale for the SUS.
***Benchmarks from Lewis (2002) based on PSSUQ overall and subscale means across 21 unpublished usability studies.
Table 4. Benjamini-Hochberg Check for Significance of Seven t-tests (p < .05)
| Comparison | p | Rank | Threshold | Outcome |
| System Usefulness | 0.0003 | 1 | 0.007 | Significant |
| Total PSSUQ Score | 0.008 | 2 | 0.014 | Significant |
| PSSUQ100 | 0.01 | 3 | 0.021 | Significant |
| Interface Quality | 0.015 | 4 | 0.029 | Significant |
| NASA-TLX Global (high) | 0.16 | 5 | 0.036 | |
| NASA-TLX Global (low) | 0.27 | 6 | 0.043 | |
| Information Quality | 0.33 | 7 | 0.050 |
Conclusion
Compared to an institutional WPV reporting system, SPARS significantly decreases the time needed to report a WPV event to 7.5 s (2.59) when compared to 6.30 min (2.75) (Foster et al., 2022). Cognitive load and user satisfaction scores as measured by the global NASA-TLX score and the PSSUQ, which fell within acceptable ranges compared to benchmarks, indicate a positive user experience among HCPs in their interactions with SPARS. Given the established correspondence between the PSSUQ and SUS scores (Lewis, 2019), this relationship suggests that the user satisfaction scores we obtained via the PSSUQ can be translated into a letter grade range between B- and A-. This implies that a score lower than B would be implausible for our study, further emphasizing the overwhelmingly positive reception by HCPs. However, there are a few limitations to this study, which include a relatively small sample size with limited diversity of the participant population.
This study offers a minimum viable product for submitting aggregate reports of WPV; future research will expand its scope to assess SPARS’ broader impact on the effectiveness of WPV reporting programs and employee safety in hospital settings. Future effectiveness may be developed through streamlining access to submit detailed reports of WPV events, investigating drivers to increase adoption of WPV tools among HCPs, and analyzing the direct impact of design elements such as integrated lists of support programs on reporting behavior, perceived organizational support, and employee well-being. Design features that could further enhance user experience, such as the inclusion of time stamps reflecting the last time a report was submitted, would require incorporating some level of personally identifiable information. Researchers should aim to evaluate methods for balancing the user preferences for anonymity and ease of access with the need for improved user experience and advanced data analysis opportunities. Additionally, exploration of features such as integrated data analytics and safety thresholds in SPARS could activate support mechanisms, such as pairing a dedicated colleague or a security guard with HCPs attending to patients with a history of WPV, to address the common concern that traditional WPV reporting systems do not offer support to HCPs when the WPV events are occurring. By addressing these aspects, future research will offer a more comprehensive understanding of aggregate reporting tools like SPARS to improve WPV reporting and safety within the healthcare system. Moreover, tools like SPARS can be further assessed for applicability in industries with similarly high rates of WPV, such as educational and retail sectors, where quick and anonymous reporting could also be beneficial.
This research contributes to the ongoing efforts to address the underreporting of WPV and improve the well-being of healthcare professionals. Implementation of user-friendly and efficient reporting tools like SPARS, in tandem with other workplace safety interventions, can serve to positively influence the normalization and destigmatization of a WPV reporting culture. Improved data collection and data-driven interventions enhance organizational learning and may positively mitigate the unsustainable levels of clinician burnout (Kratzke et al., 2022; National Academies of Sciences, Engineering, and Medicine et al., 2019; Shanafelt et al., 2022) to create an overall safer work environment for healthcare professionals.
Tips for User Experience Practitioners
- If designing for environments where staff face high demands, prioritize removing obstacles that delay or deter spontaneous use.
- Consider using the PSSUQ and NASA-TLX in tandem with validated benchmarks to robustly validate tools against industry standards.
- To enhance the interpretability of PSSUQ results, consider applying the Sauro-Lewis Curved Grading Scale to calculate an estimated usability grade.
Acknowledgments
The authors wish to thank Jeff Francki and Anna Soloway for their contributions to this research as well as the University Safety and Security Committee at the University of North Carolina at Chapel Hill for their support throughout the study. We would also like to thank the participants who made this study possible and informed the refinement of the WPV reporting tool.
References
Arnetz, J. E., Hamblin, L., Ager, J., Luborsky, M., Upfal, M. J., Russell, J., & Essenmacher, L. (2015). Underreporting of workplace violence: Comparison of self-report and actual documentation of hospital incidents. Workplace Health & Safety, 63(5), 200–210. https://doi.org/10.1177/2165079915574684
Bureau of Labor Statistics. (2024). Employment in Healthcare and Social Assistance [dataset]. https://www.bls.gov/
Foster, M., Adapa, K., Cole, A., Khasawneh, A., Soloway, A., Francki, J., Havill, N., & Mazur, L. (2022). Designing a workplace violence reporting tool for healthcare workers in hospital settings. In F. Fui-Hoon Nah & K. Siau (Eds.), HCI in business, government and organizations (pp. 368–387). Springer International Publishing.
Foster, M., Adapa, K., Soloway, A., Francki, J., Stokes, S., & Mazur, L. (2022). Electronic reporting of workplace violence incidents: Improving the usability, and optimizing healthcare workers’ cognitive workload, and performance. Studies in Health Technology and Informatics, 290, 400–404. https://doi.org/10.3233/SHTI220105
Hart, S. G. (2006). Nasa-Task Load Index (NASA-TLX); 20 years later. Proceedings of the Human Factors and Ergonomics Society Annual Meeting, 50(9), 904–908. https://doi.org/10.1177/154193120605000909
Havaei, F. (2021). Does the type of exposure to workplace violence matter to nurses’ mental health? Healthcare (Basel, Switzerland), 9(1). https://doi.org/10.3390/healthcare9010041
Hedayati Emam, G., Alimohammadi, H., Zolfaghari Sadrabad, A., & Hatamabadi, H. (2018). Workplace violence against residents in emergency department and reasons for not reporting them; a cross sectional study. Emergency (Tehran, Iran), 6(1), e7.
Kratzke, I. M., Woods, L. C., Adapa, K., Kapadia, M. R., & Mazur, L. (2022). The sociotechnical factors associated with burnout in residents in surgical specialties: A qualitative systematic review. Journal of Surgical Education, 79(3), 614–623. https://doi.org/10.1016/j.jsurg.2021.11.006
Lewis, J. R. (2002). Psychometric evaluation of the PSSUQ using data from five years of usability studies. International Journal of Human–Computer Interaction, 14(3–4), 463–488. https://doi.org/10.1080/10447318.2002.9669130
Lewis, J. R. (2019). Using the PSSUQ and CSUQ in user experience research and practice. MeasuringU Press (ISBN 1733339205).
May, C. L., & Wisco, B. E. (2016). Defining trauma: How level of exposure and proximity affect risk for posttraumatic stress disorder. Psychological Trauma: Theory, Research, Practice and Policy, 8(2), 233–240. https://doi.org/10.1037/tra0000077
Mazur, L. M., Mosaly, P. R., Hoyle, L. M., Jones, E. L., Chera, B. S., & Marks, L. B. (2013). Relating physician’s workload with errors during radiation therapy planning. Practical Radiation Oncology, 4(2), 71–75. https://doi.org/10.1016/j.prro.2013.05.010
Öztaş, İ., Yava, A., & Koyuncu, A. (2023). Exposure of emergency nurses to workplace violence and their coping strategies: A cross-sectional design. Journal of Emergency Nursing, 49(3), 441–449. https://doi.org/10.1016/j.jen.2022.09.002
Sato, K., Wakabayashi, T., Kiyoshi-Teo, H., & Fukahori, H. (2013). Factors associated with nurses’ reporting of patients’ aggressive behavior: A cross-sectional survey. International Journal of Nursing Studies, 50(10), 1368–1376. https://doi.org/10.1016/j.ijnurstu.2012.12.011U.S. Bureau of Labor Statistics. (2024). Census of Fatal Occupational Injuries [dataset]. https://www.bls.gov/iif/oshcfoi1.htm