
Abstract
We propose a novel cross-sequential approach to accelerating the collection of user feedback while providing a broad perspective by analyzing samples of users at various stages of service and product experience. User experience changes over time as the relationship between user and product evolves. Understanding temporal changes is important for designing positive long-term user experience and supporting customer loyalty. However, companies and researchers face time and cost constraints, which is why longitudinal studies tracking user experience over an extended period of time are extremely rare. The cross-sequential approach we propose reduces these barriers without compromising user-feedback quality. We tested the cross-sequential approach in evaluating the user experience of a commercial Internet security service and identified user experience spanning seven months in only seven weeks with two online surveys. We compared the cross-sequential approach to the cross-sectional approach commonly used in the industry. The cross-sectional approach identified differences between cohorts of 252 users. The cross-sequential approach, on the other hand, allowed us to identify changes in individual users’ user experience. These changes could also be tracked to different usage phases. This information could guide the design of better long-term user experience for the service. The positive and negative changes in user enjoyment over time are relevant as they were reflected in users’ loyalty to the service, replicating results from longitudinal studies. Thus, the cross-sequential approach can be especially useful when quick, cost-effective user feedback is needed regarding extended periods of using services or products.
Keywords
longitudinal studies, cross-sequential study, long-term user experience, survey.
Introduction
Since many products and services are used over extended periods of time, human-computer interaction (HCI) researchers have been increasingly interested in understanding the evolution of usability and user experience over time (Courage, Jain, & Rosenbaum, 2009; Harbich & Hassenzahl, 2017; Karapanos, Zimmerman, Forlizzi, & Martens, 2009; Kujala & Miron-Shatz, 2013; Kujala, Mugge, & Miron-Shatz, 2017; Kujala, Roto, Väänänen-Vainio-Mattila, Karapanos, & Sinnelä, 2011; Kujala, Vogel, Pohlmeyer, & Obrist, 2013; Marti & Iacono, 2017; McLellan, Muddimer, & Peres, 2012; Mendoza & Novick, 2005; Sonderegger, Zbinden, Uebelbacher, & Sauer, 2012). Time has several significant effects on user experience. For example, first impressions and user expectations have a strong influence on early experiences (Kujala et al., 2017), whereas the initial user impressions of the product change over time and use (Marti & Iacono, 2017). Thus, some users’ expectations are not met and they are disappointed, while other users’ expectations may be exceeded (Bhattacherjee & Premkumar, 2004; Kujala & Miron-Shatz, 2015; Michalco, Simonsen, & Hornbæk, 2015). The temporal changes in users’ views then influence their behavior. One such instance is when exceeding hedonic expectations improves customer loyalty, as measured by word of mouth and repurchase intentions (Chitturi, Raghunathan, & Mahajan, 2008). Understanding users’ long-term experiences is important for several reasons. Products are becoming more service-oriented and prolonged use has a direct impact on companies’ revenues. Service designers are thus interested in supporting customers’ interactions with the service at multiple touch points spanning the customer journey (Dove, Reinach, & Kwan, 2016). Legislation and competition have also led to prolonged product warranties, resulting in an increasing number of fully-functioning products being returned (Karapanos, Martens, & Hassenzahl, 2012). This provides a strong incentive for companies to maintain a good user experience even at a temporal distance from purchase or sign-up.
The merits of the long-term approach to usability and user experience evaluation have been acknowledged, yet longitudinal studies are rarely used as they are considered laborious and costly (Karapanos, Zimmerman, Forlizzi, & Martens, 2010). In an industry setting, Jain and Boyce (2012) reported that longitudinal studies last too long from a management perspective and are risky due to participant attrition. In academic research, the number of participants in longitudinal studies is usually low, from six participants followed for five weeks (Karapanos et al., 2009) to 29 participants followed for 13 weeks (Harbich & Hassenzahl, 2017). Longitudinal studies covering several months or even a year are particularly rare (Fenko, Schifferstein, & Hekkert, 2010; Harbich & Hassenzahl, 2017; Kujala & Miron-Shatz, 2013).
One means of circumventing the difficulties is through analyzing log data, a popular way to collect quantitative data over longer time periods, and one that is less susceptible to issues of participation attrition (Rodden, Hutchinson, & Fu, 2010). Yet, more experiential information is needed to understand how users feel and the reasons for users’ behavior. For example, if we can see from log data that users leave the service, we don’t know why they do so.
In this paper, we present a novel way to collect feedback about user experience over longer time periods, providing companies and designers with crucial feedback from various use stages, without it being time-consuming and onerous for either the participants or the researchers. We propose a cross-sequential approach that accelerates the collection of user feedback while providing a broad perspective by analyzing samples of users at various stages of service and product experience. We test this approach by studying the user experience of a commercial Internet security service.
Main Approaches to Studying Long-Term Use
Von Wilamowitz-Moellendorff, Hassenzahl, and Platz (2006) and Karapanos, Martens, and Hassenzahl (2010) identified three methodological approaches for understanding the development of user experience over time: longitudinal, cross-sectional, and retrospective reconstruction. See Figure 1 for illustration of the three previously identified approaches and the cross-sequential approach proposed in this paper.
In the longitudinal approach, a phenomenon is studied within one group with at least three repeated measurements over time (Ployhart & Vandenberg, 2010). Karapanos, Martens, et al. (2010) described how longitudinal studies are considered the gold standard in studying change in user experience over time, although the longitudinal approach also faces methodological challenges (Ployhart & Vandenberg, 2010). The most notable validity threats to user experience studies are loss of participants, which is unavoidable in longitudinal studies (Ployhart & Vandenberg, 2010) and, relatedly, selective attrition. Regardless of their intentions, participants face everyday challenges such as illness that often prevent them from continuing their participation. In service use, dropout participants may be dissatisfied users who stopped using the service. In addition, the quality of the provided responses may decrease over a longitudinal study. For example, Möller et al. (2013) found that users’ commitment and reporting rate subsided over a six-week study period.
In the cross-sectional approach, the effect of the time variable is measured using two participant groups: one group at the outset of usage and one group at a later phase of usage. Karapanos, Martens, et al. (2010) considered cross-sectional studies weak because of the possible variation across the different user groups. Furthermore, two measurement points do not reveal the dynamics of change (Ployhart & Vandenberg, 2010). For example, when service use is studied, the experienced user group does not include users who were disappointed and stopped using the service, so the cause of the disappointment cannot be explored.

Figure 1. Main approaches and the proposed cross-sequential approach with required measurement points (t1–t2) for studying long-term use.
Retrospective elicitation of users’ experiences from memory is considered a lightweight alternative to longitudinal studies (Karapanos, Martens, et al., 2010). In this approach, users are, for example, asked to recall their previous significant experience with the product and sketch changes in their user experience over time with tools like iScale (Karapanos et al., 2012) or UX Curve (Kujala et al., 2011). Granted, users are unable to remember all the details of the interaction or the exact time when certain events occurred (Kujala et al., 2011). The benefit of this approach is that, even if users’ memories are inaccurate, their most memorable experiences are also most influential to their overall evaluation of the product and their willingness to recommend it to others (Kujala & Miron-Shatz, 2013). Thus, the retrospective approach is suitable for collecting qualitative memories from users. However, it may not be suitable for comparing different time points because of a user’s limited memory.
The Cross-Sequential Approach
The cross-sequential approach we are proposing is performed by comparing different user groups. In addition, longitudinal analysis of each user group is carried out by comparing two repeated measurements (see Figure 1). The cross-sequential approach, while not well-known in HCI, is used in developmental psychology to reduce the limitations of longitudinal studies (Schaie, 1983). It has also been used successfully in studying affective organizational commitment (Beck & Wilson, 2000). Cross-sequential is a promising approach for usability studies because it circumvents validity threats in longitudinal studies (Schaie, 1983). In HCI, there is not usually interest to study human behavior change over years, but we assume that the cross-sequential approach could be useful also for studies lasting months.
The cross-sequential (or cohort-sequential) approach is also referred to as short-term longitudinal research (Anderson, 1993). It approximates a true longitudinal study by performing several short-term longitudinal studies of participant groups that represent different phases of usage. The dynamics of change over time can be estimated by combining measurements from the different participant groups. Each participant group is studied over two measurements points, but the different groups cover different time slots. For example, one user group reveals the change happening between the first and second month of usage, while other groups reveal changes in consecutive phases, such as between the second and third month. Thus, the changes measured are intra-group.
The weakness of this approach is that measurement sequences cover shorter time periods than are tracked in longitudinal research. However, these measurements can still be linked together to cover an extended time period, even if the data comes from different participants (Anderson, 1993). As the study can be performed during a relatively short time frame, the cross-sequential approach lowers barriers inherent to the longitudinal design, such as time constraints, participant attrition, cost, and (with software products) version changes and upgrades.
In studying user experience, the cross-sequential approach can accelerate the collection of longitudinal information. As new versions of services are constantly deployed and launching of competing services may change users’ evaluations, the cross-sequential approach can provide a snapshot of the current service version combined with an understanding of how user experience evolves over time.
Methods
We tested the cross-sequential approach in an industrial case evaluating the long-term user experience of a commercial Internet security service. Our aim was to study how users’ relationship with the service develops over the first seven months. Data was collected from two consecutive online surveys of the real-life service users.
The Internet Security Service
The service is used to protect smartphones, tablets, and computers from viruses and spyware. It can also be used for protecting and locating a stolen or lost mobile phone, protecting children using the Internet, securing financial transactions, or exploring Internet safety. New customers have a one-month free trial, and then they pay for a yearly subscription.
Participants and Procedure
In the first phase of the study, 78,000 customers were sent an invitation email, and 2,068 of them (2.6%) responded by filling in the first questionnaire. The lack of incentive and unreliable email contact information may have led to the low response rate. Although the respondents were not promised any compensation prior to participating, after filling out the questionnaire, they were offered a three-month free trial for another service.
Seven weeks following the initial survey, respondents were invited to complete a follow-up questionnaire. Of the initial respondents, 455 (22.0%) replied to the second questionnaire. The 252 respondents who responded to enjoyment questions in both the initial and follow-up questionnaires and who had initially used the service for less than six months were included in the final data set. Participants came from 12 countries. The majority of participants (69.8%) were men (with 7.5% of participants not specifying gender). The mean age was 53.6 years (SD = 14.3).
Questionnaires
Table 1 shows the questionnaires and the measures included. Two questionnaires were used to study change in user experience over time.
Table 1. Questionnaires and Measures
|
Questionnaire |
Measures |
|
1. Initial |
NPS, enjoyment, background information, feature evaluations, feature usage |
|
2. Follow-up |
NPS, enjoyment, positive and negative experiences, expectation confirmation |
Note. Text in bold indicates the measures analyzed in this paper.
User experience was measured by a standard enjoyment measure (Bargas-Avila & Hornbæk, 2011). Enjoyment explains the continued use of information systems in the context of voluntary use (Aranyi & van Schaik, 2016; Cyr, Head, & Ivanov, 2009; Davis, Bagozzi, & Warshaw, 1992; van Schaik & Ling, 2008). Enjoyment also predicted the continued use of a less hedonic mobile payment service (Kujala et al., 2017). Thus, we assume that consumers expect even utilitarian services to be enjoyable and rewarding to use. The enjoyment measure included three statements adapted from previous work (Kujala & Miron-Shatz, 2013; Kujala et al., 2017; Wirtz, Kruger, Napa Scollon, & Diener, 2003): “I enjoy using the service,” “I think using the service is fun,” and “I think using the service is rewarding.” Participants rated the statements on a scale ranging from 1 (strongly disagree) to 7 (strongly agree). The measure has been previously shown to predict customer loyalty of a mobile payment service that, like the service examined in our study, has little hedonic value (Kujala et al., 2017).
In order to evaluate the effect of changes in enjoyment on customer loyalty, both questionnaires began with users’ overall evaluation of the service using a likelihood-to-recommend measure that can be used to calculate the Net Promoter Score (NPS) predicting customer loyalty (Reichheld, 2003). Likelihood-to-recommend is prompted by the question, “How likely is it that you would recommend our company to a friend or colleague?” (Reichheld, 2003). In our questionnaire, “our company” was replaced with the name of the service.
In this paper, we focus on analyzing users’ enjoyment and their likelihood to recommend. The initial questionnaire also asked participants to evaluate features of the service and included demographic questions, such as age and gender. In the follow-up questionnaire, the participants were asked to provide descriptions of their most positive and negative experiences in a similar vein as in Tuch, Trusell, and Hornbæk (2013) and Miron-Shatz (2009).
Analysis
The analysis began by establishing a summary measure of enjoyment and assessing its reliability. Cronbach’s alpha coefficient was .93 for perceived overall enjoyment in both questionnaires, demonstrating a high degree of internal reliability of the measure. Descriptive statistics were used to analyze mean and standard error of the change in user experience. Multiple regression analyses were used to investigate what variables are associated with changes in enjoyment, and whether change in enjoyment could predict customer loyalty.
Results
The cross-sequential design allows for both cross-sectional and longitudinal analysis over the identified participant cohorts. Table 2 describes the characteristics of the participant cohorts. We started with the cross-sectional analysis of the first survey results to get an estimate of the long-term user experience as measured by the enjoyment variable. Figure 2 shows high standard errors depicting individual differences in how respondents experienced the service. As user experience is subjective by nature (Hassenzahl & Tractinsky, 2006), the individual differences could be expected. Still, we can see a difference between the user cohorts: The mean enjoyment slightly increased during the first three months (W = 993, p = .04). Unexpectedly, during the first month, many respondents were disappointed. By analyzing all the responses to the open questions of the first survey, we could also find the key design features that were reasons for the disappointment; these results cannot be reported for confidentiality reasons.
Table 2. Participant Cohorts
|
Service use months in the initial survey |
Service use months in the follow-up survey |
Number of respondents |
Mean age (SD) |
|
0 |
1 |
26 |
45.8 (14.4) |
|
1 |
2 |
45 |
54.9 (13.6) |
|
2 |
3 |
60 |
55.6 (13.4) |
|
3 |
4 |
40 |
52.6 (15.3) |
|
4 |
5 |
42 |
56.2 (14.5) |
|
5 |
6 |
39 |
52.0 (14.3) |
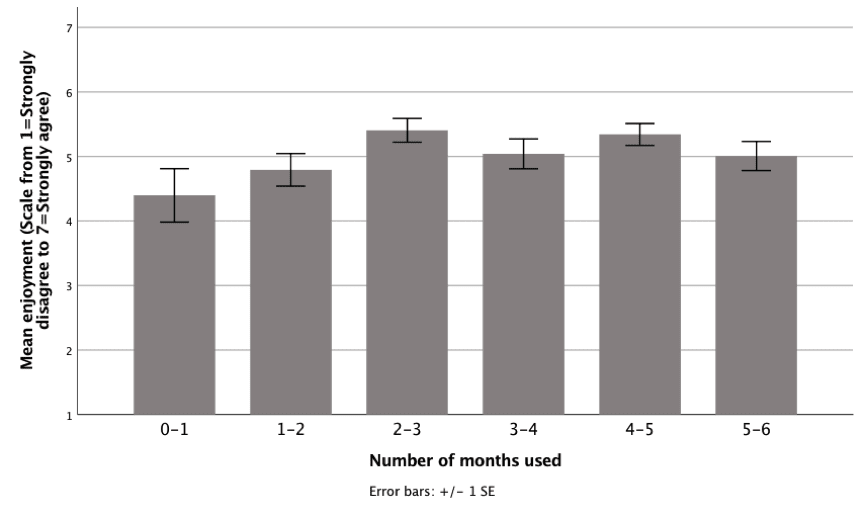
Figure 2. The mean enjoyment of the respondents.

Figure 3. The mean enjoyment changes from the initial to follow-up survey.
The next step was a cross-sequential analysis. We analyzed change in respondents’ enjoyment ratings from the initial survey to the follow-up survey. An enjoyment change measure was calculated by subtracting the participants’ initial enjoyment from their later enjoyment evaluation (mean scales) as in Kujala et al. (2017). The analysis, as shown in Figure 3, did not reveal any general trends. The mean changes in enjoyment were small compared to differences between the respondent groups in Figure 2. The relatively high standard errors reveal that the individual differences in enjoyment change are large, and that many respondents changed their evaluations dramatically either to a more positive or a more negative direction in the follow-up survey.
The enjoyment change measure enabled us to identify the respondents whose enjoyment increased (n = 97, 38.5%), remained the same (n = 66, 26.2%), or decreased (n = 89, 35.3%) over time. In retrospective (Kujala et al., 2011) and longitudinal (Kujala & Miron-Shatz, 2015) studies, the increasing or constant trends of overall evaluations were related to better customer loyalty compared to decreasing evaluation trends.
We conducted a multiple regression model with change in enjoyment as a dependent variable. The independent variables were two dichotomous variables representing whether the participant had reported positive and negative experiences (130 participants had reported positive experiences and 41 negative). The standardized coefficient for positive experiences was 0.36, p = 0.01, and for negative experiences –0.13, ns. Thus, having reported positive experiences predicted a positive change in enjoyment with a small effect size. Negative experiences did not have a statistically significant impact in enjoyment change.
Next, we tested whether the enjoyment change measure predicted customer loyalty. The regression model consisted of two fixed effects: the enjoyment change measure and likelihood to recommend on the initial measurement. The first effect tested whether the changes in enjoyment were reflected in the follow-up likelihood to recommend the service. Second, we added initial likelihood to recommend as a control into the model because previous study findings suggest that earlier evaluations influence later evaluations in long-term use as user experience stabilizes over time (Bhattacherjee & Premkumar, 2004; Kujala et al., 2017).
The results of the regression model for follow-up likelihood to recommend are shown in Table 3. These results indicate that both the enjoyment change measure and the initial likelihood to recommend predict the follow-up likelihood to recommend the service in a statistically significant manner, the former having a small but significant effect and the latter a large effect. The model validity was also tested using a linear multilevel regression where, in addition to the two fixed variables, there were random effects for starting month of the service use and respondent’s country. These did not change the model coefficients (up to two decimals), indicating that the effects displayed in Table 3 do not vary between different starting month of the use or the country of origin of the respondent.
Table 3. The Regression Model Predicting the Follow-Up Likelihood to Recommend
|
|
Std coef |
|
Change in enjoyment |
0.24*** |
|
Initial likelihood to recommend |
0.72*** |
|
Adjusted R2 |
0.54 |
*** p < 0.001
Conclusion
In this exploratory study, we investigated whether a novel cross-sequential approach could be used to collect feedback about user experience of a service over extended periods of time. The study demonstrated the benefits of the cross-sequential approach and its applicability to studying how user experience evolves over time. The results suggest that the cross-sequential approach is useful in identifying long-term effects within a relatively short time-frame. Even though we attained feedback from users spanning seven months of service use, we did not need to follow them for this extent of time, as we would be required to using a longitudinal approach. On top of cost-saving, and reduced effort to researchers and participants, the drop-out rate of participants was relatively low, which improved the validity of the results.
Unlike the cross-sectional approach, each user responded to two surveys, and we were able to identify those users whose experience changed over time. The enjoyment change measure revealed whether an individual change in user experience was positive or negative. The change in user experience was reflected in users’ loyalty to the service, confirming findings in previous studies that positive changes or stable enjoyment of the product are related to greater user loyalty (Kujala & Miron-Shatz, 2015; Kujala et al., 2011). By analyzing the experience narratives reported by the users, we could detect reasons for user satisfaction or disappointment. This information could be used to improve the design of the service by increasing the visibility of features that contributed to user enjoyment while improving features that prevented users from enjoying the service.
Because participants had used the service for up to six months at the time of the first survey, we expected their experiences to accumulate and their evaluations to stabilize as Bhattacherjee and Premkumar (2004) found to happen after one month of use. Indeed, the statistical model we used to analyze the cross-sequential data revealed that users’ overall evaluation of a service was stable, with current appraisal being a strong predictor of future appraisals. However, when controlling for past appraisal, we also observed that an individual user’s experience can change even after several months of use. By contrast, the cross-sectional analysis did not reveal individual differences, although it was also useful in identifying the challenges that many users had at the beginning of the use.
The short study period ensured that fewer interfering variables influenced the results. It allowed for all the results to be derived from the same version of the service. This is beneficial as services are often upgraded, which means that when tracking user experience over time, feedback is received regarding two or more versions at once, and is hard to disentangle. The results imply that the cross-sequential approach can be especially useful in industrial contexts where user feedback on extended use is needed quickly, and users’ commitment to longitudinal studies is a challenge.
Validity and Limitations
The real-world context provided ecological validity to the study: Our surveys were implemented in the context of a commercial service, and the respondents were recruited from its customer base. Thus, this study provides important insight on how the cross-sequential approach can be used in an industrial context.
The response rate was low, albeit comparable to similar industry surveys not offering compensation to participants (Fryrear, 2018). The low response rate may indicate that the sample does not represent the entire user population, and the small sample may lead to biased results. However, our aim was not to generalize the results but rather to test whether the cross-sequential approach can identify change in user experience. Due to the industrial context of the study, we did not have a control group. Still, thanks to our design, we were able to compare a cross-sectional study (the first survey) and a cross-sequential study (the first and second survey). Because our sample included enough variance to reveal individual differences and changes in user experience, we showed that the cross-sequential approach is able to identify change in user experience.
Enjoyment was used as a measure of user experience as modeled in previous studies (Bargas-Avila & Hornbæk, 2011). Even though the studied Internet security service is not hedonic in nature, the results support earlier findings that enjoyment predicts customer loyalty when use is voluntary (Kujala et al., 2017). As the scope of the study was limited to one type of service, future research is needed to determine whether the temporal effects extend to other products and services. However, our study did demonstrate the advantages of cross-sequential approaches to analyzing user experience over time relative to the cross-sectional approach.
Tips for Usability Practitioners
The results of the study lead to the following recommendations to evaluating long-term user experience:
- When using the cross-sequential approach with two repeated measurement points, perform both cross-sectional and cross-sequential analysis. Identify the change that happened between measurement points and those users whose user experience improved, remained the same, or deteriorated. This enables you to identify the timing and reasons for changes.
- Note that the experienced user group may not include disappointed users who stopped using the service, and the cause of the disappointment may not be identified.
- Consider using the enjoyment measure as it relates to customer loyalty.
- In addition to quantitative data, collect experience narratives in order to reveal the reasons for negative or positive user experiences.
Acknowledgments
The authors are grateful to Tarja Aarnio, Charlène Revault-Riekki, and Timo Salmi for their collaboration and help.
References
Anderson, E. (1993). Analyzing change in short-term longitudinal research using cohort-sequential designs. Journal of Consulting and Clinical Psychology, 61(6), 929–940.
Aranyi, G., & van Schaik, P. (2016). Testing a model of user-experience with news websites. Journal of the Association for Information Science and Technology, 67(7), 1555–1575. https://doi.org/10.1002/asi.23462
Bargas-Avila, J. A., & Hornbæk, K. (2011). Old wine in new bottles or novel challenges: A critical analysis of empirical studies of user experience. In Proceedings of the 2011 annual conference on Human factors in computing systems (pp. 2689–2698).
Beck, K., & Wilson, C. (2000). Development of affective organizational commitment: A cross-sequential examination of change with tenure. Journal of Vocational Behavior, 56(1), 114–136. https://doi.org/10.1006/jvbe.1999.1712
Bhattacherjee, A., & Premkumar, G. (2004). Understanding changes in belief and attitude toward information technology usage: A theoretical model and longitudinal test. MIS Quarterly, 28(2), 229–254.
Chitturi, R., Raghunathan, R., & Mahajan, V. (2008). Delight by design: The role of hedonic versus utilitarian benefits. Journal of Marketing, 72(3), 48–63.
Courage, C., Jain, J., & Rosenbaum, S. (2009). Best practices in longitudinal research. In Proceedings of the 27th international conference extended abstracts on Human factors in computing systems (pp. 4791–4794).
Cyr, D., Head, M., & Ivanov, A. (2009). Perceived interactivity leading to e-loyalty: Development of a model for cognitive–affective user responses. International Journal of Human-Computer Studies, 67(10), 850–869. https://doi.org/10.1016/j.ijhcs.2009.07.004
Davis, F. D., Bagozzi, R. P., & Warshaw, P. R. (1992). Extrinsic and intrinsic motivation to use computers in the workplace. Journal of Applied Social Psychology, 22(14), 1111–1132.
Dove, L., Reinach, S., & Kwan, I. (2016). Lightweight journey mapping: The integration of marketing and user experience through customer driven narratives. In Proceedings of the 2016 CHI Conference Extended Abstracts on Human Factors in Computing Systems (pp. 880–888). New York, NY, USA: ACM. https://doi.org/10.1145/2851581.2851608
Fenko, A., Schifferstein, H. N. J., & Hekkert, P. (2010). Shifts in sensory dominance between various stages of user-product interactions. Applied Ergonomics, 41(1), 34–40.
Fryrear, A. (2018). Survey response rates. Retrieved from https://www.surveygizmo.com/survey-blog/survey-response-rates/
Harbich, S., & Hassenzahl, M. (2017). User Experience in the work domain: A longitudinal field study. Interacting with Computers, 29(3), 306–324. https://doi.org/10.1093/iwc/iww022
Hassenzahl, M., & Tractinsky, N. (2006). User experience – A research agenda. Behaviour & Information Technology, 25(2), 91–97. https://doi.org/10.1080/01449290500330331
Jain, J., & Boyce, S. (2012). Case study: Longitudinal comparative analysis for analyzing user behavior. In CHI’12 Extended Abstracts on Human Factors in Computing Systems (pp. 793–800). Retrieved from http://dl.acm.org/citation.cfm?id=2212852
Karapanos, E., Martens, J. B., & Hassenzahl, M. (2010). On the retrospective assessment of users’ experiences over time: Memory or actuality? In Proceedings of the 28th of the international conference extended abstracts on Human factors in computing systems (pp. 4075–4080).
Karapanos, E., Martens, J.-B., & Hassenzahl, M. (2012). Reconstructing experiences with iScale. International Journal of Human-Computer Studies, 70(11), 849–865. https://doi.org/10.1016/j.ijhcs.2012.06.004
Karapanos, E., Zimmerman, J., Forlizzi, J., & Martens, J. B. (2009). User experience over time: An initial framework. In Proceedings of the SIGCHI Conference on Human Factors in Computing Systems (pp. 729–738). Retrieved from http://dl.acm.org/citation.cfm?id=1518814
Karapanos, E., Zimmerman, J., Forlizzi, J., & Martens, J.-B. (2010). Measuring the dynamics of remembered experience over time. Interacting with Computers, 22(5), 328–335. https://doi.org/10.1016/j.intcom.2010.04.003
Kujala, S., & Miron-Shatz, T. (2013). Emotions, experiences and usability in real-life mobile phone use. In Proceedings of the SIGCHI Conference on Human Factors in Computing Systems (pp. 1061–1070).
Kujala, S., & Miron-Shatz, T. (2015). The evolving role of expectations in long-term user experience. In Proceedings of the 19th International Academic Mindtrek Conference (pp. 167–174). ACM Press. https://doi.org/10.1145/2818187.2818271
Kujala, S., Mugge, R., & Miron-Shatz, T. (2017). The role of expectations in service evaluation: A longitudinal study of a proximity mobile payment service. International Journal of Human-Computer Studies, 98, 51–61. https://doi.org/10.1016/j.ijhcs.2016.09.011
Kujala, S., Roto, V., Väänänen-Vainio-Mattila, K., Karapanos, E., & Sinnelä, A. (2011). UX Curve: A method for evaluating long-term user experience. Interacting with Computers, 23, 473–483.
Kujala, S., Vogel, M., Pohlmeyer, A. E., & Obrist, M. (2013). Lost in time: The meaning of temporal aspects in user experience. In CHI’13 Extended Abstracts on Human Factors in Computing Systems (pp. 559–564). Retrieved from http://dl.acm.org/citation.cfm?id=2468455
Marti, P., & Iacono, I. (2017). Experience over time: Evaluating the experience of use of a squeezable interface in the medium term. Multimedia Tools and Applications, 76(4), 5095–5116. https://doi.org/10.1007/s11042-016-3595-8
McLellan, S., Muddimer, A., & Peres, S. C. (2012). The effect of experience on System Usability Scale ratings. Journal of Usability Studies, 7(2), 56–67.
Mendoza, V., & Novick, D. G. (2005). Usability over time. In Proceedings of the 23rd annual international conference on Design of communication: documenting & designing for pervasive information (pp. 151–158).
Michalco, J., Simonsen, J. G., & Hornbæk, K. (2015). An exploration of the relation between expectations and user experience. International Journal of Human-Computer Interaction, 150701125618002. https://doi.org/10.1080/10447318.2015.1065696
Miron-Shatz, T. (2009). Evaluating multiepisode events: Boundary conditions for the peak-end rule. Emotion, 9(2), 206.
Möller, A., Kranz, M., Schmid, B., Roalter, L., & Diewald, S. (2013). Investigating self-reporting behavior in long-term studies. In Proceedings of the SIGCHI Conference on Human Factors in Computing Systems (pp. 2931–2940). ACM Press.
Ployhart, R. E., & Vandenberg, R. J. (2010). Longitudinal Research: The Theory, Design, and Analysis of Change. Journal of Management, 36(1), 94–120.
Reichheld, F. F. (2003). The one number you need to grow. Harward Business Review, 81(12), 46–54.
Rodden, K., Hutchinson, H., & Fu, X. (2010). Measuring the user experience on a large scale: user-centered metrics for web applications. In Proceedings of the SIGCHI conference on human factors in computing systems (pp. 2395–2398). ACM.
Schaie, K. W. (Ed.). (1983). Longitudinal studies of adult psychological development. New York: Guildford Press.
Sonderegger, A., Zbinden, G., Uebelbacher, A., & Sauer, J. (2012). The influence of product aesthetics and usability over the course of time: A longitudinal field experiment. Ergonomics, 55(7), 713–730.
Tuch, A. N., Trusell, R., & Hornbæk, K. (2013). Analyzing users’ narratives to understand experience with interactive products. In Proceedings of the SIGCHI Conference on Human Factors in Computing Systems (pp. 2079–2088). New York, NY, USA: ACM. https://doi.org/10.1145/2470654.2481285
van Schaik, P., & Ling, J. (2008). Modelling user experience with web sites: Usability, hedonic value, beauty and goodness. Interacting with Computers, 20(3), 419–432.
von Wilamowitz-Moellendorff, M., Hassenzahl, M., & Platz, A. (2006). Dynamics of user experience: How the perceived quality of mobile phones changes over time. In User Experience – Towards a unified view, Workshop at the 4th Nordic Conference on Human-Computer Interaction (pp. 74–78).
Wirtz, D., Kruger, J., Napa Scollon, C., & Diener, E. (2003). What to do on spring break? Psychological Science, 14(5), 520–524.