
Abstract
As Web technology evolves, information organizations strive to benefit from the latest developments. Many academic and government organizations develop applications in Second Life, an online virtual world that allows users to interact with one another and the virtual environment via graphical personas, to support education and information outreach. This is accompanied by growing interest in evaluation methods for Second Life applications. While no special methods have been developed for Second Life or other virtual worlds, the field of Web evaluation is mature and likely to offer metrics, methods, and tools that might be adaptable to Second Life. The goal of this project was to analyze how existing Web measures of Internet performance, Web usage, usability, and user feedback could be adapted, expanded, and modified for Second Life. The project employed two facilitated expert panel discussions, followed by an empirical pilot-test of the experts’ suggestions. The findings suggest that prevailing methods and metrics of four key evaluation dimensions can be adapted to Second Life. Specific recommendations are made for their adaptation. Challenges involve lack of universal Second Life design practices and user expectations, influence of other avatars on user experience, complexity of 3-D topography, high technical requirements for data collection, and the proprietary nature of Linden Lab’s data.
Practitioner’s Take Away
The following are the practical recommendations from this project:
- To monitor performance of user applications in Second Life, create simple software tools for collecting availability and response-time statistics using scripts. At the present time, no companies offer these services, but the task is fairly easy for sufficiently motivated developers.
- To obtain usage statistics about your Second Life applications, use commercial in-world analytics companies that build products and services on top of the virtual platform.
- To conduct usability testing in Second Life, employ user testing and focus groups methods and follow the testing recommendations summarized in Figure 4 of this manuscript. Be sure to test placement and helpfulness of navigational aids and the effect of your 3-D space metaphor on the ease of finding information.
- To ease the process of moderating of multi-player Second Life user testing sessions, assign separate moderators to teams or pairs of participants, create chat groups to reduce the number of communication channels for the moderator to attend, and employ pre-written chat macros for in-world interviewing.
- To be able to obtain transcripts of typed communications during the session, make sure Second Life text chats are set to be recorded.
- To handle video data of user testing sessions, convert Morae recordings to a format that significantly reduces the files’ size and import notation separately. Configure the Second Life settings not to use the internal Second Life browser for following Web links, because Morae cannot record it.
- To obtain user feedback, employ in-world or linked-out surveys, focus groups, and polls by staffed avatars or drones.
Motivation Behind This Project
The status of Multi-User Virtual Environments (MUVEs), also known as virtual worlds (VWs), on the Internet is changing from a new frontier to a densely populated place of gaming, business transactions, social networking, research, and training (Freitas, 2008). While the trend started with gaming and socialization, it has now evolved to include government and educational organizations that use VWs as a new medium to inform and educate the public (Williams, Gütl, Chang, & Kopeinik, 2009). In doing so, these organizations hope to stay on the cutting edge of modern technology, reach millions of individuals with avatars1 who are not likely to be reached via more traditional channels, and interact with users in ways that are beyond the capabilities of the traditional Web (Cacas, 2010). Second Life, the largest VW that allows user-created content, has a rapidly growing number of “regions” (units of virtual real estate) with an educational and informational focus (Bakera, Wentza, & Woodsa, 2009). Today, over a hundred government agencies, universities, and non-profit organizations have virtual land in Second Life. Government presence in Second Life includes the National Oceanic and Atmospheric Administration (NOAA), NASA, the National Institutes of Health and its National Library of Medicine (NLM), the Centers for Disease Control and Prevention (CDC), the Internal Revenue Service (IRS), a number of military applications such as the Naval Undersea Warfare Center (NUWC), and multiple other federal organizations (Betterverse, 2009; Pellerin, 2007).
Evaluation is an essential step of any technology application development process, but it is especially important when the applications are in novel environments. For example, some evaluation objectives of educational and informational regions in VWs overlap with those of gaming and commercial regions (e.g., assessing ease of navigation). However, other VW evaluation objectives are unique and include ensuring that these new services meet agency mission and public needs, providing accountability, and measuring of the public’s learning and trust in the information provider. These unique evaluation objectives reflect unique features and possibilities afforded by the VW environment (Boulos & Maramba, 2009). The importance of evaluation is well understood in the federal VW community. Participants in the Second Federal Consortium for Virtual Worlds Conference expressed high interest in metrics and analysis techniques for applications on VW platforms. Paulette Robinson, the organizer of the federal Virtual Worlds conferences, noted that while federal agencies are now willing to explore VW technology beyond simple pilot testing, case studies and metrics are needed to justify the investment (Cacas, 2010).
Unfortunately, the development of VW evaluation methods lags behind the emergence of applications in VW environments. Very little published material exists on the topic, with existing studies focusing on evaluating virtual spaces or activities, rather than on evaluation methodologies themselves (e.g., Jaeger, 2009; Williams, Gütl, Chang, & Kopeinik, 2009; Wrzesien & Raya, 2010). This contrasts with the wealth of available information on all aspects of Web evaluation, related to Internet performance, quantitative Web usage, usability, and user feedback (Wood et al., 2003). This project was based on the assumption that many established Web evaluation methods might be applicable to VWs, but with modifications. The objectives of this project were to (a) analyze how existing Web 1.0 Internet performance, usage, usability, and user feedback evaluation methods could be adapted to VWs and (b) test the practicality and potential usefulness of the adapted methods on a current VW environment. The project was conducted in the context of the National Library of Medicine’s (NLM) pilot VW application, Tox Town in Second Life. The methods involved two expert review sessions, followed by a pilot test of the methods during a team usability exercise.
1An avatar is an electronic image that represents and is manipulated by a computer user (as in a computer game), Merriam-Webster Dictionary.
U.S. National Library of Medicine, and its Tox Town and Tox Town in Second Life Resources
U.S. National Library of Medicine (NLM) is the world’s largest medical library and is the leader in health information management and dissemination. As such, NLM plays an active role in developing and evaluating innovative information technology. Tox Town2, developed by NLM, is a Web site for the general public that provides information about environmental health concerns and potentially toxic chemicals that are found in everyday locations. Recognizing the educational potential of VWs, NLM created a pilot application version of Tox Town in the Second Life VW platform that explores the graphical and interactive capabilities of this virtual world to present environmental health information in a highly interactive and immersive way. This initiative also explores the utility of this medium to provide health information to special communities and as a virtual training and remote collaboration platform. In some cases, the information within Tox Town in Second Life is placed directly in the environmental context (e.g., information about lead in the water can be obtained upon interaction with a water fountain in a school building). In other cases, the information comes from more traditional information products, such as posters and movie screens displayed in the VW library building. This pilot application served as a test bench for the study of VWs evaluation methods in this project. Figures 1 and 2 present some scenes, depicting avatars interacting with Tox Town in Second Life.
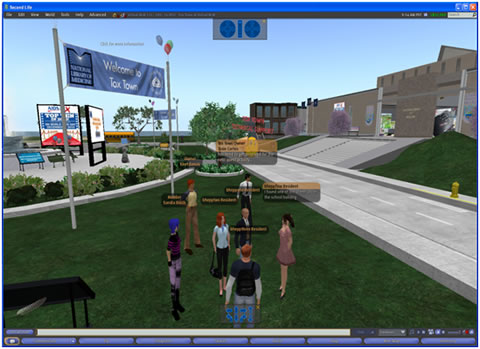
Figure 1. A group of avatars gathering in Tox Town in Second Life, as seen by a user with a standard Second Life’s viewer application. The text over the avatars shows their names and text messages, which the avatars are exchanging via a local “chat” feature.
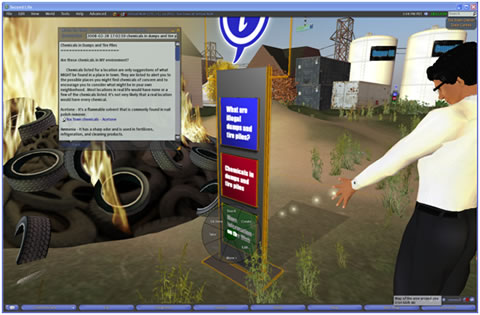
Figure 2. An avatar in Tox Town in Second Life clicks on an “information kiosk” to obtain information about chemical hazards in the simulated environment.
Practical Framework: The Four Dimensions of Web Evaluation of Information Products
In “A Practical Approach to E-Government Web Evaluation,” NLM suggested a practical framework for performing evaluations of government Web sites (Wood et al., 2003). The article presented practical methods, products, and services that can be used to perform such evaluations. This evaluation framework has been successfully used by NLM and other government agencies over the years on a number of government Web sites, although some of the services and tools have changed over time as technologies and the IT industry have evolved. The framework focused on methods in four evaluation dimensions:
- Usability: behavioral feedback from a limited number of users regarding their experience with the Web site
- User feedback: direct, usually qualitative feedback from actual Web users, typically in survey or focus groups format
- Usage: quantitative data about Web usage levels, primarily from Web log analysis
- Web performance: measures related to the Web site’s response time and availability
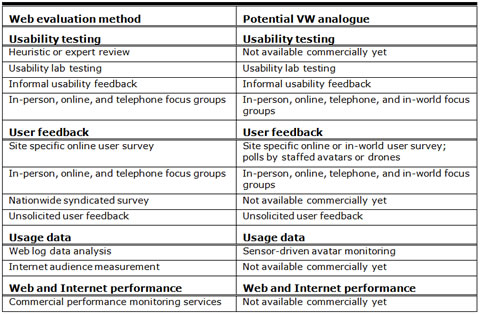
The article made a distinction between evaluation dimensions (e.g., usability, user feedback), measures (or variables that can be assessed, such as user satisfaction), and methods (or techniques for obtaining the measures, such as surveys). Figure 3 outlines the four Web evaluation dimensions, along with specific measures within each dimension, as well as analogous areas and evaluation dimensions in VWs.
While the remainder of this paper treats these evaluation dimensions as independent, we do this with the understanding that their boundaries are permeable. As any categorization scheme, this framework is a simplification that reduces a complex universe to a small number of discreet categories, in order to make it more manageable. In reality, usability, usage, and performance can be viewed as outcomes that influence one another (e.g., efficient performance contributes to usability and usability increases usage). However, as evaluation domains, the four outlined areas are characterized by distinctive, if not completely independent, sets of analytic methods. While we recognize that the chosen framework division is imperfect, we find it practically useful for developing and adapting methodologies.
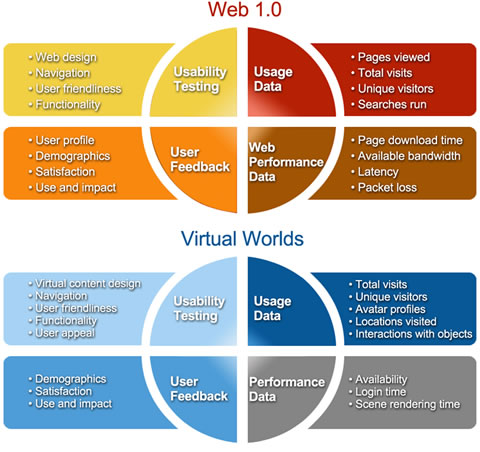
Figure 3. The four Web evaluation dimensions used on NLM’s evaluation framework and their VW analogue.
Expert Panel Reviews: Methodological Approach
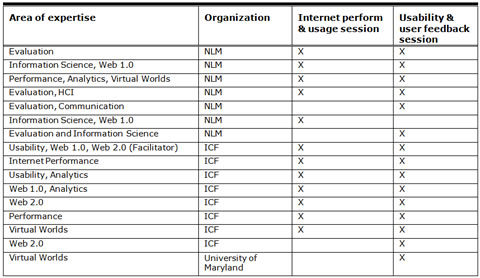
Two full-day facilitated structured expert review sessions explored how traditional Web evaluation methods might be applied to VWs. The first session concerned Web and Internet performance and usage, while the second focused on usability and user feedback. When structuring the expert panels, we did not set out to seek nationally and internationally renowned leaders in the pertaining fields. Such an endeavor would have been indisputably invaluable, but outside the financial and logistical scope of this project. Instead, we drew from the internal resources of the National Library of Medicine (an international leader in organizing and delivering electronic health information) and ICF International (a global company supplying services to NLM, specializing in research, analysis, implementation, and improvement of innovative technologies). This was supplemented by the expertise of an academic researcher specializing in transmedia and game studies. We aimed to assemble panels of individuals with substantial practical and theoretical experience, representing a broad range of fields with relevance to VWs evaluation. The participants specialized in Internet performance, Web 2.0/ social media and VWs, Web analytics, Web development, and usability evaluations (see Table 1). The participants had between seven and 45 years of experience in their respective fields (mean = 18, median = 18). Four held doctoral degrees, with most of the others holding master’s degrees. Seven participants (2 from ICF and 5 from NLM) had direct experience in Web 1.0 usability evaluation, which ranged from developing tools and protocols and conducting sessions to designing large-scale organizational testing strategies and conducting research. The NLM’s participants’ usability experience was primarily with Web sites for health professionals and consumers (including sites in environmental health and toxicology); the expertise of ICF usability experts was broad.
Table 1. Expert Panel Members’ Areas of Expertise (X)
Each session lasted eight hours and consisted of a series of highly structured exercises in which traditional Web evaluation metrics and tools were analyzed for their relevance and adaptability to VWs. Panelists determined specific actions needed to modify traditional Web methods and tools for VWs’ applicability and prioritized these actions based on importance and cost. A trained facilitator closely monitored the sessions, ensuring adherence to the sessions’ timeline and protocol. The exercises often involved small group discussions and presentations to the other groups and resulted in artifacts such as individuals’ notes and groups’ lists and flowcharts. The facilitator encouraged the participants to express dissenting opinions, to be resolved in the discussions. However, due to the diverse and complementary range of expertise in the panels, most of the time the actual process resembled assembling a jigsaw puzzle where participants contributed unique pieces, rather than a heated debate. At the end of each session all the artifacts were collected by the facilitator and reviewed by a group of four key project officers who were members of both panels. Finally, the project officers created summative statements that combined and organized the panels’ consensus views. The summaries were used in the subsequent pilot testing of evaluation methods in Tox Town in Second Life. Although the summaries were based on the in-depth, structured discussion, the panels’ findings have an element of subjectivity, because of their narrative nature, and because they ultimately express the opinion of a specific group. The goal of the exercises was to generate a set of ideas and recommendations to test in the subsequent research. A different groups of experts could come up with somewhat (though, presumably, not completely) different recommendations.
Expert Panel Reviews: Findings
The sessions’ findings indicated that many Web 1.0 evaluation metrics and methods appeared applicable to VW environments (Table 2). The panels recorded possible applications of these methods and metrics to VWs and suggested potential modifications. The details are as follows.
Table 2. Web Evaluation Methods and Their Potential VW Analogues
Usability
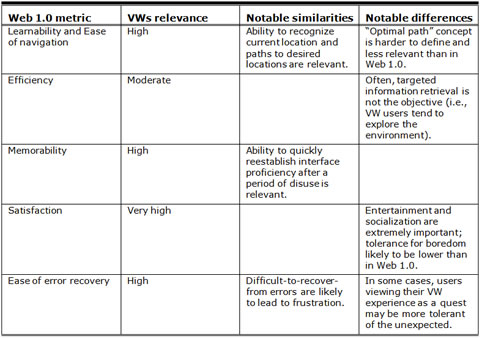
The panel concluded that most of Web 1.0 usability metrics were relevant for VWs, with efficiency being somewhat less important and enjoyment/satisfaction extremely important (see Table 3). This has to do with the goals of VW interactions, which are more likely to be about immersion, socialization, and exploration, and less likely to be about the shortest path to the needed information. Ease of navigation and learnability were deemed relevant and likely to be impacted by virtual topography of the 3-D environment. Like usability metrics, most traditional usability methods are also relevant in VWs according to the panel experts. User testing and focus groups were thought largely applicable, with more adjustments needed for user testing. Heuristic reviews might be applicable in the future; however, a separate investigation is needed to adapt existing leading heuristics to VWs.
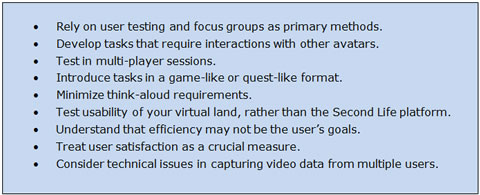
Figure 4. Expert panel’s recommendations
Table 3. Relevance of Traditional Suability Metrics to Virtual Worlds (based on the expert panel)
The panelists felt that modifications required for adapting traditional Web user testing methods to VWs were related to the unique characteristics of VW environments. One such characteristic is the social nature of the VWs: user experience and satisfaction are likely to be greatly affected by interactions with other avatars, their appearance, experience, friendliness, etc. The other characteristic is the game-like or quest-like nature of many VW environments. To preserve the authenticity of the experience during testing, panel members recommended that our VW usability evaluation engage multiple participants and motivate participants in search-oriented tasks by presenting them a quest or game-like format within the VW.
The expert panel participants also indicated that VW environments may require innovative methods for inferring the users’ intentions, as the complex, multi-tasking nature of a VW experience may complicate eliciting think-aloud protocols. This challenge could potentially be addressed through post-study think-alouds and question-and-answer times and activities that fit into the flow of the experience. Another potential methodological challenge lies in the need to distinguish between usability of the VW platform (e.g., Second Life), which is beyond the application designer’s control, and the application created on that VW platform (e.g., Tox Town in Second Life). This issue resembles usability testing of the earlier days of the Internet, when browser controls were not standardized and users were not uniformly experienced with them (e.g., Netscape Navigator 3.0 vs. Internet Explorer 2.0). Addressing this challenge may require testing experienced VW users and novices separately, and providing novices with an introduction to and support for the specific VW platform.
The panelists believed that in addition to unique theoretical and methodological challenges, usability testing in VWs is likely to involve distinctive technical considerations. For example, to fully understand the nature of VW interactions, evaluators might want to record sessions by multiple participants, each participating on a different monitor simultaneously, but with views of all the monitors captured in parallel on a single recording. This will allow future comparison of user actions, avatar motions or viewing angles at any given point in time. With the help of a screen mirroring utility like Real VNC, this feature appears to be supported by Morae version 3.1, at least for two screens at a time. Displaying and recording more than two participants’ screens in tandem would require testing Morae with multiple graphics cards.
User Feedback
The panelists suggested that similarly to usability, some VW user satisfaction metrics are likely to mirror those of the traditional Web (e.g., Content, Functionality, Look and Feel, Search and Navigation of the American Customer Satisfaction Index, ACSI). Others are likely to resemble satisfaction dimensions of video games (Isbister & Schaffer, 2008) and include, among other things, the ability to interact with others and allow users to control avatars and the environment. Additional research is needed to define specific metrics. At the present time, assessment of satisfaction should combine traditional Web and the newer gaming measures.
Panelists felt that the leading methods of obtaining user feedback about traditional Web applications, focus groups, and surveys are applicable to VWs. Further, the panelist thought VWs would allow greater variability of communication modes and triggers. In addition to the traditional face-to-face, Web and phone modes, focus groups about VW applications can be conducted in-world via typed chat or audio (i.e., avatars talking within the VW via their users communicating using their computer microphones/speakers). VW surveys can be triggered via static invitations (e.g., banners), event-based pop-ups (e.g., based on an avatar’s proximity to an object), or by an invitation from a pollster, who can be a staffed avatar or a drone. It was additionally noted that surveys can be implemented in a Web browser, via popular tools such as Zoomerang or Survey Monkey, or through in-world interactive scripts embedded within objects. As users of VWs may reflect their in-world personas more than their real-world personas, more research is needed to determine what effects this may have in in-world survey responses (Palfrey & Gasser, 2008).
Performance
On the Web side, many organizations collect IT performance information at different levels of detail and for different specific purposes (e.g., for content management purposes or technical infrastructure management purposes). For the purposes of this study, our focus was on basic performance information that can support the maintenance of the information content. It was suggested that useful performance metrics should at a minimum include content availability and download speed over time. In our panel sessions and through subsequent empirical testing, we were unable to identify automated performance tools that we considered useful for VWs. Linden Labs makes available some performance metrics in their client software, but it is difficult to relate the data they provide to the actual information content in the VW.
Usage
The panel agreed that existing automated commercial services (e.g., Maya Technologies) provide a number of useful metrics per period of time, including: number of unique visitors, total visits, unique visitors interacting with specific content, number of hours spent by visitors at location, and average visit duration. These same metrics are used on the Web today. Commercial VW usage services also employ some unique data visualization methods, such as 3 D heat maps. The challenge lies in expanding to VWs some metrics that are common on the Web, but are not easy to define in VWs, such as page views. A VW metric similar to page views could be useful, but the part of the content visible to the user at any given moment is difficult to determine automatically, even when the location of the avatar is known.
Pilot Exercises: Methodological Approach
The goal of this phase of the project was to develop and conduct exercises that would pilot-test experts’ recommendation for the (a) ease of implementation, (b) potential usefulness, and (c) methodological and technical challenges to obtaining informative results.
Usability and User Feedback
In the previous sections of this paper, we used the term usability testing broadly, to refer to the full range of usability analysis methods, including user testing, focus groups, and heuristic reviews. The adaptability of all these methods to VWs was of general interest to us. However, with regard to usability testing during the pilot exercise, our main interest was to develop a Second Life analogue of Web 1.0 user testing. In Web 1.0, this testing typically involves an active intervention session in which a facilitator guides a participant through series of targeted tasks, while eliciting think-aloud protocols and capturing the data via Morae software. The expert panel suggested that the usability evaluation should reflect the social interactivity and quest-like nature of the VW experience. To incorporate these features, the exercise was designed as a group scavenger hunt hat we called the “Infothon.” In two user sessions, three groups of three users completed the tasks. The Infothon participants were IT professionals with variable experience in interactive gaming and moderate to no prior experience in Second Life. All had college or graduate-level degrees, but only one had science background (biochemistry) that might have enabled her to judge the accuracy of the technical information provided in Tox Town. During the preliminary screening and recruitment, all expressed moderate-to-high level of interest in environmental impact on human health, as an issue with practical relevance to their life. At the same time, because this was a convenience sample, their motivation to persist on tasks might have been lower than that of spontaneous users of environmental health Web sites. A facilitator, stationed in a central location, received answers and interviewed participants delivering quest responses, using a combination of structured, pre-scripted questions and spontaneous probes. The primary goal of the interview was to obtain participants’ answer and to inquire about the path that led to it. Three additional observers roamed in-world, occasionally asking participants clarifying questions.
The Infothon procedure involved the following:
- Interactive Second Life training session (45 min).
- Activity orientation, including teams’ assignment and instructions about the scavenger hunt tasks, process, and communications with the facilitator (15 min).
- Scavenger hunt (2 hours): Teams of three participants engaged in the two-hour long scavenger hunt, collaborating on eight usability tasks and completing in-world or browser user feedback surveys (see below).
- In-world focus group discussion of the scavenger hunt experience (30 min).
User tasks
The tasks aimed to investigate users’ experience with Tox Town in Second Life, rather than Second Life avatar controls. The focus was on the effectiveness and efficiency of information retrieval rather than deep learning of the toxicology information available in Tox Town. In particular, we hoped to be able to identify sub-optimally placed information (e.g., in low-traffic areas or in locations that were not commonly associated with that information). The wordings of the tasks were general enough to permit users to select a variety of paths and modes of transport (e.g., foot, flight, teleportation). We were particularly interested in the effect of information placed directly in the interactive 3-D environment (e.g., information on water pollution appears upon interaction with a water fountain) verses embedded in flat Web 1.0 information products (e.g., clicking on a virtual library poster opens a Web 1.0 page via an in-world browser). Tasks also tested the ease of objects’ control, impact of non-educational VW features on user satisfaction, and the effect of social interactions and multitasking on users’ performance, among other things. Tasks also involved answering multiple-choice questions about information and objects location, such as in the following example:
Q: How does Tox Town define a “brownfield?”: a) Unused property scheduled for redevelopment; b) Open chemically burned space where no plants can grow ; c) Zones of a city where pollution is permitted.
Survey design
During the exercise, all participants had multiple opportunities to complete a survey that focused on dimensions of satisfaction in VW experience (based on Isbister & Schaffer, 2008), referred to throughout this document as the Satisfaction Survey. The survey questions incorporated Likert scales and participants were asked to rank how strongly they agreed or disagreed with statements about the VW.
The pilot varied two features of survey presentation, the mode (Web-based vs. in-world) and the trigger (static, pop-up on proximity, invitation by a facilitator). A Web-based version of the survey was accessible through a link from an invitational poster and also explicitly offered to participants by the facilitator. This version could be viewed from within the VW through the Second Life Web browser or outside the VW in another browser. An in-world version could be accessed by touching other copies of the poster. An invitational pop-up window for the survey also appeared in the vicinity of mushroom objects scattered through various virtual gardens.
Data capture and analysis
A lead usability expert watched users interact and interviewed team members who presented answers to him either through avatars appearing “in person” or through non-local, in-world text chat windows (voice communication via microphones was also attempted but soon abandoned owing to audio quality and bandwidth issues). Two additional observer avatars were present who followed participants and occasionally asked clarifying questions about their actions and statements. Records of each avatar’s text chats with other avatars were downloaded for later review. All Infothon sessions were video recorded with Morae software and reviewed after the sessions.
Performance
At the time of this research, no commercial services or tools were available to measure the performance of user-generated information applications on Second Life or other VW platforms. One of the complications of measuring application performance in Second Life is that a specific virtual “region” can be simulated by different computer servers over time. Changes in performance may reflect a change on the “simulator” and not necessarily changes to the user-generated content. We chose to focus on two performance indicators that reflect the performance of a specific simulated scene as perceived by its users: rendering time and accessibility. The first indicator is the rough equivalent to “page download time” on the Web, and the second is a measure of whether a particular simulation remains accessible to users over time. We developed proof-of-concept tools that could help us determine the feasibility of creating such monitoring capability for user-generated applications in Second Life. The performance evaluation tests were not performed concurrently with the Infothon
Our prototypes make use of the standard Second Life client and a text-based Second Life viewer (METAbolt). We used scripts to simulate a user logging in and viewing specific Second Life content once every 15 minutes for 24 hours. We approximated the rendering time by the time it took the Second Life client to download all the objects needed to render a specific scene, as determined by the contents of the viewer’s cache.
Usage
Linden Labs does not offer per-region usage statistics to subscribers, only some overall usage statistics of the entire Second Life platform. At the time of this research, few companies offered usage monitoring services to Second Life subscribers. The companies are Second Life subscribers themselves and are examples of the user entrepreneurship that the Second Life environment has enabled over the years. We tested the capabilities of one such company, Maya Realities (MR). The services offered by other companies were similar in nature. MR used the scripting capabilities available to users of the environment to enable “avatar detectors” that, after being strategically placed in the virtual region owned by the users of the MR service, report visitors and their locations to a central server on the Internet. The methods used by MR have some potential limitations mainly related to the product being implemented using user-level scripting capabilities in the Second Life environment.
MR produces summary usage reports that include the following data:
- Unique visitors
- Average visit duration
- Total time visited
- Charts depicting the above numbers on an hourly basis over an entire week
- Total number of visits
- “Heat maps” that graphically show the places users visited on the region for more than one minute, and locations where users entered “away” (inactive) state
Pilot Exercises: Results
The following sections discuss the results of this project: usability, user feedback, performance, and usage.
Usability
The following subsections discuss the pros and cons of multi-player quest, ability to obtain known usability metrics, and communication challenges, strategies during the session, and technical issues with recording and preparing data.
Pros and cons of a multi-player quest
The Infothon exercise succeeded in simulating “real-life” VW experience, characterized by multi-player interactions and complex navigational choices. However, administering and analyzing data from multi-user sessions proved challenging. While we anticipated not being able to follow each participant throughout the whole performance, we expected that frequent spot-checking, supplemented by video analysis, would suffice. However, as described in the subsequent sections, inferring participants’ intentions and attracting their attention with clarifying questions proved more difficult than in traditional usability studies.
Because interactivity and socialization are key to VW engagement, we continued seeing value in retaining the authenticity of the VW experience and conducting multi-user sessions. Improvements to our approach may include specifying the order in which tasks should be performed, providing participants with ways for indicating the beginning and the end of each task, and assigning separate moderators to teams or pairs of participants. Proposed techniques for improving the moderator’s ability to communicate with participants are described in a separate subsection, Communication challenges and strategies during the session.
Ability to obtain known usability metrics
The expert panel concluded that most traditional usability metrics, such as learnability, ease of navigation, efficiency, user satisfaction, and user errors were applicable and measurable in VWs. Table 4 summarizes specific component variables of these metrics and summarizes our findings about their ease of implementation in this exercise.
Table 4. Ease of Assessing Specific Traditional Usability Metrics in the Infothon
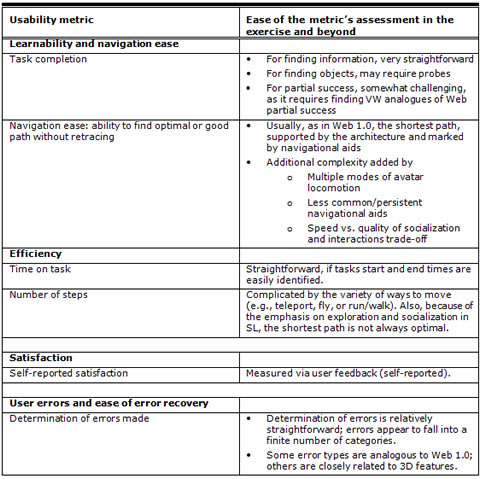
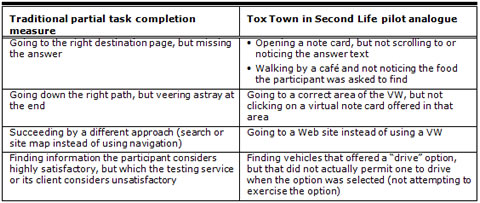
Traditionally, learnability and navigation ease are measured as a user’s ability to accomplish a task (task completion) and find optimal or near-optimal paths to desired information or an object without retracing. Evaluating task completion for information seeking in the exercise proved relatively straightforward: participants succeeded if they obtained the correct answer to a question. Evaluating successful completion for finding objects was slightly more complex, as the moderator did not follow every participant, probing questions were necessary to verify success. Judging partial success proved more difficult than in Web studies, where it is defined as (a) going to the right destination page but missing the answer or (b) going down the right path but veering astray at the end. As avatar movement in VWs is a continuous flow rather than a sequence of discreet steps, it was often difficult to determine whether participants passing by a relevant location were overlooking it or ignoring it. Table 5 provides examples of partial task completion in Second Life, as compared to the traditional Web.
Table 5. Second Life Analogues of Traditional Measures of Partial Task Completion
In traditional Web usability, navigation ease is usually measured as users’ ability to find the shortest path to the destination, using their understanding of the site’s architecture and navigational aids (e.g., menus). The exercise brought to our attention three factors that added complexity to evaluating navigation in VWs:
- The first was the variety of ways to move about Second Life: users could teleport, fly, or run/walk. If the optimal path is viewed as being the shortest path to the information, then teleporting directly to the information object is more desirable than flying; and, flying is then more desirable than running/walking. While this hierarchy provides an easy to score metric, it fails to address potential advantages of slowing down (e.g., exploration of the VW environment and/or looking for social contacts to interact).
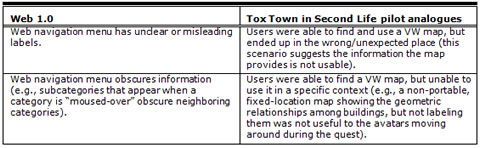
- The second complicating factor was that compared with Web 1.0, navigational aids are less common and often do not persist from one scene to another. For example: Tox Town in Second Life has a billboard with a town map on the main square, but the map cannot be picked up and carried around. Our evaluation of the navigational paths, therefore, largely focused on the placement and helpfulness of navigational aids. Table 6 presents Second Life analogues of Web 1.0 problems with navigational menus, identified in our pilot.
- The third complicating factor was the importance of social interactivity and user satisfaction in VWs. In some situations, the optimal path may not be the shortest, but the one that leads to the most interesting, interactive, satisfying “travel” experience.
Table 6. VW Analogues of Web 1.0 Navigational Aids Problems
Efficiency, or the ability to accomplish tasks with minimal effort, is closely related to ease of navigation. In Web 1.0, efficiency is typically measured as time on task and number of steps (clicks) leading to completion. As suggested earlier, taking the shortest, fastest path is not always optimal in VWs. When efficiency is desirable, however, measuring it as time on task is straightforward, unless participants are multi-tasking. Assessing the number of steps in the continuous flow if the VW experience is more challenging, due to the variety of ways to move about a VW: teleport, fly, or run/walk.
User errors are behaviors that lead to task failures of two kinds: (a) incorrect assumption of task completion and (b) user confusion and/or frustration. In our exercise, incorrect assumptions of success were rare. Errors leading to confusion fell into several distinct categories. One involved encountering the relevant information source (opening a note card), but failing to locate the information. Another was searching for information in the wrong places. These difficulties were closely related to the effect of the 3-D space and the physical space metaphor of the town. Information in Tox Town in Second Life is distributed among physical objects and “traditional” information resources. For example, information about a water pollutant chemical may be found in the Tox Town in Second Life environment upon interaction with a water fountain, as well as on a Web poster in the library. Users were much more likely to attempt to utilize the physical space metaphor and search for information in objects, rather than information products. If a seemingly relevant object or place did not exist or did not contain desired information, this led to confusion. Yet another error category was similarly related to the town space metaphor and included walking into doors that were not open, getting “stuck” behind virtual objects, etc. The exercise suggests that user errors, identified in VW usability studies, are highly informative for the design of virtual environments.
Communication challenges and strategies during the session
VW interactions typically involve simultaneously managing many streams of synchronous and asynchronous communication with multiple avatars. Communication modes in Second Life include voice and local text avatars in close proximity, and non-local instant messaging for avatars at a greater distance or for private communication (local chat is visible to all nearby). The high demand that Second Life places on users’ attention impacted both communications with the moderator and the interactions among the participants. Participants and the moderator often had multiple chat tabs open on their screen. Periodically, the moderator would pose a question and not receive a response, either because the question would display in a hidden tab or because the participant was preoccupied. Similar failures to connect were happening among the participants. For the second of the two usability sessions, the problem was solved by creating chat groups, which reduced the number of communication tabs each participant needed to control—a solution we would recommend.
A special case of communication involved the moderator’s interviews with participants about the answers to the quest questions, conducted via text chat. In an attempt to make the process more efficient, the moderator had created chat macros (customized text created as “gestures” in Second Life) with pre-entered interview questions, which were triggered by keywords. The strategy was effective, although some questions required real-time modifications and qualification. To avoid accidentally activating a macro in the course of spontaneous conversation, we recommend using uncommon words as triggers. Another limitation involved Second Life’s limit on the length of chat text charters on one line that caused some questions to be split. Sometimes, portion of a question vanished from the local chat before they could be read.
Technical issues with recording and preparing data
Technologies originally created for conducting evaluations of Internet sites present their own challenges for conducting user research in VWs. Our screen recording and screen event tracking tool, Techsmith Morae, was not originally designed for testing in VWs. As such, it exhibited several limitations:
- Recording files in Morae’s proprietary format, already large and cumbersome for Web studies where page content remains the same for minutes at a time, increased in size by an order of magnitude to keep pace with the fast paced actions of avatars on screen. Analysis of the resulting video in Morae Manager on all but the highest end computers became painfully slow. We therefore recommend saving or converting recordings to a more manageable video format and viewing the recordings in conjunction with an exported time-coded notation log.
- Because Morae cannot see inside the Second Life browser window, it cannot track browser events as it can in a browser like Internet Explorer. Users must click to an external link in another browser for Morae to register any activity.
- Keystroke tracking, though useful for tracking search strings on Web sites and unaffected by the browser in use, was not an effective means of recording participant chats as each keystroke appears on a separate line. We recommend instead having each user configure the VW browser to record text chats before interaction with other avatars begins. We recognize that while chat log recorders in certain VWs (like There) record all keystrokes, those in other VWs (like Second Life) record only what is actually sent to other avatars.
User Feedback
The following sections discuss focus groups and employing opinion surveys to assess user feedback.
Focus groups
The discussion during the post-activity, in-world focus group was extremely lively. The discussion occurred via text messaging, with no communication delays or difficulty obtaining participants’ attention. Based on this pilot exercise, we recommend in-world focus groups as method for capturing user feedback.
Employing opinion surveys
The Web-based and the in-world survey formats collected a similar number of responses (10 for the Web survey and 11 for the in-world version). Given the small sample, we did not attempt to collect data on the preferred invitational format (pop-up vs. posters and signs). Some participants expressed annoyance at receiving multiple pop-up invitations while they were engaged in other VW activities. These participants expected the invitations to desist once they had either accepted or refused the invitation. It may be possible to increase participation by placing in-world survey invitations at likely destination points rather than en route to destinations.
Overall, participants did not experience difficulties with the opinion survey. However, comparing survey results for the in-world and the Web versions suggests the need to further explore the effect of survey medium, trigger, and timing on reported satisfaction. On five out of seven questions about the ease of Tox Town in Second Life, mean responses were more positive for the in-world version. The small sample size and uncertainty about the actual number of survey-takers prevent us from any conclusive interpretation of the situation. Possibly, completing the surveys in-world felt more like part of the Second Life experience, while transferring to take the survey in a Web browser outside of the VW created more distance and a more critical outlook. It is also possible that the disparity has to do with the place and time, rather than the medium of the survey. Until we better understand the influences of the medium, trigger, and timing on satisfaction, it may be advisable to standardize these variables in evaluations.
Performance
The application performance experiments were not conducted during the Infothon, but at a later date. To run our experiments, we chose a VW scene that had multiple textures with textual and graphical information resembling an exhibit hall. Our prototype performance monitoring software reported an average of 114 seconds to render the specific Second Life scene used during the duration of the experiment. These times varied from 95 to 155 seconds. No real connectivity problems occurred during the testing phase, but our tool was able to report simulated connectivity failures and VW platform down times. To emulate the type of performance monitoring service performed by firms like Keynote, Inc., or Gomez on the Web, a more elaborated version of our tools could run in a number of computers across the Internet and the measured results be reported to a central location for reporting and alerting when undesirable performance, based on baseline measurements, is detected. This way, application developers on the Second Life platform could have a way to monitor the average time it takes users to access their content, evaluate the impact of content changes on user experience, and determine how reliably the platform keeps the content accessible to users. One of the potential problems of this approach is that it’s not possible to reliably test the same scene from different locations at the exact same time. For example, a single avatar cannot be used to do the testing at the same time from multiple computers, and even if different avatars are used they may interfere with each other during the rendering of the scene.
Usage
Maya Realities sends its paying Second Life clients a weekly usage report via email every Sunday. They reported 248 avatar visits from 73 unique visitors to the Tox Town in Second Life region during the week of the Infothon. These numbers are larger than the number of avatars used for the usability exercise, but can be explained by the fact that the increased avatar activity on the region attracted other avatars to the island. It is common in Second Life that users tend to visit regions that show more activity on the Second Life maps (crowds attract more people). The usage statistics also show that the average visit duration was 91 minutes, for a total of 111 hours of combined use time of the region. See Figure 5 for the heatmap of the region for that week and Figure 6 for a chart of the total number of minutes per day spent by visitors to the region during that week (the Infothon took place on November 18, 2009). The Maya Realities Web site allows access, via a private user ID and password, to detailed daily and hourly usage statistics. The statistics reported during the hours of the Infothon were consistent with our observations during exercise. Therefore the data provided by this commercial service reflects the actual use of the virtual space. However, the actual use that the avatars make of the information content in the virtual world is not captured.
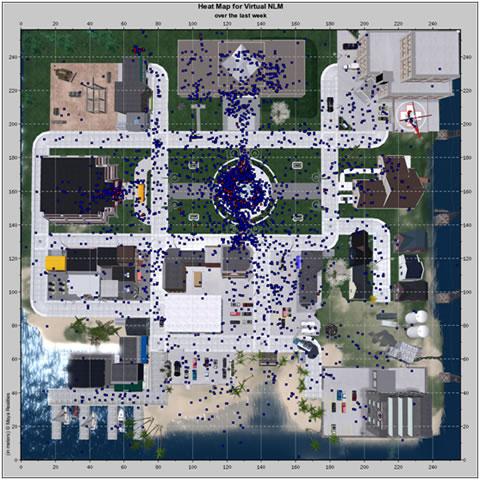
Figure 5. Maya Realities’ Virtual NLM heatmap during week of Infothon: Every blue point represents an avatar position every minute; red dots represent avatars staying inactive in the same location for more than 10 minutes.
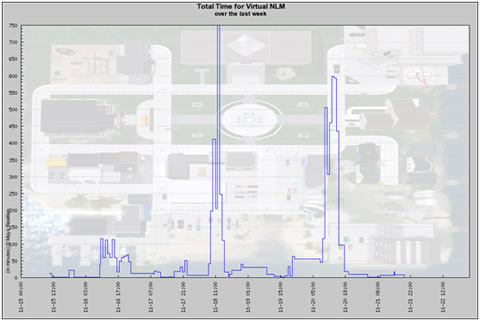
Figure 6. Number of minutes spent by all visitors on Virtual NLM region during the week of the Infothon
Conclusions
This project suggests that using Web 1.0 evaluating methods for Internet performance, usage, usability, and user feedback in Second Life is possible and can produce useful results. Pilot testing verified that many Web 1.0 metrics (or measurable variables) are either directly applicable to Second Life (e.g., user satisfaction) or have Virtual World analogues (e.g., number of interactions with an object vs. a number of clicks). Most Web 1.0 methods for measuring the variables are also applicable to Second Life.
While most methods and metrics are applicable, their application requires some modification. Of the four evaluation dimensions that we have reviewed, translating assessment of user feedback is the most straightforward, while the others are considerably more challenging. Some challenges have to do with the relative youth of the VW platforms, reminiscent of the early days of the Web, before universal interface design principles, standardization of user expectations, and proliferation of commercial assessment tools and services. Others are related to the complexity of 3-D topography and the complex, social nature of the experience. Compared to Web 1.0, Second Life experience, even in educational and informational regions, is less about the shortest path to the information and more about engagement, socialization, and exploration. The influence of socialization on the experience needs to be better understood, as a positive force that needs to be harnessed in service of the user and as a variable that needs to be controlled.
While suggesting that evaluation of Second Life applications is feasible and potentially informative, this project also tells a story of many successful and some unsuccessful adaptations of Web 1.0 evaluation methods. We hope that these will serve as useful tips for usability practitioners venturing into virtual worlds, as well as contribute to defining the researchers’ agenda on assessing user experience in virtual worlds and identifying new variables that affect this experience.
References
- Bakera, S. C., Wentza, R. K., & Woodsa, M. M. (2009). Using virtual worlds in education: Second Life® as an educational tool. Teaching of Psychology, 36 (1), 59 – 64.
- Betterverse.org. What the US government is doing in Second Life. Retrieved on October 27, 2010, from http://www.betterverse.org/2009/09/federal-government–in-second-life.html
- Boulos, M. N., & Maramba, I. (2009). Pitfalls in 3-D virtual worlds health project evaluations: The trap of drug-trial-style media comparative studies. Journal of Virtual World Reseach , 2 (2), 4-6.
- Cacas, M. (2010, May 14). Feds expand virtual worlds use. Retrieved October 26, 2010, from 1500 AM Federal News Radio: http://www.federalnewsradio.com/?sid=1957088&nid=35
- Freitas, S. d. (2008). Serious virtual worlds. A scoping study. JISC , JISC e-Learning Programme. UK: Serious Games Institute.
- Isbister, K, & Schaffer, N. (Eds). (2008). Game usability: Advancing the player experience. Burlington, MA: Morgan Kaufmann.
- Jaeger, B. (2009, May 31). What educational activities fit virtual worlds: Towards a theoretical evaluation framework, in E Chang and Damiani, E. & Hussain, F. K. (eds), 3rd IEEE International conference on digital ecosystems and technologies (IEEE DEST2009; pp. 713-718) Istanbul, Turkey. IEEE Industrial Electronics Society.
- Palfrey, J., & Gasser, U. (2008). Born digital: Understanding the first generation of digital natives. New York, NY: Basic Books.
- Pellerin, C. (2007, May 08). U.S. government presence grows in Second Life online world. Retrieved October 26, 2010, from America.Gov: http://www.america.gov/st/washfile-english/2007/May/20070508163536lcnirellep0.2645075.html#ixzz13W0ueCNl
- Williams, R., Gütl, C., Chang, V., & Kopeinik, S. (2009). Evaluation of collaborative learning settings in 3D virtual worlds. International Journal of Emerging Technologies in Learning, 4 (3), 6-17.
- Wood, F. B., Siegel, E. R., LaCroix, E.-M., Lyon, B. J., Benson, D. A., Cid, V., & Fariss, S. (2003). A practical approach to e-government Web evaluation. IT Professional , 5 (3), 22-28.
- Wrzesien, M., & Raya, M.A. (2010). Learning in serious virtual worlds: Evaluation of learning effectiveness and appeal to students in the E-Junior project. Computers in Education, 55(1), 178-187.