
pp. 111 – 123
Abstract
The goal of this study was to examine the usability of a laptop, communicator, and handheld computer using test subjects and questionnaires. The study aimed to determine how user-friendly and ergonomically correct these devices are. The subjects (25) had 5 minutes to perform typing or calculation tests with each device. While the subjects performed the tasks, an observer monitored the subjects’ work posture. After the tasks were completed, the subjects completed questionnaires about the usability of each device Based on the subjects’ experiences, the handheld computer and laptop had better ergonomic characteristics than the communicator. Subjects felt the highest amounts of stress in their neck while working on the laptop, subjects felt stress on their backs while working on the communicator, and they felt stress in their eyes while working on the handheld computer. Subjects performed the typing tasks best using the laptop. Our research suggests that companies developing mobile devices should consider ergonomic issues and the ergonomic differences between different types of mobile devices to further improve user satisfaction.
Practitioner’s Take Away
The following were the main findings of this study:
- Usability of laptops, communicators, and handheld computers can be determined by combining observations of subjects’ work posture, tests on how well subjects complete tasks, questionnaires on subjects’ perceptions of ergonomic design, and questionnaires on how subjects’ physically felt while using the devices.
- Most stress caused by these devices can be felt in a person’s back, upper limbs, and eyes.
Introduction
In recent years, the use of different technical equipment has increased. According to the Finnish statistical office in 2007, 37% of households used portable computers and 76% of households used home computers (Statistical Finland, 2008). In spring 2007, nearly four out of five Finns (79%) aged 15 to 74, or over three million persons, used the Internet. Seventy-five percent of the population used the Internet at least once a week. Nearly all people under 40 years old used the Internet in Finland (Statistical Finland, 2007a). In Finland the use of the Internet and computers is higher than in other countries in the European Union. However, in other Nordic countries the use of the Internet is higher than in Finland (Statistical Finland, 2007b).
The first handheld computer came to the market about ten years ago and the demand for the product has been increasing ever since (Shah, 2001). There are multiple programs that can be downloaded from the Internet and most of them are free of charge. The medical industry is an example of an industry that is extremely well suited for handheld computers (Adatia & Bedard, 2003; Embi, 2001; Harris, 2001; McCombs, 2003; Torre & Wright, 2003; Wilkinson, 2001). Handheld computers make patient care even more efficient because it is possible to do medical calculations, check the ICD-10 codes, write prescriptions, and check the patients’ data with a handheld computer (Larkin, 2001).
People often use mobile devices (e.g., laptops, handheld computers, and communicators) in different situations than traditional desktop computers, and the usability questions for mobile devices are different than the usability questions for desktop computers. The International Ergonomics Association (IEA) Council has adopted an official definition for usability: The scientific discipline concerned with the understanding of interactions among humans and other elements of a system, and the profession that applies theory, principles, data, and methods to design in order to optimize human well-being and overall system performance (IEA, 2000). The ISO 9241-11 standard determined that the usability of a product describes how well users can use products gainfully, effectively, and pleasantly to get defined objectives in a certain environment (ISO 9241-11, 1998).
There have been many studies about the usability of desktop computers or portable computers (Adatia & Bedard, 2002; Adatia & Bedard, 2003; Berner & Jacobs, 2002; Jalil & Nanthavanij, 2007; Moffet, Hagberg, Hansson-Risberg, & Karlqvist, 2002; Zecevic, Miller, & Harburn, 2000) and many studies that describe what a laptop should be like (Griffin & Kahan, 1999; Kelaher, Nay, Lawrence, Lamar, & Sommerich, 2001; Larkin, 2001; Straker, Jones, & Miller, 1997). Griffin and Kahan (1999) gave ergonomic guidelines on how to set up a laptop computer so that users would be comfortable using a laptop keyboard. The setup guidelines are very similar to how you would use a desktop computer keyboard (elbows at about 90 degrees, wrists level and upper arms hanging as vertically as possible). They suggested that people should try to use a chair that does not have arm rests so that they will have room to move their arms when looking down at the screen; they suggested that people should be careful not to bend their neck and head forward; and they suggested that people should try to tuck in their chin to look down, keeping the head and neck more or less balanced over the spine. According to Pitkänen (2002) if one uses a laptop for long periods of time it is good to have a detached screen, keyboard, and mouse to prevent stress on one’s neck and back.
In Hong Kong, Szeto and Lee (2002) compared typing postures between a desktop computer, a laptop, and a handheld computer. There were 25 subjects between 20 to 24 years old. The result of this study was that computer users should remember to observe their working postures so they will not have any problems with their spine.
This study examined the usability of mobile devices—laptops, communicators, and handheld computers—using test subjects, observation, and questionnaires. Subjects completed typing and calculation tasks while an observer monitored their posture looking for body-stress issues. After the subjects completed their tasks, they were given a questionnaire that asked how they physically felt while using each device. The goals of this study was to determine (a) if the devices were easy to use based on how fast and accurate the subjects typed and how accurate their calculations were and (b) if the devices were comfortable to use based on the subjects’ questionnaire answers and posture observations and comparisons to physical load tables.
Methods
The following sections discuss the subjects, the test environment and tasks, the questionnaires, the observation of the subjects’ work posture, the protocol, and the data analysis used in this study.
Subjects
The subjects were students and personnel of universities recruited by an open advertisement. All willing persons were included in the study. There were 25 subjects, 14 (56%) females and 11 (44%) males. The oldest was 48 and the youngest was 20. Over half of the subjects were between 20 and 24, but there were also three over 40. The medium age of the subjects was 26.7. The age and sex distributions for the 20 to 24 age group were nine females and five males, for the 25 to 29 age group there were two females and four males, for the 30 to 34 age group there were one female and one male, there were no subjects in the 35 to 39 age group, and there were two females and one male in the 40 or over age group. Eleven of the subjects wore eyeglasses. After the researcher presented the study, they signed voluntary written consent (agreement) forms before the tests started.
Test environments and tasks
The test devices were an HP XE3 laptop, a Nokia communicator 9110, and a Palm Tungsten T handheld computer. There was similar illumination in the room for each device. All devices were on a similar table and in a similar position. Figures 1, 2, and 3 show the test environments for each device (laptop, Figure 1; communicator, Figure 2; and handheld computer, Figure 3).
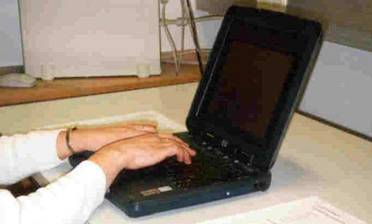
Figure 1. The test environment for the laptop
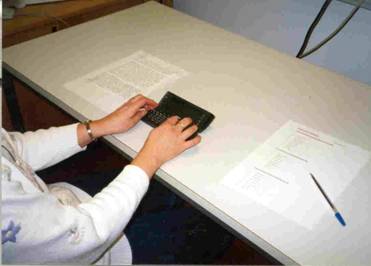
Figure 2.The test environment for the communicator
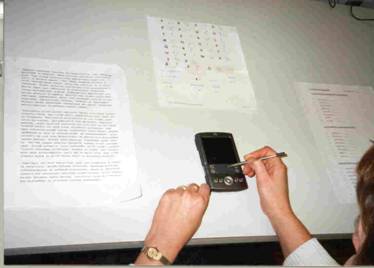
Figure 3. The test environment for the handheld computer
The usability of each device was evaluated based on a writing task and calculating tasks completed by the subjects. The calculating and typing tasks were secured to the table beside each device. The writing task for the handheld computer used Graffiti letters because it was easier to write with them. The models of these letters were secured to the table above the handheld computer. The subjects were given a different typing task for each device. The tasks were taken from the book by Kettula (1988). In general, the same Finnish text was used when the subjects’ speed of writing was analyzed. After the typing task, the subjects completed eight calculations.
Questionnaires
The research material consisted of five questionnaires. The first questionnaire (Q1) included questions on background information. After using each device, the subjects were asked some questions about that specific device. Three questionnaires included questions on the usability of the devices (laptop [Q2A], communicator [Q2B], and handheld computer [Q2C]). After the subjects had completed all of the tasks, they answered a questionnaire (Q3) where they were asked to compare the devices. Questionnaire Q3 contained the same scale points, but also contained a section where subjects could provide open feedback and observations. Experienced instructors designed the questions for the questionnaires based on principles published in ergonomic instruction literature.
Observation of the subjects’ work posture
At the same time the subjects were testing the devices, an observer (researcher) was analyzing the subjects’ work posture using the table of physical loading by Andersen and Bjurvald (1994). The same person observed and recorded her findings for all of the subjects. There was only one test subject in a room, and the subject did each phase of work (see Figures 1 through 3) sequentially. (Figure 4 presents a timeline for the study.)
Protocol
After the subjects entered the room, they were introduced to the study protocol. They had 10 minutes to acquaint themselves with the devices. Then they were asked some background information (Q1). Figure 4 shows the timeline of the study.
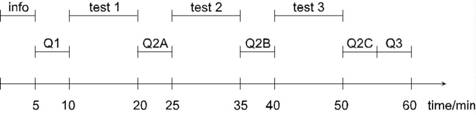
Figure 4. The timeline of the study: laptop = test 1, communicator = test 2, and handheld computer = test 3; Q1 = questionnaire 1, Q2A= questionnaire 2A, Q2B= questionnaire 2B, Q2C= questionnaire 2C, and Q3= questionnaire 3
The subjects started the test with the laptop, then they tested the communicator, and finally they tested the handheld computer. The test order for the devices was based on how well known a device was. The tests started with the most well known device (laptop) and finished with the least known device (handheld computer). For each test, subjects were given five minutes to complete a typing task. The typing tasks were different for each device test. After each typing task, they had five minutes to complete eight calculations on each device. After each device test, subjects answered questionnaires (Q2A, Q2B, and Q2C). After they had completed all tasks, they answered the Q3 questionnaire.
Data analysis
Data from the questionnaires and the observations from the observer (researcher) were entered into a computer. The questionnaires also contained a section for providing open answers—feedback and observations. These were carefully read through and examined to see whether there were some valid points, any valid points were typed into the computer. Microsoft Excel was used to study the data.
The subjects evaluated the devices on the questionnaires using the following scale:
- 1= very much stress
- 2= fairly much
- 3= pretty much
- 4= pretty little
- 5= very little stress
After the evaluations, we discovered a possible bias that some subjects may have placed a higher importance on the higher number (5), so we changed our scale as follows. (There is a more complete description of this change in the “Evaluation of methods” section in this paper.)
- 1 = very little stress
- 2= pretty little
- 3= pretty much
- 4= fairly much
- 5= very much stress
For the typing portion of each test, we registered the length of the written text and any typing errors made by subjects (e.g., wrong letter, missing space, and small letter when it was supposed to be a capital letter). All typing errors for a single device were summed together and then compared with the errors of the other devices. For the calculation portion of each test, we registered the calculation errors made by subjects. All calculation errors for a single device were summed together and then compared with the errors of the other devices. The statistical analyses for the typing tests and calculation tests were done using PASW Statistics 18 (formerly known SPSS Statistics). The differences were tested using nonparametric tests, Friedman’s 2-way ANOVA by ranks (3 samples).
Results
The following sections discuss the results of the subjects’ background information, the subjects’ experiences, the observation of the subjects’ work posture, and the typing and calculating tasks.
Background information of the subjects
Before this study, two of the subjects used laptops and communicators daily. One subject used a handheld computer daily. In addition, 24 (96%) of the subjects had at some point tested the laptop, 12 (48%) subjects had tested the communicator, and eight (32%) had tested the handheld computer.
Subjects’ experiences
All subjects (25) answered five questionnaires. Some of the questionnaires had sections where subjects could answer open questions, but not all subjects answered those open questions.
The subjects answered the question “How ergonomic were the devices (laptop, communicator, and handheld computer) in your opinion?” The scale was from 1 to 5. For the laptop, they answered as follows: 4 (16%) very poorly, 3 (12%) pretty poorly, 10 (40%) fairly, 8 (32%) pretty well, and 0 very well. For the communicator, they answered as follows: 8 (32%) very poorly, 12 (48%) pretty poorly, 3 (12%) fairly, 0 pretty well, and 2 (8%) very well. For the handheld computer, they answered as follows: 1 (4%) very poorly, 4 (16%) pretty poorly, 13 (52%) fairly, 5 (20%) pretty well, and 2 (8%) very well.
Figure 5 shows the data about question two: “Did you feel any stress in any part of your body when working with the devices?” Again, the scale was from 1 to 5, with 1 = very little stress, 2 = pretty little, 3 = pretty much, 4 = fairly much, and 5 = very much stress. For the laptop, subjects felt the most stress on their necks (average 3.0), then their backs (average 2.9), and then their shoulders (average 2.8). For the communicator, subjects felt the most stress on their backs (average 3.5), then their fingers (average 3.3), and then their eyes (average 3.1). For the handheld computer, subjects felt the most stress in their eyes (average 2.7), then their wrists (average 2.6), and then their backs (average 2.6).
Figure 5. The distributions and averages for the question: “Did you feel any stress in any part of your body when working with the devices?”
One person did not answer the question (Figure 5) and two others did not experience any stress using any of the devices. For the rest of the subjects, their answers indicated that when working with the laptop they felt the highest amount stress in their neck (fairly much), the second highest was in their back, and the third highest was in their shoulders. They felt the lowest amount of stress in their feet and the second lowest in their fingers.
Two of the subjects did not experience any stress on any body part when working with the communicator. For subjects that felt stress with this device, the highest stress was felt in their back (pretty much), the second highest stress was felt in their fingers, and the third highest stress was felt in their eyes. Subjects felt the lowest amount of stress in their feet and the second lowest amount of stress in their arms.
Four subjects did not experience any stress on any part of their body while working with the handheld computer. For subjects that felt stress with this device, the highest stress was felt in their eyes (fairly much) the second highest was felt in their backs, and then their wrists.
Over half of the subjects (56%) thought that writing with the laptop was pretty easy, and 36% of the subjects thought that writing with the communicator and with the handheld computer was pretty difficult. Almost half of the subjects (48%) thought that it was pretty difficult to calculate using the laptop. They thought calculations using the communicator were fairly easy (36%) and calculations using the handheld computer were very easy (60%).
Observation of the subjects’ work posture
The following sections describe the observations of the subjects’ work posture while using the laptop, the communicator, and the handheld computer.
Laptop
The observations of the observer (researcher) indicated that the majority of the subjects (68%) worked in such a position that their neck was at a 15 to 45 degree angle. In that position there was some degree of stress. Eleven subjects also had some degree of rotation in their neck. Thirteen subjects (52%) had only a little stress in their back.
The angle of the arm was pretty good. Only three subjects had very much stress in their arms. Eight subjects had some degree of stressing positions. The researcher made similar observations while subjects worked on the calculation portion of the tests.
Communicator
Fourteen subjects (56%) had very much stress in their back and nine (36%) had some degree of stress when working with the communicator. The positions of their arms were only a little stressful in almost all subjects (92%). The position of their backs was somewhat stressful for nine subjects (36%) and very stressing for eight subjects (32%). The researcher made similar observations while subjects worked on the calculation portion of the tests.
Handheld computer
Seventeen subjects (68%) had very much stress in their neck and six subjects (24%) had some degree of stress when working with the handheld computer. Ten of the subjects (40%) had very much stress in their arm when they worked with the handheld computer. All other subjects had only a little stress in their arms. Eleven subjects (44%) had very much stress in their back and nine subjects (36%) had somewhat stress. Subjects did the calculations in the same position as they typed.
Typing and calculating tasks
The subjects (25) wrote altogether 19,734 letters and made 45 typing errors (2.3 errors/1,000 letters) with the laptop. Everybody completed the typing task. The subjects made altogether 164 calculations with the laptop. Ten subjects completed all eight calculations within the given time. One person completed only two. The highest number of calculation errors/subjects was five.
With the communicator, the subjects wrote altogether 9,153 letters and made 62 errors (7.3 errors/1,000 letters). The subjects correctly completed 188 calculations (7.5/subject) with the communicator.
With the handheld computer, the subjects wrote 2,668 letters and made 31 errors (14.1 errors/1,000 letters). The subjects completed 186 (7.4/subject) calculations with the handheld computer.
The results for different devices were analyzed using nonparametric tests, Friedman’s 2-way ANOVA by ranks (3 samples, Table 1). The null hypotheses were rejected based on the following factors: (a) the distributions of typing characters for the laptop, the communicator, and the handheld computer were the same (Sig =0.000); (b) the distributions of typing errors for the laptop, the communicator, and the handheld computer were the same (Sig =0.004); and (c) the distributions of correctly calculated exercises for the laptop, the communicator, and the handheld computer were the same (Sig =0.011). The null hypothesis for the distributions of calculation errors for the laptop, the communicator, and the handheld computer were the same (Sig =0.097) so it was not rejected. Table 1 shows the pairwise comparisons for typing characters, typing errors, and correctly calculated exercises, which we could analyze based on the testing of null hypotheses.
Table 1. The results of pairwise comparisons for typing characters, typing errors, and correctly calculated exercises of different devices using Friedman’s 2-way ANOVA (Adj.Sig = Asymptotic significances, Std.Test.Statistic = standard test statistics)
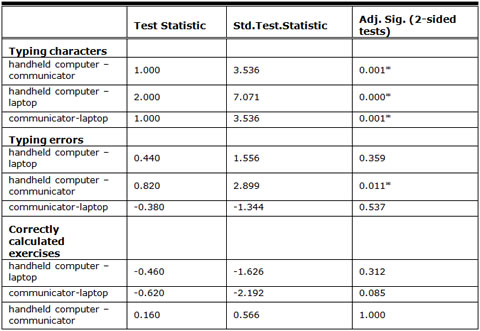
* p<0.05
Table 1 shows that the differences between typing characters in all pairs were significant (p< 0.05). Asymptotic significances (2-sided tests) were displayed. The significance level was 0.05. Differences between typing errors were significant in pair communicator-handheld computer. For the calculation test, the differences of correctly calculated exercises were not significant.
Discussion
The following sections discuss the evaluation of methods and a comparison between devices.
Evaluation of methods
In recent years the use of laptops, communicators, and handheld computers has increased. The three mobile devices are quite different, but people often do the same tasks with them. We thought that the laptop is a well known and quite general device so we used it to compare to the other devices. The laptop is larger and heavier than a communicator and handheld computer. If workers can do the same tasks with communicators that they can do with laptops without ergonomic problems, then they do not need to carry a laptop with them, for example, on the trips.
We did not randomize the devices for participants because we wanted to start with the most well known device—the laptop. We thought that starting the tests with the most familiar device (laptop) would help put our subjects at ease. Our results show that it was easier for subjects to type using the laptop (fewer typing mistakes per subject), but harder to make calculations on the laptop (subjects did not complete all of the calculations). Calculations were easier to complete using the handheld computer and the communicator, but typing tasks were harder to complete using these devices (higher typing mistakes per subject).
The length of one typing test or calculation test was only 5 minutes, which is quite a short time. However, because each subject completed six tests and answered five questionnaires the time could not be longer. Longer testing sessions can cause test fatigue.
We did not videotape the subjects because we felt it could influence the test situation and possibly cause the subjects to make more errors. However, it would have been easier to analyze the subjects’ work posture if we had videotaped the test sessions.
As with all tests performed with human subjects, each person brings his or her own biases, interpretations, and experiences that can influence how the usability of a device is rated and how ergonomic-based questions are answered. Also, some subjects may not understand the questions in the same way. For example, the word “ergonomic” can have a variety of meanings for different people. We did, however, give the subjects a research notice describing the test situation before tests, but it did not specifically include a description of the term “ergonomic.” We also felt that it was possible that our subjects may have interpreted the original scale incorrectly because often the larger number (5) is the most severe of the options. (The original scale was from 1 to 5, with1= very much stress, 2= fairly much, 3= pretty much, 4= pretty little, and 5= very little stress.) We decided to remedy this mistake in the analysis portion of our research by reversing the order of the scale, i.e., 5 = very much stress, 4 = fairly much, etc.
The 25 subjects were quite young, which may have affected our results. The results may be different if the subjects were older. However, our comparisons were based on only these subjects so the age of our subjects would not be a very important factor. Also, this age group often represents the potential users for these devices.
Another factor that might have influenced the results was the size of our test group. A larger group may have provided different results.
Comparison between devices
Our test results revealed that the subjects felt that the handheld computer and laptop had a better ergonomic design than the communicator. For all devices, our researcher observed a work posture that placed most of the stress load on subjects’ backs. In addition, all devices placed some work load stress on some parts of subjects’ upper limbs. The communicator and the handheld computer caused stress in the subjects’ eyes, which is easy to understand because communicators and handheld computers are quite small and the text is quite small too.
In addition, based on the question “Did you feel any stress in any part of your body when working with the devices?” subjects felt the laptop caused the most stress on their necks as compared to the other devices. Subjects felt the communicator caused the most stress on their backs as compared to the other devices. Moffet et al. (2002) mentioned in their conclusion that greater physical (muscular and articular) constraints seem to be imposed on the head-neck and wrist segments in laptop situations.
In the typing tests, the subjects wrote most with the laptop and least with the handheld computer. Using the Friedman’s 2-way ANOVA differences between all pairs (laptop–communicator, laptop-handheld computer, and communicator-handheld computer) were significant (p < 0.05). However, the laptop was most well known to subjects, so this could have influenced the results. In the calculation tests, the differences were not significant. Due to technical difficulties three subjects had to complete the writing test with the handheld computer, but their data does not differ from the common trend.
In our study, the subjects used the devices on tables. In general, people work with mobile devices in a variety of places and positions. For example, when a person travels a table might not be available so that person would use the mobile device in his or her lap. It is possible that the results of this study could be different if other environments were tested. In the future it would be interesting to study the same devices in different work environments and situations. Stress was highest with communicator and handheld computer, and lowest with laptop. The usability was vice versa, and thus usability and stress can be combined to be correlated. This could be one research area to develop in the future.
Recommendations
When using the laptop, the communicator, or handheld computer, a person’s work posture can place a lot of stress in the back, in some parts of the upper limbs, and in the eyes. Therefore, those devices should be developed so that they are more ergonomically correct for a person’s back, upper limbs, and eyes. The usability of these devices should be further studied during their development process.
Conclusion
In conclusion, it can be stated that 72% of the subjects mentioned that the laptop was fairly or pretty well ergonomic, 12% mentioned that the communicator was fairly ergonomic, and 80% mentioned that the handheld computer was fairly or more ergonomic. Based on the subjects’ experiences, the handheld computer and the laptop were more ergonomic than the communicator. When using the laptop, our researcher observed that the subjects’ work posture placed the most stress load on the neck, back, and shoulders. When using the communicator, our researcher observed that the subjects’ work posture placed the most stress load on the back, fingers, and eyes. With the handheld computer, our researcher observed that the subjects’ posture placed the most stress load on the eyes. In the typing tests, the subjects wrote more with the laptop than with the other devices. The differences of typing characters were significant. However, our analysis was based on only the 25 subjects’ tests. In the future it is important to take into account ergonomic issues and the ergonomic differences of mobile devices, e.g., laptop stresses a person’s neck most and the communicator stresses a person’s back most.
References
- Adatia, FA., & Bedard, PL. (2002). Palm reading: 1. Handheld hardware and operating systems. Canadian Medical Association Journal,167(7), 775-780.
- Adatia, FA., & Bedard, PL. (2003). Palm reading: 2. Handheld software for physicians, Canadian Medical Association Journal, 68 (6), 727-734.
- Andersen, V., & Bjurvald, M. (Eds.) (1994). Vägar till färre arbetsskador – utveckling av nordisk ergonomitillsyn (Ways to less work-related injuries-development of Nordic ergonomic supervision), Stycke 4 (Chapter 4, pp. 514, 21-31), Nordiska Ministerrådet (Nordic Minister Council), TemaNord.
- Berner, K., & Jacobs, K. (2002).The gap between exposure and implementation of computer workstation ergonomics in the workplace. Work,19 (2), 193-209.
- Embi, PJ. (2001). Information at hand: Using handheld computers in medicine. Cleveland clinical journal of medicine, 68, 10.
- Griffin, V., & Kahan, N. (1999). Guidelines for lap top computer users. Retrieved September 10, 2008, from The RSI Network, 40 (http://www.tifaq.org/articles/laptop_guidelines-aug99-griffin&kahan.html).
- Harris, M. (2001). Handheld computers in medicine: The future is not here yet. Cleveland clinical journal of medicine, 68, 10.
- International Ergonomics Association (IEA) Council. (2000). What is Ergonomics. Retrieved September 10, 2008, from (http://www.iea.cc/browse.php?contID=what_is_ergonomics).
- ISO 9241-11:1998 (International Organization for Standardization). Ergonomic requirements for office work with visual display terminals (VDTs). Part 11:Guidance on usability, 22, Geneva, Switzerland.
- Jalil, S., & Nanthavanij, S. (2007). Analytical algorithms for ergonomic seated posture when working with notebook computers. Industrial Engineering and Management Systems, 6 (2), 146-157.
- Kelaher, D., Nay, T., Lawrence, B., Lamar, S., & Sommerich, CM. (2001). An investigation of the effects of touchpad location within a notebook computer. Applied Ergonomics, 32, 101-110.
- Kettula, M. (1988). Konekirjoitus: alkeista asiakirjoiksi. Porvoo, 242-244 (in Finnish).
- Larkin, M. (2001). Can handheld computers improve the quality of care? The Lancet, 358 (9291), 1438.
- McCombs, BA. (2003). PDA user’s diary. Canadian journal of rural medicine, 8(4), 270-271.
- Moffet, H., Hagberg, M., Hansson-Risberg, E., & Karlqvist, L. (2002). Influence of laptop computer design and working position on physical exposure variables. Clinical Biomechanics,17, 368-375.
- Pitkänen, U. (2002). Kannettavan ergonomia paranee apuvälineillä, Työ, terveys ja turvallisuus, 3 (in Finnish).
- Shah, M. (2001). Grassroots Computing: Palmtops in Health Care. The Journal of the American Medical Association (JAMA), 285 (13), 1768.
- Statistics Finland. (2008). Science, Technology and Information Society. Retrieved September 10, 2008, from (http://www.tilastokeskus.fi/tup/suoluk/suoluk_tiede_en.html).
- Statistics Finland. (2007a). Internet used by 79 per cent of the population at the beginning of 2007 (Last updated September 28, 2007). Retrieved September 10, 2008, from (http://www.tilastokeskus.fi/til/sutivi/2007/sutivi_2007_2007-09-28_tie_001_en.html).
- Statistics Finland. (2007b). Telecommunications 2006 (Last updated June 5, 2007). Retrieved September 10, 2008, from (http://www.stat.fi/til/tvie/2006/tvie_2006_2007-06-05_tau_006_en.html).
- Straker, L., Jones, J.K., & Miller, J.A. (1997).Comparison of the postures assumed when using laptop computers and desktop computers. Applied Ergonomics, 28 (4), 263-268.
- Szeto, G.P., & Lee, R. (2002). An ergonomic evaluation comparing desktop, notebook, and subnotebook computers. Archives of Physical Medicine and Rehabilitation, 83, 4.
- Torre, D.M., & Wright, S.M. (2003). Clinical and educational uses of handheld computers, Southern medical journal, 96 (10), 996-999.
- Wilkinson, D. (2001). Palmtop medical information. British Medical Journal, 322, 7280, 209.
- Zecevic, A., Miller, D.I., & Harburn K. (2000). An evaluation of the ergonomics of three computer keyboards. Ergonomics, 43 (1), 55–72.