
[:en]
Abstract
Within the domain of subjective usability assessment, several potential discount methods exist. However, there is little or no prior research investigating how these methods compare in their impact on subjective usability ratings. This study compared four methods of collecting subjective usability data with the System Usability Scale (SUS). Users were asked to use and rate three products with the SUS: a library website, an electric can opener, and a digital timer. Lab-based assessment, measurement within the context of a usability assessment, was used as a reference group to compare the performance of the other three methods. A delayed retrospective usability assessment proved the most promising of those three methods as it generated mean SUS scores that were not statistically distinguishable from the lab-based assessment. Both the video-based assessment (rating products based on video footage) and the prospective inspection (judging before use) groups generated mean SUS scores higher than the lab-based group. The delayed retrospective usability assessment has the most support as an alternative method to lab-based usability assessment for collecting subjective usability scores. More research is needed to understand if video-based assessment and prospective inspection assessment can be utilized effectively.
Keywords
Subjective usability, Usability, System Usability Scale, SUS, Measurement, Prospective, Retrospective
Introduction
There are several established discount methods discussed in the usability literature. Heuristic evaluation and cognitive walkthroughs, for example, are well defined and agreed upon methods that can be used when lab-based usability assessment is not an option (Nielsen, 1994). What is lacking are well developed discount methods for measuring subjective usability. Subjective usability, a user’s attitude or opinion concerning the usability of a product or system, plays a crucial role in human factors research and practice (Lewis, 1991). Subjective usability is used heavily in industry (Sauro & Lewis, 2009) and is well represented in the research literature (Kortum & Bangor, 2013). Therefore, there is a need to develop and validate discount methods for subjective usability when there are few other options.
Informal methods of administrating subjective usability measures have been described in the research literature, but no taxonomy of these methods has been created. Currently, supporting evidence is either mixed, lacking, or nonexistent as to whether these different methods are equivalent or if they may lead to biased outcomes. Thus, it is difficult to compare usability ratings generated by these different methods. More research is needed so that practitioners can make informed decisions when selecting how they implement subjective usability measures.
In this study, we investigated how three selected methods of collecting subjective usability (delayed retrospective, video assessment, and prospective inspection) compare in their impact on subjective usability as measured by the System Usability Scale (SUS; Brooke, 1996). A lab-based usability assessment was used as a “control” condition to which the other methods were compared, given its status as the standard for usability testing (Jacobsen et al., 1998; Nielsen, 1994).
The results should help usability experts better understand past research and select from among these methods in future usability assessments. Further, this research should help provide evidence for the adoption or exclusion of these potential discount methods.
Potential Discount Methods
To identify potential discount methods, we reviewed research studies that examined or described different approaches of administering measures of subjective usability. We selected methods that appeared valid, as evidenced by published research studies, and that we felt could be developed into inexpensive and easy to implement research tools. What follows are a description of the methods, a brief description of what the method entails, and its potential strengths and weaknesses. Lab-based usability testing represents the most common method in usability assessment and considered the gold-standard, so we used it as the benchmark to with which we compared the potential methods (Jacobsen et al., 1998; Nielsen, 1994).
Delayed Retrospective
As defined in the current study, retrospective usability is a user’s subjective product evaluation provided after a product use (Hassenzahl & Ullrich, 2007). In their review of methods to study user experience over time, Karapanos et al. (2010) identified a method they described as a “lightweight” alternative to longitudinal studies. This “lightweight” method, what we refer to as “delayed retrospective,” consists of eliciting users’ experiences of past use of a product via a subjective scale (e.g., the SUMI or SUS). However, this approach has potential flaws, foremost of which is the effect of the time delay between use and elicitation of a rating from a user (Karapanos et al., 2010).
Many doubts have been expressed about the quality of ratings that rely solely on users’ memory (Novick et al., 2012). Forgetting due to interference or trace decay may introduce error or bias into user ratings, an effect known as time error (Annett, 2002). What tasks are captured may vary widely from one user to the next, creating highly variable data (Kortum & Johnson, 2013). Retrospective ratings might be more exaggerated than ratings taken concurrently (Bruun & Ahm, 2015).
That said, there is ample evidence that a simple evaluation via a usability survey (e.g., the SUS) may provide reliable ratings. Gao and Kortum (2017) directly compared lab-based usability ratings and delayed retrospective ratings for classes of medical products. The results indicated that both methods provided similar results for capturing subjective usability. One shortcoming of this study was that the devices used in the lab did not always match those used by the users that were surveyed.
Boyd et al. (2019) compared usability ratings collected in a lab to usability ratings taken one week and two weeks after the lab session. They reported no statistically significant differences in the mean ratings. However, this study had a high attrition rate with 33 ratings in the lab, 25 ratings at one week, and only 18 ratings at two weeks. Additionally, the participants were exposed to the same rating scale at all three time points. This means that the possibility of memorization or anchoring of participants’ responses cannot be dismissed (Boyd et al., 2019).
Russell and Oren (2009) described a procedure they labeled as retrospective cued recall (RCR). In this paradigm, the user is cued via a memory aid after which the user is asked to recall past behaviors with a product. Russell and Oren tested this method by asking participants questions about their interactions with a customized internet home page. First, they cued participants using screenshots of the webpage. Then, they inquired about experiences that took place over a month-long period. They then compared participants’ responses to logs of the participants internet activity and concluded that participants recall was very accurate. They also reported that participants showed accurate recall for information that was not cued. They concluded that users could recall specific and detailed information about interactions with a product when attention was focused with an aid.
Based on available evidence, we believe that accurate subjective usability ratings can be solicited using a standardized measure. A standardized measure can act as a memory aid, focusing user attention on the instrumental qualities of the product. Delayed retrospective may be useful as a summative tool, collecting ratings after the launch of a product. As a formative method, delayed retrospective may be useful for collecting data for a competitive analysis or for collecting data for an iterative product line (e.g., generations of a specific product). Finally, until recently (i.e., the 2010s) there has been very little research that has studied time error in relation to subjective scales in usability and ergonomics research (Annett, 2002). Therefore, more research to understand the impact of time delay on usability ratings is warranted.
Video-Based Usability Assessment
Video-based usability assessment consists of showing potential users a video recording of one or more users interacting with the product of interest. Users rate the usability of the product based on the interaction(s) observed in the video. Video-based usability assessment is not without precedent. For example, Bonfim et al. (2016) suggested that videos demonstrating designs in action may provide an alternative to in-lab usability for rating the usability of packaging design. They tested this method by comparing usability ratings on package designs after showing raters videos of a confederate using the packaging. They demonstrated that usability ratings based on video footage could assume various ratings (e.g., not just high or low). They also provided some evidence for the validity of video-based usability assessment, as ratings for packages that were iteratively designed showed higher usability ratings on average than those that were not. The shortcoming of this study is that the designs were rated by students who were involved in the design process. Therefore, the usability ratings may not have been completely driven by the products usability.
Another study reported that videos were capable of augmenting traditional cognitive walkthrough performed by experts. The rationale of using video footage is that videos can provide a record with context and detailed user characteristics to the experts performing the walkthrough. Experts who evaluated the system with video data reported more flaws on average than those who did not have the video data. The average number of flaws reported was roughly equivalent to experts who conducted the walkthrough in situ (Gabrielli et al., 2005). Video has also been used as a medium to test and compare the performance of expert usability evaluators, supporting the notion that video can be used to record and evaluate usability problems (Jacobsen et al., 1998).
A similar method has been explored in other subjective measures of product performance, like workload. Hale and Long (2017) examined whether observers could accurately rate subjective workload while watching another subject complete either a low, medium, or high difficulty task. They found that subjects differed reliably on the high difficulty task but not on low and medium difficulty. Observers, on average, underrated workload across all tasks, but this effect was especially exaggerated on the high difficulty task (Hale & Long, 2017).
Video-based assessment is a promising discount method. It could allow researchers with a limited budget to still capture data from multiple subjects. If safety is a concern, videos provide a medium by which users are at low risk but can still evaluate potentially dangerous products. Videos also allow for complexity, as multiple interactions and different contexts can be shown in the same viewing. Videos provide a way of evaluating one-use designs (e.g., packaging) without the needs to reproduce it multiple times (Bonfim et al., 2016). Users can be recruited remotely as video content is trivial to deliver over the internet.
Prospective Inspection
Prospective, or expected usability, is a label for a class of methods in which users make a usability judgment before using a product. Rather than interacting with the product physically, users judge the product visually (e.g., looking at a photo of the product). It is important to understand prospective usability because consumers often use prospective usability judgments to make decisions on what products to purchase (Kortum & Neal, 2014). Applied in a research setting, prospective usability can be thought of as being like heuristic evaluation, a technique in which usability specialists judge a product according to a set of usability principles (Nielsen, 1994). Unlike heuristic evaluation, prospective usability leverages the judgment of average users who rate a product using scales such as the SUS and their own personal standards of usability.
Evidence in the literature suggests that prospective assessment holds promise in usability research. Acemyan and Kortum (2018) found that subjects viewing photorealistic renderings and photographs gave similar usability judgments as subjects who assessed the environment in person. Photorealistic renderings have also been used to evaluate the usability of voting machines (Acemyan & Kortum, 2015). Sauro (2010) found no statistically significant difference in usability ratings of websites between a group of users who were only exposed to the sites for 5 seconds, enough to view but not use, and a group who had unlimited time to use the site. In his summary of the SUS research literature, Brooke (2013) suggested that even after only a brief exposure to a product, users may be able to provide usability ratings equivalent to ratings based on using the same product for an extended time.
Gronier (2016) conducted a study to gauge the validity of a method called the “5 Second Test,” a commonly used method in which users are asked to rate the perceived usability of a website after only 5 seconds of inspection. He compared ratings of usability, recall of aesthetic characteristics (e.g., menus and buttons), and perceptions of quality and function between a group that inspected a website for 5 seconds to a group that was given unlimited time to inspect the website. He observed a statistically significant difference in perceived usability between the two groups, with the group given unlimited time rating the website’s usability more highly than the 5-second group. He suggested that the group with unlimited time gave a more accurate assessment of usability than did the 5-second group because they focused more on the instrumental qualities of the website. He also concluded that participants in both groups considered instrumental qualities but that the participants given unlimited time paid more attention to qualities relevant to usability than did the 5-second group.
Though there are many studies that support the use of prospective assessment, there is also some evidence that highlights the flaws of prospective assessment. For example, as the number of features increase, users tend to rate the perceived usability of a product lower (Thompson et al., 2005). Likewise, consumers appear to base prospective ratings of usability on their function attributes such as buttons, screen size, and so on. (van Kuijk et al., 2009). Simple beauty has also been found to increase both perceived and post-use usability ratings of products (Tractinsky et al., 2000). Thielsch et al. (2015) reported that ratings of expected usability were not significantly related, as measured by correlations, to post-use measures of usability nor objective measures of usability. As in previous studies, they found that expected usability appears most influenced by aesthetics. They concluded that interaction is required for accurate evaluations of subjective usability. Kortum and Neal (2014) found a statistically significant difference between pre- and post-use ratings across multiple products, though the rank order of products based on usability were the same.
Despite its shortcomings, it may be possible to collect prospective usability assessments if users’ attention is focused on the relevant qualities of the design. Further, evidence suggests that the longer the time a user is given, the more they appear to focus on instrumental qualities (Gronier, 2016; Thielsch et al. 2015). Therefore, a method with instructions that focuses attention on instrumental qualities and gives users enough time to make judgments may yield more accurate prospective judgments. This method would likely be useful in the early stages of a design for formative assessment. Its utility comes in that designers can employ mock-ups and may not need to spend resources on building functional prototypes. Users can judge designs iteratively or competing designs in parallel. Users can also be recruited remotely because physical interaction is not required.
Explicitly directing attention to the instrumental qualities may improve ratings. For example, participants who were given more explicit instructions for a think-aloud study produced more utterances and detected more usability problems than a group with traditional think-aloud instructions, indicating that a simple intervention may focus users’ attentions better when evaluating usability of products (Zhao et al., 2014).
Current Study
The current study investigates how these three different methods of collecting subjective usability (delayed retrospective, video assessment, and prospective inspection) compare in their impact on subjective usability as measured by the SUS (Brooke, 1996).
Method
The following sections present details about the participants who took part in the study and the materials, design, and procedure used in the study.
Participants
A total of 186 undergraduates were recruited via an online university subject pool. The average participant age was 19.3 (SD = 1.03). The reported gender was a little skewed as 117 of the participants reported gender as female, 67 as male, 1 as non-binary, and 1 failing to report gender. Participants received credit toward a course requirement as compensation for participating in the study.
Materials
The System Usability Scale (SUS) was used to measure perceived usability (Brooke, 1996). The SUS was chosen because it is the most widely used measure of subjective usability (Sauro, 2011). Keeping with common practice, the SUS was presented in a modified form, changing the word “cumbersome” to “awkward” in question 8. This leads to improved readability and understanding for participants (Bangor et al, 2008; Finstad, 2006). The second modification is that the word “system” was replaced with the word “product” as it was more appropriate for the items being tested (Lewis & Sauro, 2009).
The participants interacted with and rated three products: a library website, a digital outlet timer, and an electric can opener. We selected products on the basis that it was unlikely participants would have used them for the specific tasks we employed in the experiment. We did this to preclude prior experience affecting usability ratings. We also selected products from product categories we felt would be familiar to the participants to prevent halo effects (van Kuijk et al., 2009).
Design
The study utilized a 4 x 3 mixed design, that is, four methods and three products. The between-subjects factor had four levels corresponding to the four subjective usability collection methods. In the lab-based usability condition, participants interacted with products as if they were in a traditional usability assessment conducted in a lab. In the delayed retrospective condition, participants completed the same three tasks as the lab-based usability condition but rated the products two weeks after their session. A two-week delay was chosen as it fell into the category of very long term as defined by the framework of retrospective studies from Russell and Chi (2014). Also, available evidence suggests that users can recall use of a product after several days of delay with relative accuracy, so we chose a length of time that we believe could reasonably affect recall (Russell & Chi, 2014; Russell & Oren, 2009). In the video-based usability condition, participants rated products based on video footage of the product being used. In the prospective assessment condition, participants rated the products after visually inspecting them. The within-subject factor represents the three products that each participant used and rated. The dependent variable of interest was subjective usability as measured with the SUS.
Due to time constraints and limitations imposed by the subject pool, full randomization of experimental conditions was not perfectly realized. It became clear that the two-week delay between the session and participant response would extend past the academic semester and overlap with students’ finals schedule. Although participants had been randomly assigned to experimental groups before the experiment began, this order was suspended so that the responses could be collected on time. For a period of two weeks, all participants were assigned to the retrospective condition so that enough time was allotted between the usability session and email responses. Once enough participants had been assigned to the delayed retrospective condition, the previous assignment order was resumed. It is possible that violation of full randomization may have affected the results.
Procedure
The following sections detail the procedure used for all the studies, as well as the specific procedures used for the lab-based assessment, delayed retrospective assessment, video-based assessment, and the prospective inspection assessment.
All Studies
After collecting informed consent from the participants, the experimenter administered three tasks in a randomly assigned order. The participants’ tasks were to find a journal article using the library website, open a 14.5 ounce can with the can opener, and program the clock on the timer to 6:00 a.m. The experimenter instructed the participant to complete the assigned task to the best of their ability and to inform the experimenter when they finished.
Lab-Based Assessment
Following each task completion, the participant rated the product using the SUS. This was repeated for all three products. Once the third task was completed and the product rated, the experimenter thanked and dismissed the participant.
Delayed Retrospective Assessment
Once the third task was completed, the experimenter informed the participant that they would receive an email asking about their experience in the session. To avoid cueing participants to remember certain information, the experimenter did not provide details about the nature of the questions to the participant. The experimenter collected the preferred email address for the participant and then dismissed them. Two weeks after the session, an email survey containing three SUS forms corresponding to the products was sent to the participant. The order of the SUS forms matched the order in which the tasks were administered for each individual session. Participants rated the three products and submitted the ratings online.
Video-Based Assessment
The participants’ tasks were to watch a video of a confederate using each of the products. Tasks depicted in each video were shown to be completed successfully in one attempt. The experimenter instructed the participant to watch each video as many times as they would like. The participant would indicate to the experimenter when they had finished watching a video, after which the participant rated the product featured in the video using the SUS. This was completed for all three products. Once the third product had been rated, the experimenter thanked and dismissed the participant.
Prospective Inspection Assessment
The participants’ tasks were to inspect the three products. The experimenter gave the participant a description of a task for each product for which they were to evaluate the product’s usability. Those task descriptions corresponded to the tasks completed with each product as described in the lab-based assessment and delayed retrospective conditions. The experimenter instructed the participant to inspect each item for as long they wanted. The participant informed the experimenter when they finished their inspection. At that time, the participant rated the product using the SUS. This was completed for all three products.
After the participant finished inspecting and rating all three items, the experimenter informed the participant that they would then use the items and rate them. The task and the task order were the same as the order in which the participants had inspected the items. The experimenter instructed the participant to complete the assigned task to the best of their ability and to inform the experimenter when they finished. The participant then rated the product using the SUS. This was completed for all three products. Once the third task was completed and the product rated, the experimenter thanked and dismissed the participant.
Results
One participant from the video condition was missing a response and so was excluded from the analysis. To check for outliers, we inspected boxplots for each product per experimental condition. Outliers were defined as any value that fell three interquartile ranges (IQR) beyond the hinges (25th and 75th percentiles) of their respective boxplots. No outliers were found.
Upon visual inspection, mean SUS ratings (Table 1) from the video and prospective conditions were on average greater than SUS scores from the lab and delayed conditions. The mean SUS score from the delayed condition were on average less than the ratings from the lab condition for all three products.
Table 1. Number of Participants, Mean, and Standard Deviation for Each Product by Condition
|
|
Product |
|||||||
|
Experimental condition |
|
Library website |
Can opener |
Digital timer |
||||
|
n |
M |
SD |
M |
SD |
M |
SD |
||
|
Lab |
45 |
62.28 |
21.04 |
42.83 |
24.16 |
39.22 |
21.83 |
|
|
Delayed |
51a |
58.08 |
26.24 |
39.27 |
26.45 |
34.17 |
24.84 |
|
|
Video |
44 |
70.91 |
19.21 |
81.88 |
12.38 |
59.43 |
18.90 |
|
|
Prospective |
45 |
72.06 |
14.63 |
65 |
19.16 |
60.11 |
15.37 |
|
| a Due to concerns of attrition, 51 participants were assigned to the delayed group to compensate for any possible drop out. | ||||||||
Due to the differences in standard deviations between groups, coupled with different group sizes, unequal variance became a concern. Homogeneity of variances was tested using the Brown-Forsythe test for all three products. For the website, there was a statistically significant difference in variance between the measurement conditions, F(3, 181) = 3.23, p = .024. For the can opener, there was a statistically significant difference in variance between the measurement conditions, F(3, 181) = 26.15, p < .001. And for the digital timer, there was a statistically significant difference in variance between the measurement conditions, F(3, 181) = 3.22, p = .024. Because the assumption of homogeneity of variance was rejected, the chance for a Type 1 error was greatly inflated. To make the test more conservative, a Welch adjustment was conducted on the error degrees of freedom for the Dunnett’s tests. Additionally, p-values of statistically significant tests were interpolated using Dunnett’s t table at an alpha = .01 level.
Attrition was also a concern for participants in the delayed condition due to the two-week delay before the administration of the survey. Response times were recorded to determine if any respondents waited too long before responding. The mean response time for the retrospective participants was 14.1 days. Forty-four of the participants responded in 14 days and 7 responded in 15 days. The 15-day responses were not much past the desired response time and so were included in the analysis.
Comparison of Mean SUS Ratings
We conducted three Dunnett’s tests, one for each product, using the average SUS scores. The lab-based assessment condition was used as the “control” to which the other conditions were compared. A false discovery rate (FDR) adjustment was conducted to control for Type 1 error inflation due to multiple comparisons (Benjamini & Hochberg, 1995). The results of the FDR adjustment did not change the outcome of the analysis, as all the p-values came in under criterion levels. To account for the violation of homogeneity of variances, a Welch adjustment for the degrees of freedom was conducted. The results from Dunnett’s test are reported using Dunnett’s t, p-value, mean difference (MD), and effect size as measured by Cohen’s d (Cohen, 1988).
Library Website
No statistically significant differences were found between the lab-based assessment and the other three collection methods for the average ratings of the library website (Figure 1). The delayed group’s average SUS had the lowest mean difference from lab group, t(99.2) = 0.98, p = .64, MD = 4.19, d = 0.17. The second largest mean difference was observed between the video group’s average SUS and lab group, t(99.2) = 1.95, p = .13, MD = 8.63, d = 0.44. The difference between the prospective group’s mean SUS and lab group’s mean SUS was about the same, t(99.2) = 2.22, p = .07, MD = 9.78, d = 0.54.
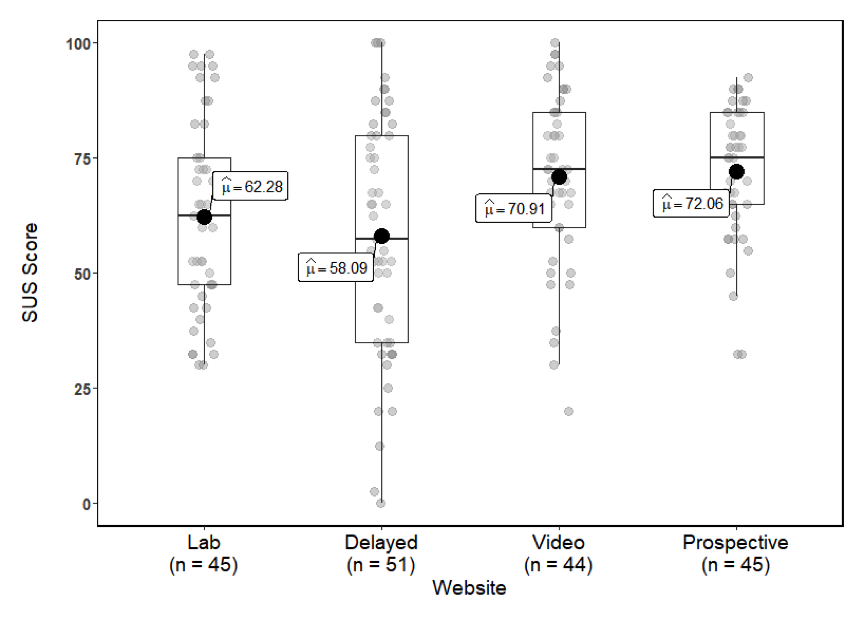
Figure 1. Boxplots of the SUS scores for the library website.
Can Opener
Again, the mean difference between lab and delayed groups’ average SUS scores was low and not statistically significant, t(97.3) = 0.81, p = .75, MD = 3.57, d = 0.14 (Figure 2). The largest mean difference was found between the average SUS scores of the lab and video groups which was statistically significant, t(97.3) = 8.58, p < .01, MD = 39.04, d = 2.05. A statistically significant difference was also observed in the comparison between lab and prospective group’s average SUS scores, t(97.3) = 4.90, p < .01, MD = 22.17, d = 1.02.
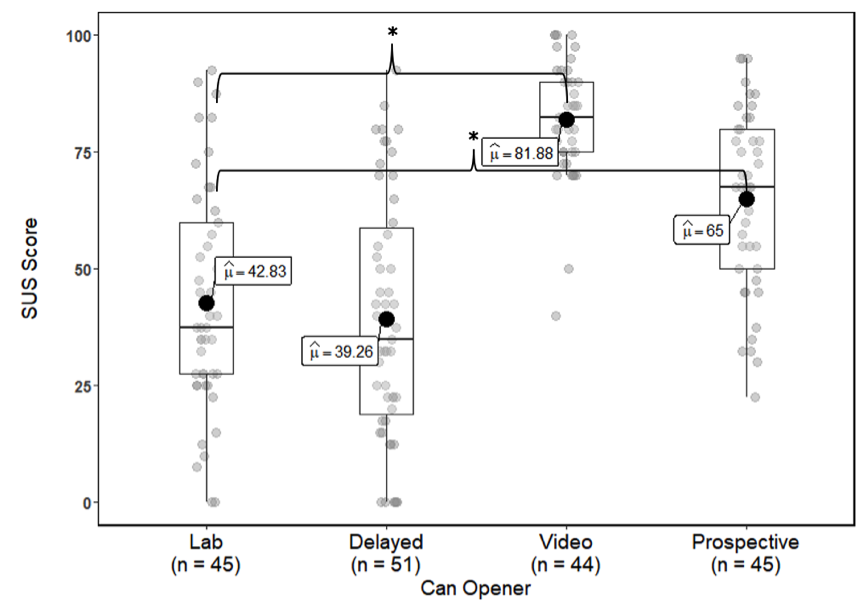
Figure 2. Boxplots of the SUS scores for the can opener. Asterisk and brackets indicate statistically significant pairwise comparisons at the p < .05 level.
Digital Timer
For the ratings of the digital timer, no statistically significant difference was found in the comparison of average SUS scores between the lab and delayed groups, t(99.6) = 1.19, p = .49, MD = 5.06, d = 0.22 (Figure 3). A statistically significant difference was observed for the comparison between the lab and video groups, t(99.6) = 4.60, p < .01, MD = 20.21, d = 0.98. The largest mean difference was observed for the comparison between the lab and prospective groups which was statistically significant, t(99.6) = 4.79, p < .01, MD = 20.89, d = 1.11.
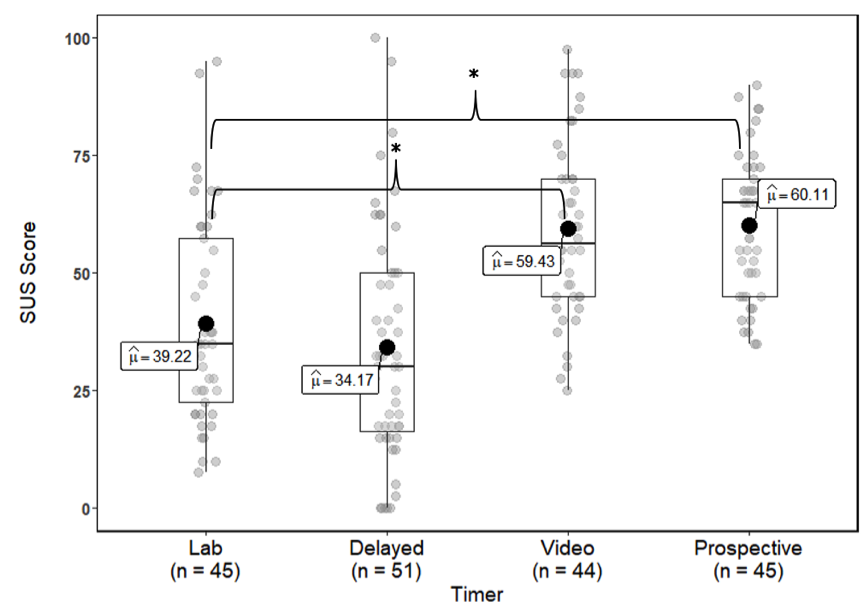
Figure 3. Boxplots of the SUS scores for the digital timer. Asterisk and brackets indicate statistically significant pairwise comparisons at the p < .05 level.
Inter-Rater Agreement
Reliability is a desirable measure for any subjective measurement tool (DeVellis, 2017). Because usability ratings generally depend on multiple raters to make decisions, and these methods may alter the reliability of individual raters, we assessed the inter-rater reliability of the various methods. Intraclass correlation coefficients (ICC) and their 95% confidence intervals were calculated to assess inter-rater reliability for each experimental condition using a two-way random-effects model applied to the ratings of the three products. Interpretations were made using the following guidelines: <0.50, poor; between 0.50 and 0.75, fair; between 0.75 and 0.90, good; and above 0.90, excellent (Koo & Li, 2016).
The inter-rater reliability for the lab condition was between good and excellent ICC (2, 45) = .93 [.78, 1.0]. The inter-rater reliability for the delayed group was between good and excellent ICC (2, 51) = .92 [.75, 1.0]. The inter-rater reliability for the video group was between good and excellent ICC (2, 44) = .95 [.84, 1.0]. The inter-rater reliability for the prospective group was between fair and excellent ICC (2, 45) = .84 [.53, .99].
Comparison of Pre-Use and Post-Use Ratings
Four participants from the prospective group were missing responses on their post-use SUS ratings and were excluded from the analysis.
As shown in Figure 4, there was a statistically significant difference between the pre- and post-use mean SUS scores for the website, t(40) = 3.76, p = .001, d = 0.59. There was a statistically significant difference between the pre- and post-use mean SUS scores for the can opener, t(40) = 7.35, p < .001, d = 1.15. There was a statistically significant difference between the pre- and post-use mean SUS scores for the digital timer, t(40) = 8.94, p < .001, d = 1.40.
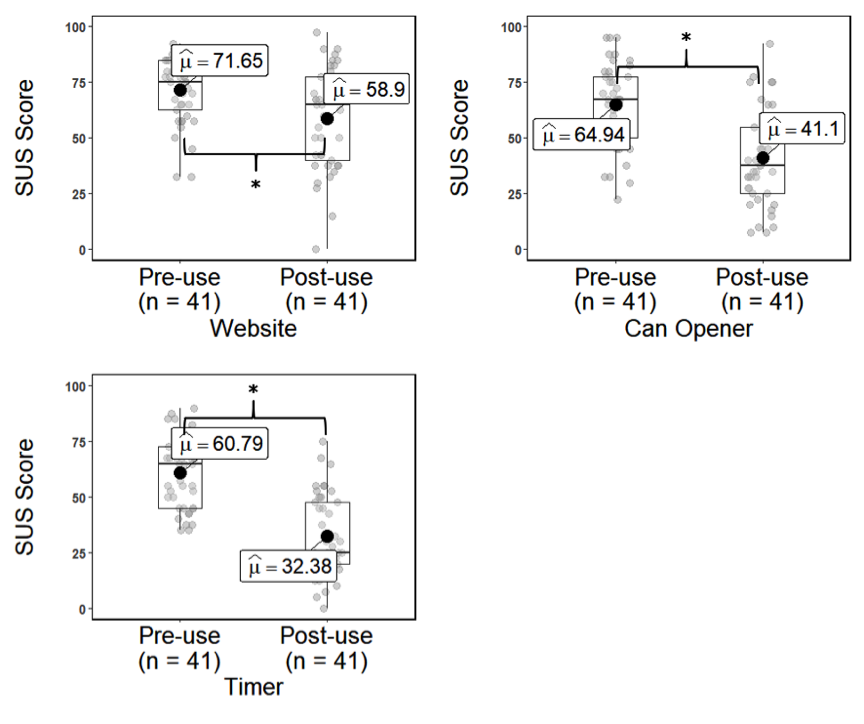
Figure 4. Boxplots of the pre- and post-use SUS ratings. Asterisk and brackets indicate statistically significant pairwise comparisons at the p < .05 level.
The relationship between pre-use and post-use usability ratings was analyzed using Pearson’s correlation. A total of three correlations, one for each product, were conducted. There was a weak to moderate positive statistically significant relationship between pre- and post-use usability scores for the library website, r(39) = .40, p = .009. There was a moderate positive statistically significant relationship between pre- and post-use usability ratings for the can opener, r(39) = .48, p = .002. There was a weak negative statistically nonsignificant relationship between pre- and post-use usability ratings for the digital timer, r(39) = .30, p = .055.
Discussion
In this study, we tested the validity of three potential discount methods for collecting subjective usability ratings. The results support the collection of subjective usability ratings with the delayed retrospective method but not the other two methods, as we conducted them in this study.
Delay vs. In-Lab Usability Ratings
We did not find any statistically significant differences between ratings taken retrospectively two weeks after the use of a product and ratings taken immediately after use, as would be done in a typical laboratory usability assessment. One interesting finding was that on average the delayed retrospective mean ratings were lower than the lab-based ratings for all three products. Additionally, we observed increased variability in the inter-rater agreement and larger standard deviations for delayed ratings in comparison to the lab ratings. This pattern is consistent with findings from Boyd et al. (2019) who reported a trend of an increasingly wider range of ratings with time after use and mean ratings decreasing with time. Raters in the delayed condition were slightly less reliable as measured by ICC than the raters in the lab-based assessment, but still demonstrated acceptable reliability.
Our results, combined with previous studies, support the validity of collecting delayed ratings of subjective usability using assessment tools like the SUS (Boyd et al., 2019; Gao & Kortum, 2017; Kortum & Bangor, 2013; Kortum & Sorber, 2015). Some caution is warranted, however, as these ratings may be more unreliable the longer the time between the last use of the product and when the measurement is taken.
Video vs. In-Lab Usability Ratings
We found that on average, usability ratings based on the video depicting the successful use of the products were greater than the ratings taken from the lab-based assessment. The high ratings may be a manifestation of self-serving bias, a propensity for humans to attribute their own success to traits they possess and downplay the success of others by attributing them to situational factors. For example, Brown et al. (2015) found that users tend to attribute successes in a navigation task to the design of a navigation system when explaining the success of others but are more likely attribute success to their own abilities when they experience success on the same task. This is consistent with results from Hale and Long (2017). They reported that observers accurately rated subjective workload when a task was easy. However, observers on average underestimated workload when the task was hard. The other explanation for inflated ratings is that they were driven by the content of the videos. The user depicted in the video was a confederate who executed the tasks with 100% success and no errors. From that perspective, the video-based ratings may be considered accurate given the raters only witnessed success with the product.
Though it led to inflated scores, the video ratings had the highest inter-rater reliability of all the conditions and the smallest confidence interval. This is not unlike the results reported by Gabrielli et al. (2005) who observed reduced variation in the number of errors detected by experts conducting a cognitive walkthrough supported by video than those who used traditional cognitive walkthrough and those who used cognitive walkthrough in situ. High reliability is a desirable trait in any measurement method. Though the approach we used in this study appears to lead to inflated usability scores, there is still much potential to explore in the use of this method.
Prospective vs. In-Lab Usability Ratings
The mean ratings from the prospective assessment were on average more positive than the ratings from the lab assessment. These findings are consistent with the results from previous studies on prospective usability (Kortum & Neal, 2014; Thielsch et al., 2015). Additionally, we observed that prospective ratings and lab ratings statistically differed on the can opener and timer but not the website. Some studies have demonstrated that prospective ratings can produce similar values to post-use ratings in the case of websites (Gronier, 2016; Sauro, 2010) and environments (Acemyan & Kortum, 2018). Given that subjective measures of usability are highly related to experience with the product rated, our interpretation is that accurate prospective ratings depend on the prior experience of the raters (Kortum & Bangor, 2013; McLellan et al., 2012). In the case of environments and websites, most raters will have had multiple interactions with products in that category, which may allow them to draw on that experience to make better inferences. Finally, the inspection group had the least desirable inter-rater reliability among the four groups, indicating less agreement and less consistent judgments by the raters. Taken together, our results suggest that prospective usability judgments should be avoided until a reliable method of accessing usability prospectively has been developed.
Expected vs. Experienced Usability
The correlations between expected and experienced usability in our study were stronger than those found in previous studies. This may be a function of time spent on inspection. Thielsch et al. (2015) reported correlations of .16 between expected usability measured at 50 milliseconds and experienced usability, .19 between expected usability measured at 500 milliseconds and experienced usability, and expected usability measured at 10 seconds had a correlation of .25 with experienced usability. Likewise, Gronier (2016) reported that users given unlimited time to inspect a webpage made better prospective judgments than a group who only had 5 seconds. The increase in strength of the relationship between expected and experienced usability as a function of time suggests that users can gather relevant information in which to rate usability given enough time (Gronier, 2016). That said, our data do not support this hypothesis, as we gave unlimited time for inspection with no observable effect.
The higher correlations may also be driven by the instructions we gave. Many studies of expected usability do not appear to assess products for a specific task. This may be problematic for multiuse products such as websites (Thielsch et al., 2015) or alarm clocks (van Kuijk et al., 2009) as users may be assessing the usability of different tasks or sub-tasks, adding unexplained variance to the ratings. We specified the task to be assessed, which may have helped users focus on more relevant details and presumably directed users to evaluate the product for the same task. Though the prospective judgments in this study did not prove to be reliably accurate, our results may indicate a direction for improvement. Adding time and creating instructions that direct rater attention to instrumental qualities may improve prospective usability ratings.
Conclusions and Future Directions
In summary, we collected subjective usability ratings, as measured by the SUS, for three products using three potential discount methods: Delayed retrospective assessment, video-based assessment, and prospective assessment. The ratings from the three potential methods were compared to the ratings for evaluations from a lab-based usability assessment. Mean SUS scores collected after a two-week delay did not significantly differ from the mean ratings from the lab-based assessment. Mean SUS scores from the prospective and video-based assessments did significantly differ on two of the products.
Based on our results, we suggest the following directions for future research:
- To better understand the relationship between time delay and ratings, researchers should model the relationship between time delay and usability ratings. Do ratings become more stochastic with longer delays? Is there a ceiling to this effect?
- To further explore the validity of video-based assessment, researchers should try different video content (e.g., completely negative, completely positive, or a mix of the two). Footage of real users (rather than confederates) should also be tested.
- To determine if prospective usability may be developed into a valid method, there needs to be more testing with guidelines and instructions given to users conducting the rating. Further, the relationship between ratings and time spent on inspection should be explored.
- Prospective usability may be accurate for only certain types of products. We suggest two possible hypotheses. This may be a function of characteristics possessed by the products. It may also be a function of prior experience approaching a form of expertise possessed by the users providing the prospective ratings. Both of these variables deserve further investigation.
Tips for Usability Practitioners
We offer the following suggestions for practitioners based on the results of the study:
- Be cautious about using video-based and prospective assessment methods for collecting subjective usability ratings until a well validated method for their use has been developed.
- Collecting usability ratings with the delayed retrospective method appears valid given the available evidence.
- When using the delayed retrospective method be cognizant of the length of time between when the measurement is taken and when the user interacted with the product being rated, as ratings may be less reliable as the delay between use and measurement increases.
Acknowledgments
The authors would like to thank Dr. David Lane and Dr. Michael Byrne for their helpful comments and guidance on this research, as well as Charlie Card-Childers who helped collect the data.
References
Acemyan, C. Z., & Kortum, P. (2015). Does the polling station environment matter? The relation between voting machine layouts within polling stations and anticipated system usability. Proceedings of the Human Factors and Ergonomic Society Annual Meeting, 59(1), 1066–1070. https://doi.org/10.1177/1541931215591299
Acemyan, C. Z., & Kortum, P. (2018). Does the type of presentation medium impact assessments of the built environment? An examination of environmental usability ratings across three modes of presentation. Journal of Environmental Psychology, 56(1), 30–35. https://doi.org/10.1016/j.jenvp.2018.02.006
Annett, J. (2002). Subjective ratings scales: Science or art? Ergonomics, 45(14), 966–987. https://doi.org/10.1080/00140130210166951
Bangor, A., Kortum, P., & Miller, J. (2008). Determining what individual SUS scores mean: Adding an adjective rating scale. Journal of Usability Studies, 4(3), 114–123. https://uxpajournal.org/determining-what-individual-sus-scores-mean-adding-an-adjective-rating-scale/
Benjamini, Y., & Hochberg, Y. (1995). Controlling the false discovery rate: A practical and powerful approach to multiple testing. Journal of the Royal Statistical Society, 57(1), 289–300. www.jstor.org/stable/2346101
Bonfim, G., Medola, F., & Paschoarelli, L. (2016). Usability in the development of packaging design: Complementing the subjective evaluation. In M. Soares, C. Falcão, & T. Z. Ahram (Eds.), Advances in ergonomics modeling, usability & special populations (pp. 67–74). Springer. https://doi.org/10.1007/978-3-319-41685-4_7
Boyd, K., Bond, R., Vertesi, A., Dogan, H., & Magee, J. (2019). How people judge the usability of a desktop graphic user interface at different time points: Is there evidence for memory decay, recall bias or temporal bias? Interacting with Computers, 31(2), 221–230. http://doi.org/10.1093/iwc/iwz019
Brooke, J. (1996). SUS-A quick and dirty usability scale. In P. W. Jordan, B. Thomas, B. A. Weerdmeester, & A. L. McClelland (Eds.), Usability evaluation in industry (pp. 189–194). Taylor & Francis.
Brooke, J. (2013). SUS: A retrospective. Journal of Usability Studies, 8(2), 29–40. https://uxpajournal.org/sus-a-retrospective/
Brown, M., Houghton, R., Sharples, S., & Morley, J. (2015). The attribution of success when using navigation aids. Ergonomics, 58(3), 426–433. https://doi.org/10.1080/00140139.2014.977827
Bruun, A., & Ahm, S. (2017). Mind the gap! Comparing retrospective and concurrent ratings of emotion in user experience evaluation. In J. Abascal, S. Barbosa, M. Fetter, T. Gross, P. Palanque, & M. Winckler (Eds)., Human-computer interaction — INTERACT 2015 (pp. 237–254). Springer. https://doi.org/10.1007/978-3-319-22701-6_17
Cohen, J. (1988). Statistical power analysis for the behavioral sciences (2nd ed). Erlbaum.
DeVellis, R. F. (2017). Scale Development. SAGE.
Finstad, K. (2006). The System Usability Scale and non-native English speakers. Journal of Usability Studies, 1(4), 185–188. https://uxpajournal.org/the-system-usability-scale-and-non-native-english-speakers/
Gabrielli, S., Mirabella, V., Kimani, S., & Catarci, T. (2005). Supporting cognitive walkthrough with video data: A mobile learning evaluation study. In M. Tscheligi, R. Bernhaupt, & K. Mihalic (Eds.), MobileHCI ’05: Proceedings of the 7th international conference on human computer interaction with mobile devices & services (pp. 77–82). Association for Computing Machinery. https://doi.org/10.1145/1085777.1085791
Gao, M., & Kortum, P. (2017). Measuring the usability of home healthcare devices using retrospective measures. Proceedings of the Human Factors and Ergonomics Society Annual Meeting, 61(1), 1281–1285. http://doi.org/10.1177/1541931213601801
Gronier, G. (2016). Measuring the first impression: Testing the validity of the 5 second test. Journal of Usability Studies, 12(1), 8–25. https://uxpajournal.org/measuring-testing-validity-5-second-test/
Hale, L. T., & Long, P. A. (2017). How accurately can an observer assess participant self-reported workload? Proceedings of the Human Factors and Ergonomics Society Annual Meetings, 61(1), 1486–1487. http://doi.org/10.1177/1541931213601856
Hassenzahl, M., & Ullrich, D. (2007). To do or not to do: Differences in user experience and retrospective judgments depending on the presence or absence of instrumental goals. Interacting with Computers, 19(4), 429–437. https://doi.org/10.1016/j.intcom.2007.05.001
Jacobsen, N. E., Hertzum, M., & John, B. E. (1998). The evaluator effect in usability studies: Problem detection and severity in judgment. Proceedings of the Human Factors and Ergonomics Society Annual Meeting, 42(19), 1336–1340. http://doi.org/10.1177/154193129804201902
Karapanos, E., Martens, J. B., Hassenzahl, M. (2010). On the retrospective assessment of users’ experience over time: Memory or actuality? In CHI EA ’10: CHI ’10 extended abstracts on human factors in computing systems (pp. 4075–4080). Association for Computing Machinery. https://doi.org/10.1145/1753846.1754105
Kortum, P., & Bangor, A. (2013). Usability ratings for everyday products measures with the System Usability Scale. International Journal of Human Computer Interaction, 29(2), 67–76. http://doi.org/10.1080/10447318.2012.681221
Kortum, P., & Johnson, M. (2013). The relationship between user experience with a product and perceived system usability. Proceedings of the Human Factors and Ergonomics Society Annual Meeting, 57(1), 197–201. http://doi.org/10.1177/1541931213571044
Kortum, P., & Neal, T. (2014). How accurate are prospective usability judgments? [Poster presentation]. 2014 Southwest Regional Human Factors & Ergonomics Society Symposium, College Station, TX.
Kortum, P., & Sorber, M. (2015). Measuring the usability of mobile applications for phones and tablets. International Journal of Human-Computer Interaction, 31(8), 518–529. http://doi.org/10.1080/10447318.2015.1064658
Lewis, J. R. (1991). Psychometric evaluation of an after-scenario questionnaire for computer usability studies: The ASQ. ACM SIGCHI Bulletin, 23(1), 78–81. http://doi.org/10.1145/122672.122692
Lewis, J. R., & Sauro, J. (2009). The factor structure of the system usability scale. In M. Kurosu (Ed.), International Conference on Human Centered Design (pp. 94–103). Springer. http://doi.org/10.1007/978-3-642-02806-9_12
McLellan, S., Muddimer, A., Peres, S. C. (2012). The effect of experience on System Usability Scale ratings. Journal of Usability Studies, 7(2), 56–67. https://uxpajournal.org/the-effect-of-experience-on-system-usability-scale-ratings/
Nielsen, J. (1994). Usability inspection methods. In C. Plaisant (Ed.), CHI’ 94: Conference companion on human factors in computing systems (pp. 413–414). Association for Computing Machinery. https://doi.org/10.1145/259963.260531
Novick, D. G., Santaella, B., Cervantes, A., & Andrade, C. (2012). Short-term methodology for long-term usability. In SIGDOC ’12: Proceedings of the 30th ACM international conference on design of communication (pp. 205–212). Association for Computing Machinery. https://doi.org/10.1145/2379057.2379097
Russell, D. M., & Chi, E. H. (2014). Looking back: Retrospective study methods for HCI. In J. S. Olson, & W. A. Kellogg (Eds.), Ways of knowing in HCI (pp. 373–393). Springer. https://doi.org/10.1007/978-1-4939-0378-8_15
Russell, D. M., & Oren, M. (2009). Retrospective cued recall: A method for accurately recalling previous user behaviors. In Proceedings of the 42nd Hawaii international conference on system sciences (pp. 1–9). Institute of Electrical and Electronics Engineers. https://doi.org/10.1109/HICSS.2009.370
Sauro, J. (2010, November 9). 5 second usability tests. Measuring U. Retrieved from https://measuringu.com/five-second-tests/
Sauro, J. (2011). A practical guide to the system usability scale: Background, benchmarks & best practices. Measuring Usability LLC.
Sauro, J., & Lewis, J. R. (2009). Correlations among prototypical usability metrics: Evidence for the construct of usability. In S. Greenberg, S. E. Hudson, K. Hinckley, M. R. Morris, & D. R. Olsen Jr (Eds.), CHI ’09: Proceedings of the SIGCHI conference on human factors in computing systems (pp. 1609–1618). Association for Computing Machinery. http://dx.doi.org/10.1145/1518701.1518947
Thielsch, M. T., Engel, R., & Hirschfeld, G. (2015). Expected usability is not a valid indicator of experienced usability. Peer J Computer Science, 1:e19. https://doi.org/10.7717/peerj-cs.19
Thompson, D. V., Hamilton, R. W., & Rust, R. T. (2005). Feature fatigue: When product capabilities become too much of a good thing. Journal of Marketing Research, 42(4), 431–442. https://doi.org/10.1509/jmkr.2005.42.4.431
Tractinsky, N., Katz, A. S., & Ikar, D. (2000). What is beautiful is usable. Interacting with Computers, 13(2), 127–145. https://doi.org/10.1016/S0953-5438(00)00031-X
van Kuijk, J. I., Preijde, E. E., Toet, E. N., & Kanis, H. (2009). Expected versus experienced usability: What you see is not always what you get. In 17th world congress on ergonomics. International Ergonomics Association. https://doi.org/10.13140/2.1.1573.2801
Zhao, T., McDonald, S., & Edwards, H. M. (2014). The impact of two different think-aloud instructions in a usability test: A case of just following orders? Behaviour & Information Technology, 33(2), 163–183. https://doi.org/10.1080/0144929X.2012.708786
[:]