
[:en]
Abstract
The Game User Experience Satisfaction Scale (GUESS) is a 55-item tool assessing nine constructs describing video game satisfaction. While the development of the GUESS followed best practices and resulted in a versatile, comprehensive tool for assessing video game user experience, responding to 55 items can be cumbersome in situations where repeated assessments are necessary. The aim of this research was to develop a shorter version of the scale for use in iterative game design, testing, and research. Two studies were conducted: the first one to create a configural model of the GUESS that was then truncated to an 18-item short scale to establish an initial level of validity and a second study with a new sample to demonstrate cross-sample validity of the 18-item GUESS scale. Results from a confirmatory factor analysis of the 18-item scale demonstrated excellent fit and construct validity to the original nine construct instrument. Use of the GUESS-18 is encouraged as a brief, practical, yet comprehensive measure of video game satisfaction for practitioners and researchers.
Keywords
Gaming, video game player experience, psychometric evaluation, satisfaction, scale validation, questionnaire, survey, user experience
Introduction
In global markets, the video game industry has seen a rise in revenue for several years with $70.6 billion in 2012 and predictions estimating $159.3 billion in 2020 (Takahashi, 2020; Wijman, 2018). In the United States, there was an estimated $35.8 billion in sales of video game content during 2018 in the video game industry (Entertainment Software Association, 2019). Additionally, 65% of Americans adults reported playing video games with the average age of a gamer being 35 years old (Entertainment Software Association, 2019). Steam, a digital distribution platform for video games, currently has an average of 180 games released per month; and in 2019, around 8,000 games were released (SteamSpy, 2020). With the large amount of new video games released each year, developers need to be able to create video games that are highly enjoyable to play in order to compete in the large market of available video games. One technique developers use to assess the quality of a video game is through playtesting, where users come to a lab space to play a video game and afterwards provide feedback about their experience. A gaming experience questionnaire may be administered at the end of the playtesting session to quantify player feedback about the video game played.
While many scales have been developed to measure one or more aspects of player experience, the methods and goals by which each was developed vary considerably and are difficult to generalize to a wide range of video games. After a comprehensive literature search of published instruments, Phan et al. (2016) revealed several common limitations including only assessing a single aspect of gaming (e.g., immersion), developing only for a particular genre or type of game, or publishing with limited information about the psychometric scale development and validity testing. Phan et al. (2016) presented a new psychometrically validated scale as a comprehensive measure of video game satisfaction. The authors created the scale using psychometric best practices and assessed over 450 unique video game titles with over 1,300 participants.
After a thorough review of existing game scales, an original item pool was generated including 875 possible items. After iteration, modification, expert review, and refinement, the pool was narrowed to 100 items. Exploratory factor analysis (EFA) and confirmatory factor analysis (CFA) were conducted and revealed a 55-item satisfaction scale with nine constructs: usability/playability, narratives, play engrossment, enjoyment, creative freedom, audio aesthetics, personal gratification, social connectivity, and visual aesthetics. The GUESS items are rated with a 7-point Likert scale (1 = Strongly Disagree to 7 = Strongly Agree). Calculating the subscales scores of the GUESS consists of averaging the items in that subscale and an overall score calculated by summing the subscale scores.
Since its release, the GUESS has been used in various domains such as healthcare simulation, mixed reality, social interaction, and virtual reality gaming. In the healthcare simulation domain, researchers used the GUESS, along with the System Usability Scale (SUS; Brooke, 1996), to evaluate the satisfaction of video games designed for training muscle action (Manero et al., 2018; Smith et al., 2018a; Smith et al., 2018b). Researchers have used the GUESS to evaluate a mixed reality escape room game (Warmelink et al., 2017), a motion-based rhythm game (Martin et al., 2019), and for development of a vocal training game (Yang et al., 2019). The GUESS has also been used to evaluate virtual reality video games compared to games played on traditional computer monitors (Pallavicini & Pepe, 2019; Shelstad et al., 2017; Yildirim et al., 2018). Ibarra and colleagues (2018) used the Enjoyment construct of the GUESS in their evaluation of a tablet for social interaction for older adults in residential care.
While the development of the GUESS followed best practices and resulted in a versatile, comprehensive tool for assessing video game user experience, responding to 55 items can be cumbersome in situations where repeated assessments are necessary and rapid iterations are prescribed. For example, in a research study where multiple games are evaluated over time and compared within a single experimental play session or in an industry game development environment where rapid iterative design and testing is employed. As noted in Phan et al. (2016), a number of different assessment tools covering different aspects of video game play experience are available that are less than 55 items including the Game Experience Questionnaire (GEQ), Gameplay Experience Questionnaire, the Immersion Questionnaire, and the Play Experience of Need Satisfaction (PENS; see Table 1).
Table 1. Game Scales, Number of Items, and Subscales
|
Scale |
Number of Items |
Subscales |
|
Game Experience Questionnaire (GEQ) by IJsselsteijn et al., 2013a |
33 |
Immersion, Flow, Competence, Tension, Challenge, Positive, and Negative Affect |
|
Gameplay Experience Questionnaire by Ermi & Mäyrä, 2005 |
18 |
Sensory Immersion, Challenge-based Immersion, and Imaginative Immersion |
|
Game User Experience Satisfaction Scale (GUESS) Phan et al., 2016 |
55 |
Usability/Playability, Narratives, Play Engrossment, Enjoyment, Creative Freedom, Audio Aesthetics, Personal Gratification, Social Connectivity, and Visual Aesthetics |
|
Immersion Questionnaire by Jennett et al., 2008 |
31 |
Cognitive Involvement, Real World Dissociation, Challenge, Emotional Involvement, and Control |
|
Player Experience of Need Satisfaction (PENS) by Ryan et al., 2006b |
21 |
Competence, Autonomy, Relatedness, Intuitive Controls, and Presence/Immersion |
|
a Five-factor model (Immersion, Flow, Competence, Positive Affect, and Negative Affect) suggested by Johnson et al., 2018. b Four-factor model (Competence/Intuitive Controls, Autonomy, Relatedness, and Presence/Immersion) suggested by Johnson et al., 2018. |
||
Phan et al. (2016) mentioned the lack of psychometric validation testing for both the GEQ and the PENS. Recently, Johnson et al. (2018) published results from an EFA and CFA analysis with both the GEQ and PENS. Initial analysis of the GEQ showed that the original seven factors were not fully supported; some items loaded onto a single factor and some items were eliminated. A CFA indicated a five-factor model for the GEQ instead: Immersion, Flow, Competence, Positive Affect, and Negative Affect (which combined the previous factors of Negative Affect, Tension, and Challenge). For the PENS, initial analysis showed that a four-factor model was the best fit with Competence/Intuitive Controls, Autonomy, Relatedness, and Presence/Immersion (Competence and Intuitive Controls loading to a single factor). In addition, several items from the Presence factor loaded to a common factor with some items from Autonomy. The discrepancies in the factor structures of these alternative scales and the fact that some factors in each scale were not empirically supported demonstrates the need for further development of a scale that can be used for rapid, iterative design.
Our aim in this paper is to present a validation of a shorter version of the GUESS to be used in iterative game development testing and research.
Study 1
The purpose of Study 1 was to conduct a CFA on a sample of collected GUESS data to see if it fits with the current theoretical model for the GUESS measure (Phan et al., 2016); after confirming the model has good fit, we then truncated the GUESS to reduce the number of items. Once the truncated model was created, a CFA was conducted to assess model fit.
Method
The following sections present information about the participants and the procedure used in Study 1.
Participants
Participants were recruited from a university’s online research pool and Amazon Mechanical Turk (MTurk), a platform where users complete Human Intelligent Tasks (HITs) for monetary compensation. Participants were screened for video game players who played at least 5 hours a week within the last month. MTurk participants were required to have a HIT approval rate of 97% or greater; have at least 1,000 HITs approved; and be located in Canada, United States, or the United Kingdom. Participants who completed the study through the university’s online research pool received class credit, and those recruited through MTurk received $0.50 as compensation (Buhrmester et al., 2011).
A total of 419 valid surveys were collected by the end of the sampling period. Participant ages ranged from 18 to 72 (M = 35.11, SD = 11.63). There were 181 males, 236 females, and 2 who preferred to not answer. The total number of participants recruited from Amazon MTurk was 367, and 52 participants were from the university’s online research pool. A total of 268 unique games were analyzed, ranging in genres such as first-person shooters, role playing, puzzle, cards, and sports. Some examples of games included World of Warcraft, Fortnite, Candy Crush, and League of Legends.
Procedure
The survey was created with Qualtrics, an online survey creation website. Much like Phan et al. (2016), the questionnaire consisted of a consent form, demographics, and the standard GUESS items presented randomly and rated on a 7-point Likert scale (Strongly disagree to Strongly agree), and an overall satisfaction rating. Before seeing the GUESS items, participants were asked to identify a game that they had played at least 10 hours in the previous three months to evaluate. The study link was distributed on MTurk and through a university’s online research pool.
Results
The following sections present results for the configural model, the truncation process, and the initial 18-item model.
Configural Model
All analyses were conducted utilizing IBM SPSS AMOS 23.0. We assessed the fit of this configural model using Chi-square, TLI, CFI, and RMSEA fit indices (Byrne, 2016; Hu & Bentler, 1999). Table 2 provides a summary of each fit index, its range of acceptable scores, and the final outcomes from the original GUESS and the configural model. TLI and CFI both require a score above .95 to be considered excellent fit, while RMSEA requires a score below .08 for good fit and below .05 for excellent fit. The CFA appears to have acceptable levels of fit (Byrne, 2016; Hu & Bentler, 1999). In fact, the fit indices for this sample were equal to or in some cases marginally better than the original GUESS measure as reported in Phan et al. (2016). Given that the fit was satisfactory, we moved forward with truncation to reduce the number of items.
Table 2. Fit Indices for the Original 55-item GUESS, the Configural Model, and Initial 18-item Model
|
Model |
X2 |
Degrees of Freedom |
TLI (>.95) |
CFI (>.95) |
RMSEA (<.08/<.05) |
|
Original GUESS |
4,428.63b p < .001 |
1394 |
N/A |
.82 |
.053 a |
|
Configural Model |
2827.186 b p < .001 |
1391 |
.866 |
.875 |
.050 a |
|
Initial 18 Model |
171.966 b p < .001 |
99 |
.961a |
.975a |
.042 a |
|
a Indicates the value for the model is in the acceptable range of fit indices. b A significant Chi-square test is usually an indicator of poor fit. All Chi-square tests reported in this column were significant. Although it is standard to report Chi-square tests for CFA/SEM analyses, they are almost always significant due to large sample sizes. Therefore, other fit indices are provided that account for the large sample constraints of these techniques. |
|||||
Truncation
A priori to analysis, researchers (Keebler, Shelstad, and Chaparro) evaluated the original 55 items of the GUESS. This review was done independently with the goal of retaining items that best fit with the constructs of interest (DeVellis, 2016). Two items per dimension of the GUESS were selected to keep an equal number of items per construct. The final items decided by the team are shown in Table 5 (and in Appendix B).
Initial 18-item Model
We assessed the fit of the initial 18-item model using the same fit indices listed in Table 2 (Chi-square, TLI, CFI, and RMSEA fit indices). Based on the CFA, the initial 18-item model appears to have acceptable levels of fit (Byrne, 2016; Hu & Bentler, 1999). With an acceptable shortened model, we moved forward with a second study to collect a new sample of data with the 18-item scale to demonstrate cross-sample validity.
Study 2
The purpose of Study 2 was to conduct a CFA on a sample of data collected to validate the truncated version of the GUESS.
Method
The following sections present information about the participants and the procedure used in
Study 2.
Participants
The same process for recruitment of participants in Study 1 was used in Study 2. Participants were recruited from MTurk and a university’s online research pool. A screener survey was used to recruit video game players who played at least 5 hours a week within the last month. MTurk participants needed to meet the same requirements as in Study 1 with a HIT approval rate of 97% or greater, at least 1,000 HITs approved, and be located in Canada, United States, or the United Kingdom. Participants were compensated the same amount as in Study 1.
A total of 197 valid responses were collected for analysis with participant ages ranging from 18 to 68 (M = 33.21, SD = 10.90). Participants consisted of 97 males and 100 females with 164 participants recruited from MTurk and 33 from the university’s online research pool. A total of 128 unique games were analyzed, ranging in genres such as first-person-shooters, role playing, puzzle, cards, and sports. Some examples of games included Candy Crush, League of Legends, Call of Duty: Modern Warfare, and Overwatch.
Procedure
The same procedure process was followed as in Study 1. The survey was created with Qualtrics Online Survey Software and consisted of a consent form, demographics, and the standard GUESS items presented randomly and rated on a 7-point Likert scale (Strongly disagree to Strongly agree), and an overall satisfaction rating. Before seeing the GUESS items, participants were asked to identify a game that they had played at least 10 hours in the previous three months to evaluate. The study was distributed on MTurk and through the university’s online research pool.
Results
The following sections present the results of the final model, analysis of convergent and discriminant validity, and the scoring guidelines of the GUESS-18.
Final Model
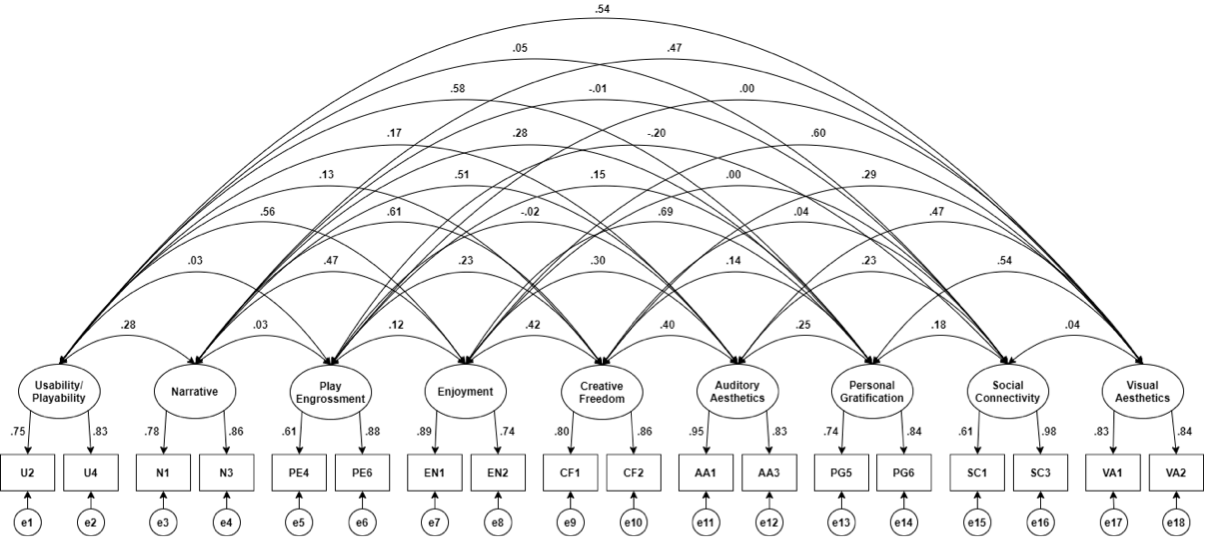
All analyses were conducted utilizing AMOS graphics 26.0. The final model is presented in Appendix A. We assessed the fit of the final 18-item scale using Chi-squared, TLI, CFI, and RMSEA fit indices (Byrne, 2016; Hu & Bentler, 1999). Table 3 provides a summary of each fit index; its range of acceptable scores; and the outcomes from the original GUESS, the configural model, and the final short item scale. Standardized regression weights are shown in Table 4.
Table 3. Fit Indices for the Original 55-item GUESS, the Configural model, Initial 18-item Model, and the Final 18-item Model
|
Model |
X2 |
Degrees of Freedom |
TLI (>.95) |
CFI (>.95) |
RMSEA (<.08/<.05) |
|
Original GUESS |
4,428.63 b p < .001 |
1394 |
NA |
.82 |
.053a |
|
Configural Model |
2827.186 b p < .001 |
1391 |
.866 |
.875 |
.050a |
|
Initial 18 Model |
171.966 b p < .001 |
99 |
.961a |
.975 a |
.042a |
|
Final GUESS-18 |
137.015 b p < .001 |
100 |
.961 a |
.974 a |
.043a |
|
a Indicates the value for the model is in the acceptable range of fit indices. b A significant Chi-square test is usually an indicator of poor fit. All Chi-square tests reported in this column were significant. Although it is standard to report Chi-square tests for CFA/SEM analyses, they are almost always significant due to large sample sizes. Therefore, other fit indices are provided that account for the large sample constraints of these techniques. |
|||||
Table 4. Standardized Regression Weights
|
Model |
Estimate |
|
U4 < Usability/Playability |
.834 |
|
U2 < Usability/Playability |
.745 |
|
N3 < Narratives |
.863 |
|
N1 < Narratives |
.784 |
|
PE6 < Play Engrossment |
.879 |
|
PE4 < Play Engrossment |
.610 |
|
En2 < Enjoyment |
.743 |
|
En1 < Enjoyment |
.886 |
|
CF2 < Creative Freedom |
.863 |
|
CF1 < Creative Freedom |
.802 |
|
AA3 < Audio Aesthetics |
.833 |
|
AA1 < Audio Aesthetics |
.954 |
|
PG6 < Personal Gratification |
.840 |
|
PG5 < Personal Gratification |
.743 |
|
SC3 < Social Connectivity |
.984 |
|
SC1 < Social Connectivity |
.611 |
|
VA2 < Visual Aesthetics |
.837 |
|
VA1 < Visual Aesthetics |
.827 |
Convergent and Discriminant Validity
We further assessed convergent and discriminant validity (see Table 6). We examined Average Variance Extracted (AVE) and Maximum Shared Variance (MSV) to determine construct validity. Together these assessments allow us to understand how well the metrics constructs that conceptually should be related are related (convergent validity) and how constructs that should not be related are unrelated (discriminant validity). The current short scale model appears to have excellent convergent validity, and no issues concerning discriminant validity were revealed. Items of the GUESS-18 are shown in Table 5.
It should be noted that one item is reverse coded (“I feel bored while playing the game”). To determine if respondents perhaps misinterpreted the scale for this negative-tone item, reliability analysis was conducted to identify any changes when the item was removed. Cronbach’s alpha for the total scale was .785, and .772 when the item was removed, which represents a marginal change. This demonstrates the item’s removal does not negatively affect scale reliability. Given this, it is important to measure constructs with more than one item due to mono-method bias (Shadish et al., 2002). Therefore, even though removing this item does not adversely affect overall scale reliability, it is important to retain to ensure the enjoyment construct is not being measured by solely one item. In addition, these items, once the reverse coded item was scored in the positive direction, are positively correlated in this data set. This is a good indication that individuals scored them in the same direction.
Scoring Guidelines of the GUESS-18
Like the full version of the GUESS, the GUESS-18 has a 7-point Likert scale with a response anchor at each rating point (e.g., 1 = Strongly Disagree, 5 = Somewhat Agree, and 7 = Strongly Agree). Statements can be randomized or presented as in Table 5. The ratings within each subscale are averaged to obtain a subscale score, and the composite score of video game satisfaction can be obtained by summing subscale scores together. For the composite score, the minimum value is 9 and the maximum value is 63. One item on both the GUESS and GUESS-18 will need to be reverse coded (i.e., “I feel bored while playing the game” in the Enjoyment subscale). See downloadable PDF and spreadsheet scoring calculator for a printable version of the instrument, scoring guidelines, and auto-calculation tool.
Table 5. Items of the GUESS-18
|
Constructs |
Statements |
|
Usability/Playability |
I find the controls of the game to be straightforward. |
|
I find the game’s interface to be easy to navigate. |
|
|
Narratives |
I am captivated by the game’s story from the beginning. |
|
I enjoy the fantasy or story provided by the game. |
|
|
Play Engrossment |
I feel detached from the outside world while playing the game. |
|
I do not care to check events that are happening in the real world during the game. |
|
|
Enjoyment |
I think the game is fun. |
|
I feel bored while playing the game. (REVERSE CODE) |
|
|
Creative Freedom |
I feel the game allows me to be imaginative. |
|
I feel creative while playing the game. |
|
|
Audio Aesthetics |
I enjoy the sound effects in the game. |
|
I feel the game’s audio (e.g., sound effects, music) enhances my gaming experience. |
|
|
Personal Gratification |
I am very focused on my own performance while playing the game. |
|
I want to do as well as possible during the game. |
|
|
Social Connectivity |
I find the game supports social interaction (e.g., chat) between players. |
|
I like to play this game with other players. |
|
|
Visual Aesthetics |
I enjoy the game’s graphics. |
|
I think the game is visually appealing. |
Table 6. Assessment of Discriminant and Convergent Validity
|
Subscale |
CR |
AVE |
MSV |
MaxR(H) |
|
Usability/Playability |
0.769 |
0.625 |
0.338 |
0.972 |
|
Narratives |
0.809 |
0.680 |
0.372 |
0.975 |
|
Play Engrossment |
0.722 |
0.572 |
0.055 |
0.977 |
|
Enjoyment |
0.800 |
0.669 |
0.475 |
0.987 |
|
Creative Freedom |
0.819 |
0.694 |
0.372 |
0.980 |
|
Audio Aesthetics |
0.890 |
0.802 |
0.256 |
0.984 |
|
Personal Gratification |
0.771 |
0.629 |
0.475 |
0.985 |
|
Social Connectivity |
0.794 |
0.671 |
0.054 |
0.969 |
|
Visual Aesthetics |
0.818 |
0.692 |
0.359 |
0.986 |
Table 7. Correlations Between the Nine Factors of the GUESS-18
|
Subscales |
Use/ Play. |
Narr. |
Play Engros. |
Enjoy. |
Creative Free. |
Audio Aest. |
Personal Grat. |
Social Con. |
Visual Aest. |
|
Usability/ Playability |
0.791 |
|
|
|
|
|
|
|
|
|
Narratives |
0.284 |
0.824 |
|
|
|
|
|
|
|
|
Play Engrossment |
0.030 |
0.027 |
0.757 |
|
|
|
|
|
|
|
Enjoyment |
0.560 |
0.466 |
0.123 |
0.818 |
|
|
|
|
|
|
Creative Freedom |
0.132 |
0.610 |
0.234 |
0.417 |
0.833 |
|
|
|
|
|
Audio Aesthetics |
0.170 |
0.506 |
-0.016 |
0.301 |
0.400 |
0.896 |
|
|
|
|
Personal Gratification |
0.581 |
0.283 |
0.151 |
0.689 |
0.140 |
0.251 |
0.793 |
|
|
|
Social Connectivity |
0.047 |
-0.012 |
-0.199 |
0.004 |
0.038 |
0.232 |
0.178 |
0.819 |
|
|
Visual Aesthetics |
0.539 |
0.472 |
0.000 |
0.599 |
0.290 |
0.472 |
0.038 |
0.038 |
0.832 |
| Note. Numbers on the diagonal represent the squared correlation of that factor with its manifest variables. | |||||||||
Conclusion
Results of this analysis show that the shortened version of the GUESS provides a strong measurement model for the analyzed data. This indicates a well-fitting model of game user satisfaction that assesses nine constructs and can be measured with an 18-item survey. In the following sections, we discuss the theoretical and practical implications of this research, followed by suggestions for future work.
Theoretical Implications
This research offers further support for the GUESS metric’s constructs as important contributors to game players’ experience. The initial configural model using the full item set had reasonable fit, while the smaller scale, surprisingly, had even better fit. Further, tests of construct validity showed excellent convergent and discriminant validity across almost all assessed constructs. These indicators demonstrate that the theoretical model of the GUESS is sound regarding its measurement and stability across variations in samples and items, which are key indicators of external validity.
Practical Implications and Future Work
The GUESS-18 is less than half the length of the original. The full GUESS takes, on average, 10–15 minutes to complete, while the GUESS-18 takes approximately 3–5 minutes. While the full GUESS is still recommended for single game evaluation purposes due to increased detail from the 37 extra items, the GUESS-18 may be more appropriate as a measure of satisfaction during iterative game design and development where responses are needed quickly or in rapid succession. In addition, the GUESS-18 may be more appropriate when there are a variety of other measures also being used and survey fatigue may be a concern.
Future research should be conducted to assess the effect of administering the GUESS-18 multiple times in a single session. Future work should investigate if the GUESS-18 holds constant across a variety of games, gameplay, and player types. The GUESS 18 also has potential to other related environments such as simulations, serious games, and gamified educational technologies where long surveys are simply not a feasible option due to organizational constraints. Finally, research needs to be conducted to investigate other factors and how they relate to GUESS scores such as the examination of design characteristics (e.g., cooperative, competitive, virtual reality elements) of a given game and gameplay behaviors (e.g., continuance of play, purchase of items within a game).
Tips for Usability Practitioners
The following are tips for usability practitioners considering using the GUESS-18 discussed in this paper:
- When assessing user reactions to video games, practitioners should employ a validated scale that explores the multi-faceted nature of satisfaction.
- Understanding how the constructs of usability, enjoyment, engrossment, narrative, creativity, personal gratification, social connection, and audio/visual aesthetics contribute to how a player perceives a video game can be very helpful to game developers to appease their target audiences and to attract new players.
- The GUESS-18 can be completed in as little as a few minutes and can be used to assess game perceptions over time or for cross-game comparisons. Practitioners are encouraged to use the downloadable PDF and spreadsheet scoring calculator accompanying this article to quickly administer and summarize the GUESS-18 scores.
References
Brooke, J. (1996). SUS-A quick and dirty usability scale. In P. W. Jordan, B. Thomas, B. A. Weerdmeester, and I. L. McClelland (Eds.), Usability evaluation in industry (189–194). Taylor & Francis.
Buhrmester, M., Kwang, T., & Gosling, S. D. (2011). Amazon’s Mechanical Turk: A new source of inexpensive, yet high-quality, data? Perspectives on Psychological Science, 6(1), 3–5. https://doi.org/10.1177/1745691610393980
Byrne, B. M. (2016). Structural equation modeling with AMOS: Basic concepts, applications, and programming (3rd ed.). Routledge.
DeVellis, R. F. (2016). Scale development: Theory and applications (4th ed.). Sage Publications.
Ermi, L., & Mäyrä, F. (2005). Fundamental components of the gameplay experience: Analysing immersion In S. De Castell & J. Jenson. (Eds.), Worlds in play: International perspectives on digital games research. 37–53. Peter Lang Publishing Inc.
Entertainment Software Association. (2019). 2019 Essential facts about the computer and video game industry. Entertainment Software Association. Retrieved from https://www.theesa.com/wp-content/uploads/2019/05/ESA_Essential_facts_2019_final.pdf
Hu, L. T., & Bentler, P. M. (1999). Cutoff criteria for fit indexes in covariance structure analysis: Conventional criteria versus new alternatives. Structural Equation Modeling: A Multidisciplinary Journal, 6(1), 1–55. https://doi.org/10.1080/10705519909540118.
Ibarra, F., Baez, M., Fiore, F., & Casati, F. (2018, May). Designing for co-located and virtual social interactions in residential care. In Proceedings of the 2018 ACM Conference Companion Publication on Designing Interactive Systems (pp. 129–134). Hong Kong, China: ACM. https://doi.org/10.1145/3197391.3205424
IJsselsteijn, W., De Kort, Y., & Poels, K. (2013). The Game Experience Questionnaire. Eindhoven: Technishe Universiteit Eindhoven. Retrieved from https://pure.tue.nl/ws/files/21666907/Game_Experience_Questionnaire_English.pdf
Jennett, C., Cox, A. L., Cairns, P., Dhoparee, S., Epps, A., Tijs, T., & Walton, A. (2008). Measuring and defining the experience of immersion in games. International Journal of Human-Computer Studies, 66(9), 641–661. https://doi.org/10.1016/j.ijhcs.2008.04.004
Johnson, D., Gardner, M. J., & Perry, R. (2018). Validation of two game experience scales: The player experience of need satisfaction (PENS) and game experience questionnaire (GEQ). International Journal of Human-Computer Studies, 118, 38–46. https://doi.org/10.1016/j.ijhcs.2018.05.003
Manero, A., Sparkman, J., Dombrowski, M., Buyssens, R., & Smith, P. A. (2018, July). Developing and training multi-gestural prosthetic arms. In International Conference on Virtual, Augmented and Mixed Reality (pp. 427–437). Springer, Cham. https://doi.org/10.1007/978-3-319-91581-4_32
Martin, A., Farines, J., Paliyawan, P., & Thawonmas, R. (2019). Dancing ICE: A rhythm game to control the amount of movement through pre-recorded healthy moves. In MIG ’19: Motion, Interaction and Games (pp. 1–2). Newcastle upon Tyne, UK: ACM. https://doi.org/10.1145/3359566.3364691
Pallavicini, F., & Pepe, A. (2019, October). Comparing player experience in video games played in virtual reality or on desktop displays: Immersion, flow, and positive emotions. In Extended Abstracts of the Annual Symposium on Computer-Human Interaction in Play Companion Extended Abstracts (pp. 195–210). ACM. https://doi.org/10.1145/3341215.3355736
Phan, M. H., Keebler, J. R., & Chaparro, B. S. (2016). The development and validation of the game user experience satisfaction scale (GUESS). Human Factors, 58(8), 1217–1247. https://doi.org/10.1177/0018720816669646
Ryan, R. M., Rigby, C. S., & Przybylski, A. (2006). The motivational pull of video games: A self-determination theory approach. Motivation and Emotion, 30(4), 344–360. https://doi.org/10.1007/s11031-006-9051-8
Shadish, W. R., Cook, T. D., & Campbell, D. T. (2002). Experimental and quasi-experimental designs for generalized causal inference. Houghton Mifflin Company.
Shelstad, W. J., Smith, D. C., & Chaparro, B. S. (2017, September). Gaming on the rift: How virtual reality affects game user satisfaction. In Proceedings of the Human Factors and Ergonomics Society Annual Meeting (Vol. 61, No. 1, pp. 2072–2076). SAGE Journals. https://doi.org/10.1177/1541931213602001
Smith, P. A., Dombrowski, M., Buyssens, R., & Barclay, P. (2018a). The impact of a custom electromyograph (EMG) controller on player enjoyment of games designed to teach the use of prosthetic arms. The Computer Games Journal, 7(2), 131–147. https://doi.org/10.1007/s40869-018-0060-0
Smith, P. A., Dombrowski, M., Buyssens, R., & Barclay, P. (2018b, May). Usability testing games for prosthetic training. In 2018 IEEE 6th International Conference on Serious Games and Applications for Health (SeGAH; pp. 1–7). IEEE. https://doi.org/10.1109/SeGAH.2018.8401376
SteamSpy. (2020). Games released in previous months. Retrieved from https://steamspy.com/year/
Takahashi, D. (2020, May 8). Newzoo: 2.7 billion gamers will spend $159.3 billion on games in 2020. VentureBeat. Retrieved from https://venturebeat.com/2020/05/08/newzoo-2-7-billion-gamers-will-spend-159-3-billion-on-games-in-2020/
Warmelink, H., Mayer, I., Weber, J., Heijligers, B., Haggis, M., Peters, E., & Louwerse, M. (2017, October). AMELIO: Evaluating the team-building potential of a mixed reality escape room game. In Extended Abstracts Publication of the Annual Symposium on Computer-Human Interaction in Play (pp. 111–123). ACM. https://doi.org/10.1145/3130859.3131436
Wijman, T. (2018, April 20). Mobile revenues account for more than 50% of the games market as it reaches $137.9 billion in 2018. NewZoo. Retrieved from https://newzoo.com/insights/articles/global-games-market-reaches-137-9-billion-in-2018-mobile-games-take-half/
Yang, X., Sadika, E. D., Pratama, G. B., Choi, Y., Kim, Y. K., Lee, J. Y., … & Ko, M. H. (2019). An analysis on serious games and stakeholders’ needs for vocal training game development. Communication Sciences & Disorders, 24(3), 800–813. https://doi.org/10.12963/csd.18531
Yildirim, C., Carroll, M., Hufnal, D., Johnson, T., & Pericles, S. (2018, August). Video game user experience: To VR, or not to VR? In 2018 IEEE Games, Entertainment, Media Conference (GEMI; pp. 1–9). IEEE.
Appendix A. Final GUESS-18 Model
Appendix B. Items of the GUESS-18
|
Constructs |
Statements |
|
Usability/Playability |
I find the controls of the game to be straightforward. |
|
I find the game’s interface to be easy to navigate. |
|
|
Narratives |
I am captivated by the game’s story from the beginning. |
|
I enjoy the fantasy or story provided by the game. |
|
|
Play Engrossment |
I feel detached from the outside world while playing the game. |
|
I do not care to check events that are happening in the real world during the game. |
|
|
Enjoyment |
I think the game is fun. |
|
I feel bored while playing the game. (REVERSE CODE) |
|
|
Creative Freedom |
I feel the game allows me to be imaginative. |
|
I feel creative while playing the game. |
|
|
Audio Aesthetics |
I enjoy the sound effects in the game. |
|
I feel the game’s audio (e.g., sound effects, music) enhances my gaming experience. |
|
|
Personal Gratification |
I am very focused on my own performance while playing the game. |
|
I want to do as well as possible during the game. |
|
|
Social Connectivity |
I find the game supports social interaction (e.g., chat) between players. |
|
I like to play this game with other players. |
|
|
Visual Aesthetics |
I enjoy the game’s graphics. |
|
I think the game is visually appealing. |
[:]