
Abstract
This study reports on the usability of three commercially available electronic card sort applications (CardZort, WebSort, and OpenSort) by researchers (Study 1) and by end users (Study 2). Both groups of participants conducted a series of tasks representative of their user group with each program. Researchers focused on the set up and analysis of an open card sort exercise while end user participants conducted an open card sort. Task success, completion time, perceived difficulty, user satisfaction, and overall preference data was gathered for all participants. Results indicate different preferences for the two user groups. Researcher participants preferred WebSort for creating and analyzing the card sort, and end user participants preferred OpenSort for completing the card sort exercise. Usability issues related to each program are discussed.
Practitioner’s Take Away
- It is important to test the usability of electronic card sorting programs with both end users and researchers. They have different needs and opinions as to which program is best. End users prefer the dynamic nature and ease of use of OpenSort while researchers prefer the easy set up and result analysis of WebSort.
- The most important functions to researchers are being able to quickly (a) import lists of items from other applications (i.e., word processor) for study set up and (b) import user data for analysis.
- The most important functions to end users are (a) intuitive drag-and-drop of the cards, (b) simultaneous group naming, and (c) being able to see all cards and groups at once.
- This study was limited to a simple card sort for end users and to a basic set up and analysis for the researcher. The results may vary when more complicated sorts and analyses are attempted.
- Practitioners need to consider the test environment when deciding which program to use. Ease of use for end users, for example, may be more critical when testing remotely.
- There are other electronic card sort tools available that were not included in this study. More evaluations like this are needed!
Introduction
Card sorting is a popular technique used in the areas of information architecture, cognitive psychology, and cognitive anthropology to capture mental models of how participants organize information. Card sorting is also used to help define a website structure or software application menu structure because it explores how users conceptually organize information. To conduct a card sort, participants are given a stack of index cards each containing an informational item to be sorted. They are asked to group the cards into categories that make sense to them and to name the groups they create. They may then refine their groups by subdividing any large groups into smaller subgroups or combining small groups. Participants work individually or in small groups to sort the information. This grouping data is gathered across many participants and summarized using either cluster analysis techniques or frequency analyses of item groupings. These results are then used to generate an overall structure of the information. For software and website content, the results also lead to suggestions for navigation, menus, and possible taxonomies (see Courage and Baxter, 2005, for a detailed overview of card sorting).
While card sorting has traditionally been conducted using physical cards, computer and web-based card sorting (hereafter, referred to as electronic card sorting) applications are becoming a popular alternative. Electronic card sorting has several advantages over physical card sorting, which include the following advantages (Zavod, Rickert, & Brown, 2002):
- Electronic distribution that can sample a wide range of participants
- Reduced physical space requirements
- Real-time data entry
- Quick generation of output in the form of dendrograms or tree charts
No significant differences have been demonstrated between manual and electronic card sorts in terms of accuracy, test-retest reliability, and number of categories generated by participants (Harper & Van Duyne, 2002) or for closed card sort results (Bussolon, Russi, & Del Missier, 2006). However, electronic card sorts with first-time users have been demonstrated to take longer than manual card sorts, although this time decreases with subsequent uses of the application (Harper & Van Duyne, 2002).
In spite of its advantages, one important aspect of electronic card sorting that has not received much attention in the literature is the usability of the card sort applications themselves. There are two primary populations involved in the use of a card sort application: the researchers, who organize the card sort and analyze the data; and the end users, who participate in the actual card sort exercise. Each user group has different needs though usability is very important to each. Researchers want a program that allows quick creation of card sets and easy access to data for analysis and reporting. End users need a program that provides an intuitive interface, easy manipulation of cards, and a simple way to name the card groups. Given that an electronic card sort activity can be widely distributed via the Internet, it is possible that the researcher and the end user may never interact face-to-face. Therefore, the intuitiveness of the program is extremely important to insure quality data collection.
There are many electronic card sorting applications available to practitioners today. A summary of these programs are provided in Table 1.
| Program (URL) | Platform | Availability |
|---|---|---|
| CardZort (www.cardzort.com) |
Windows | Commercial product |
| WebSort (www.websort.net) |
Web-based | Commercial service |
| OpenSort (www.themindcanvas.com) |
Web-based | Commercial service |
| OptimalSort (www.optimalsort.com) |
Web-based | Commercial service |
| SynCaps (www.syntagm.co.uk/design/syncapsv2.shtml) |
Windows | Commercial product |
| xSort (www.ipragma.com/xsort) |
MAC OS X | Commercial product |
| WebCAT (zing.ncsl.nist.gov/WebTools/WebCAT/) |
Windows UNIX | Free |
| USort/EZCalc (IBM)1 |
Windows | Free but now archived, no longer supported |
The purpose of this study was to examine the usability of electronic card sorting programs from the perspective of the researcher and the end-user. A two-part study investigating the first-time usage of three electronic card sort programs for an open card sort was conducted. Study 1 examined the usability of the applications from the researcher perspective, and Study 2 examined the usability of the applications from the end user perspective.
The three card sorting applications evaluated were the following:
- CardZort (www.cardzort.com), a Windows™ application
- WebSort (www.websort.net), a web-based application
- OpenSort (www.themindcanvas.com), a web-based application
Study 1
Study 1 examined the usability of the three card sorting
applications from a researchers’ perspective. The term
researcher is used to describe academicians and practitioners who
use card sorting methodology. These users typically are involved in the set
up stages of the card sort study and the analysis portion once the card sort
data is collected.
Methods
The following sections provide information about the
participants, materials, and procedure used in this study.
Participants
Eight participants, ranging between 23 and 36 years of age
(M= 29), volunteered for this study. Three male and five female participants
were recruited from a doctoral Human Factors graduate program in a
Midwestern university. Participants were selected based on their experience
using the card sorting technique to aid in information architecture design.
All had conducted card sorts with physical index cards and had used the
electronic card sort program USort/EZCalc. All participants were frequent
computer and Internet users but none were familiar with any of the card sort
programs evaluated.
Materials
One Pentium-class computer running Windows XP at 1024 x
768 resolution was used to run the study. Participants were digitally
recorded using a Web camera and the software program Morae™ 2.0 to capture
and combine both the video footage and the on-screen events of the
application for each task. In addition, Morae™ was used to gather
performance data, including time on task and navigation for each
participant. Two of the card sort programs were web-based (OpenSort and
WebSort) and accessed via a campus network T1 line. The third application,
CardZort, was a Windows application and was accessed directly from the test
computer.
Procedure
Participants were asked to complete a background
questionnaire regarding their computer and Internet habits. They were then
asked to complete a series of four tasks representative of those that
researchers typically perform when creating and analyzing results for a card
sort study. The tasks were as follows:
- Enter a prescribed list of 35 items to create a card set for an open card sort exercise.
- Find the results from the card sort study to analyze (the participants were told to assume that the study was concluded, despite the fact that they just completed the task to set up the cards).
- Download and view the results.
- Interpret the results.
All participants completed the tasks for all three
programs. The tasks were presented in sequential order while the order of
the card sort programs was counterbalanced across participants. After each
task, the participants were asked to provide a difficulty rating (1 = Very
Easy and 5 = Very Difficult) of completing that task. After all tasks were
finished for a program, participants were asked to complete a satisfaction
survey (Brooke, 1996) and discuss what they liked and disliked about the
card sort program. Measures of task success and time-on-task were collected
for Tasks 1-3. Qualitative comments were gathered for Task 4, which asked
them to interpret the results. OpenSort offered three methods of viewing the
results while WebSort and CardZort only offered one. Participants entered a
different list of 35 items for each program (Task 1) and the appropriate
results were made available for Task 2. After completing the card sort tasks
with all applications, participants were asked to rank their preference of
the programs.
Results
The following sections discuss task success, task
difficulty ratings, task completion time, satisfaction scores, and
preference rankings.
Task success
Success rates for each task by program are presented in
Table 2. All participants were successful in completing all but two of the
tasks. Users had trouble completing the task to set up a card set in
OpenSort and the task to find the data to analyze in CardZort.
| Task | CardZort | WebSort | OpenSort |
|---|---|---|---|
| Enter items to create a card set | 100% | 100% | 12.50% |
| Set up and Find where to analyze the results | 62.50% | 100% | 100% |
| Create and download results output | 100% | 100% | 100% |
Task difficulty ratings
Mean difficulty scores for each task by program are
presented in Table 3 and summarized in Figure 1. A two-way within subjects
ANOVA (task x program) was conducted to compare the average difficulty
across tasks and applications. Results indicate a significant main effect of
application F(1.1, 28) = 10.54, p = .01, partial η2 = .60
(Greenhouse-Geisser correction applied), a significant main effect of task
F(2,28) = 7.96, p < .01, partial η2 = .53, and no interaction.
Post-hoc comparisons revealed that participants rated the tasks with
CardZort and OpenSort to be significantly more difficult than WebSort. In
addition, they rated the task of creating the card sort to be significantly
more difficult than the task to download the results output.
| Task | CardZort | WebSort | OpenSort |
|---|---|---|---|
| Enter items to create a card set | 3.0 (1.60) | 1.37 (.52) | 3.6 (1.51) |
| Set up and Find where to analyze the results | 2.0 (.93) | 1.12 (.35) | 3.0 (1.31) |
| Create and download results output | 1.87 (1.13) | 1.0 (0) | 1.7 (1.04) |
| Average (SD) | 2.29 (.95) | 1.17 (.25) | 2.79 (.67) |
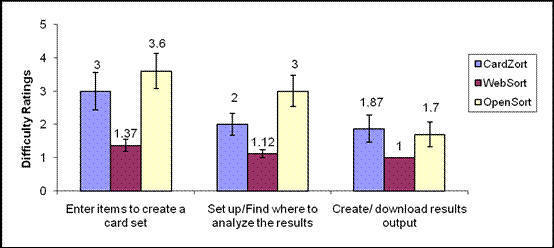
Figure 1. Perceived task difficulty across applications.
Task completion time
Time-on-task was
measured in seconds, from the start to the end of each task. Figure 2 shows
a breakdown of total task time by application. A two-way within subjects
ANOVA (task x program) was conducted to compare time across tasks and
application. Results showed a main effect of program, F(2,14) = 31.53, p <
.01, partial η2 = .82, a main effect of task, F(1.06, 15.21) = 42.78, p <
.01, η2 = .86, and a significant program by task interaction, F(4,28) =
13.69, p < .01, η2 = .66. Post-hoc comparisons revealed that participants took significantly
less time with WebSort overall than OpenSort and CardZort. Examination of
the interaction showed that this difference was primarily due to the longer
time to create the card set and to set up the data for analysis in CardZort
and OpenSort (see Figure 2).
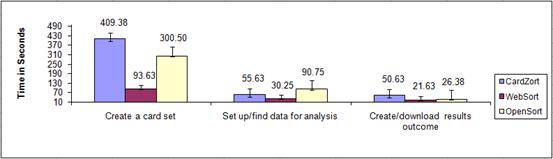
Figure 2. Task completion times across applications.
Satisfaction scores
Satisfaction was measured using the 10-item System
Usability Scale (Brooke, 1996) that is summarized by a total score out of
100. A one-way within subjects ANOVA revealed significant differences in
satisfaction across applications, F(2, 14) = 5.07, p < .05, partial η2 = .42. Post-hoc comparisons revealed that participants were more satisfied
with WebSort than OpenSort. Mean satisfaction scores for each application
are summarized in Figure 3.
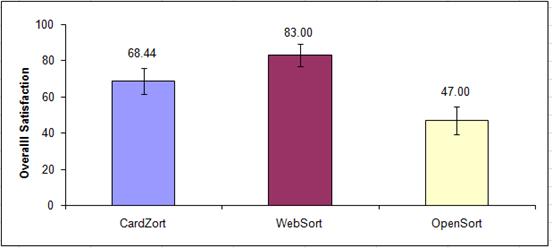
Figure 3. Mean satisfaction scores across applications.
Preference rankings
All but one participant chose WebSort as the most
preferred card sort application (Figure 4). Preference differences across
applications were analyzed using a Friedman’s
Chi Square, X2 (2,
N = 8) = 6.75,p< .05. Post-hoc tests showed that WebSort was more preferred than
both CardZort and OpenSort (mean rank = 1.25, 2.37, and 2.37 respectively).
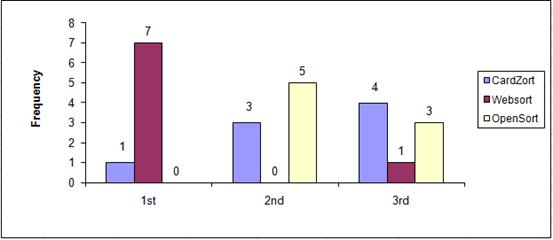
Figure 4. Application preference ranking: Each bar represents the number of participants that chose that application first, second, or third.
Interpretation of Card Sort Results
Task 4 required participants to look at sample results of
an open card sort and to interpret the results. All programs offer the
standard dendrogram (tree diagram) to display the results. OpenSort offers
two additional methods. These include a Vocabulary Browser and a Similarity
Browser (see
http://www.themindcanvas.com/demos/ for examples). Users explored all of
the methods but reported that the dendrogram provided the best summary.
Participants reported that the OpenSort dendrogram had the most professional
look and was the easiest to use of the three applications. They liked the
use of color to differentiate each cluster of items and the ability to
directly manipulate the number of groups. Users found the WebSort dendrogram
to appear less professional in its design, to show little differentiation
across groups, and to lack instruction as to how the data was analyzed. The
CardZort dendrogram was reported to also lack detailed explanation of how
the data was analyzed (i.e., single, average, and complete linkage analyses)
and no group name analysis.
Discussion
The following sections discuss the WebSort, OpenSort, and
CardZort applications.
WebSort
Researchers reported WebSort as the card sorting
application that was the easiest to use, most satisfying, and most preferred
overall (despite the inferior dendrogram). Participants found the user
interface to be very intuitive for setup and analysis. Some of the features
they liked the best were the ability to copy and paste and import lists of
items into the application to create a card set and the clear instructions
for creating studies and analyzing results. Figure 5 shows the main WebSort
screen used by researchers to set up a study. The tabs across the top of the
screen clearly outline the phases of a card sort study. Users found it easy
to paste an existing list into the Items list and edit the sorting
instructions. They also found it easy to import their study data and view
the resulting dendrogram.

Figure 5. WebSort study setup screen.
OpenSort
Participants had the most difficulty creating and setting
up the card sort exercise in OpenSort. This was due to two reasons. First,
after the new study was created, it appeared within a list of studies
(Figure 6). All users clicked on their study title to begin editing it, but
instead of seeing the study settings they saw a preview of the actual card
sort study (as end users would see it). They found this to be confusing.
Further examination of the study screen revealed a separate Edit Study link
for editing. Participants reported that their first instinct was to simply
click on the study title for this purpose. Second, participants were
confused how to enter the 35 card items. An open card sort is one of many
types of exercises available as part of the MindCanvas tool. Users are
presented with eleven different question types when they first create their
study including multiple choice, display, open text, OpenSort, multi text,
etc. Users had to choose OpenSort before they could add their card items
(some participants had to be told to choose OpenSort to continue). They also
had to enter the 35 items one at a time as there was no apparent way to
paste or import them from an existing text list to create the card set. (It
should be noted that pasting items into the question type field was possible
but it was not intuitive and only one user discovered how to do this.) As a
result, participants found this task to be cumbersome and time-consuming.
Finding the results to analyze was also reported to be a
bit cumbersome in OpenSort because participants sometimes overlooked the
Download data link (underscored number, Figure 6) and instead clicked on
another link (i.e., Manage Study or Study Title) to find this information.
To see actual results, MindCanvas requires its users to first request a
results download, wait for the results to appear on the site, and then
download and extract the results from a ZIP file. MindCanvas does not create
dendrograms of results immediately but does so upon request of the
researcher (there is typically a separate fee for these reports). They do,
however, provide the raw data of each participant sort in an Excel-ready
format, which allows researchers to run their own analyses if they so
desire. For the purposes of this study, participants were shown samples of
the three result analyses provided by MindCanvas: the dendrogram, the
Vocabulary Browser, and the Similarity Browser. Participants liked the
professional appearance of the dendrogram, in particular, when compared to
the other applications.
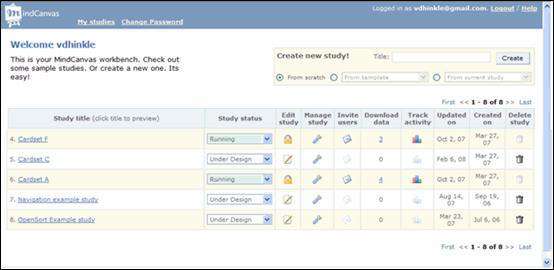
Figure 6. OpenSort set up and editing screen.
CardZort
Participants spent some time browsing CardZort to figure
out how to create a card set. The File>New menu option prompted them for a
card style (text only, text and description) but did not provide any
instructions on how to start adding cards. Users had to select the Card>New
menu option or the corresponding toolbar icon to add a new card. Like
OpenSort, participants were unable to find a way to paste or import the card
set items into CardZort and had to type the 35 items individually. Also,
shortcuts to create new cards used hot keys that users reported to be not
very intuitive. For example, the shortcut to create a New card was the
Insert key and to Edit a card was the Enter key.
Setting up data for analysis was also reported to be
somewhat difficult in CardCluster (the analysis portion of CardZort) because
the menu functions were inconsistent with user expectations. In order to run
an analysis of the data, participants had to first import individual data
files. The File menu option displayed a list of functions for opening or
saving projects but not to create a new project. To start a new project,
users had to select the File>Add Exercise menu option or click on the
corresponding plus sign (+) icon. The alt. tag for this icon read “Adds a
sorting exercise (.cz file) for analysis” (Figure 7). Participants found the
term “sorting exercise” to be confusing when initially trying to set up a
new project and when looking for individual participant data.
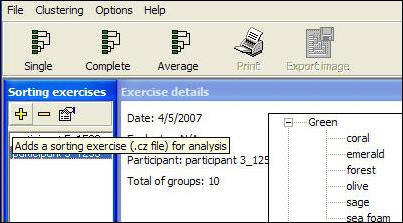
Figure 7. CardZort analysis setup screen.
Study 1 Summary
Results from Study 1 indicate that WebSort was the most
preferred application from the researchers’ perspective because of its
overall ease of use for study set up and analysis. Results also demonstrate
some deficiencies in the design of the two other electronic card sorting
applications. In particular, fast and convenient study set up and clear menu
functions for data analysis are two features that were lacking. It seems
that for CardZort users were expecting the functionality to be similar to
that of other Windows-based applications (including copy and paste
functionality or new file setup). Likewise, users expected the link
functionality in OpenSort and WebSort to be similar to that encountered in
other websites. Several inconsistencies with these expectations were
encountered in both CardZort and OpenSort.
It should be reiterated that this study examined
first-time usage of the card sorting applications among researchers. There
were several features of OpenSort, in particular, that were not evaluated
because they were not available in the other two programs. In general,
OpenSort offered the most options for researchers and it is possible that
with continued use, this program may rate higher than what was reported with
first-time usage.
Study 2: Usability and the End User
Study 2 examined the usability of the same three card
sorting applications from the end user perspective. The term
end user is used to describe the participants of a card sort
activity. These users typically know little, if anything, about card sorting
but are representative of the target audience for the information being
sorted. They are typically asked to group the information reflected on cards
in a way that makes sense to them.
Methods
The following sections provide information about the
participants, materials, and procedure used in this study.
Participants
Eight participants, four male and four female, ranging
between 23 and 43 years of age (M= 29), volunteered for this study.
Participants were recruited from undergraduate classes at a Midwestern
university and its local community. Seventy-five percent of the participants
reported using computers for school related activities, communication with
others (not including e-mails), and using the Internet, and 87% reported
using the Internet for education and gathering information for personal
needs.
Materials
The programs, perceived difficulty, and satisfaction
surveys used in this study were the same as those used in Study 1. In
addition, three 35-item lists served as the items to be sorted in the open
card sort. The lists were composed of (a) names of zoo animals, (b) names of
colors, and (c) names of fruits and vegetables. Pilot tests were conducted
to insure the lists were of equal difficulty to sort. The 35-item lists were
representative of what may be used in a small card sort exercise. This size
was chosen so that each user could complete a sort with each program in a
single one-hour session.
Procedure
All participants were asked to complete a background
questionnaire regarding their computer and Internet habits. They were then
asked to complete a series of four tasks representative of those users
typically perform in an electronic open card sort. Participants completed an
open card sort with each application with the tasks as follows:
- Sort the cards into groups.
- Name the groups.
- Move any two items from any group(s) to any other group(s).
- Indicate through the program that you are finished with the sorting session.
All participants completed the tasks for all three
programs. The tasks were presented in sequential order while the order of
the card sort programs and the prescribed card list were counterbalanced
across participants. After each task, the participants were asked to provide
a difficulty rating (1 = Very Easy and 5 = Very Difficult) of that task.
After all tasks were completed for a program, participants were asked to
complete a satisfaction survey (Brooke, 1996) and discuss what they liked
and disliked about the card sort program. Measures of task success and
time-on-task were collected for each task. After completing all tasks with
all applications, participants were asked to rank their preference of the
programs.
Results
The following sections discuss task success, task
difficulty, task completion time, satisfaction scores, and preference
rankings.
Task success
All participants were successful on all tasks with all
programs.
Task difficulty
Mean difficulty scores for each task by program are
presented in Table 4 and summarized in Figure 8. A two-way within subjects
ANOVA (task x program) was conducted to compare the average difficulty
across tasks and applications. Results indicate a significant main effect of
application, F(2,14) = 9.90, p <.01, η2 =.59, but no main effect
of task and no interaction. Post-hoc comparisons revealed that CardZort was rated significantly more
difficult overall than Opensort and WebSort. It should be noted that while
there was a difference across programs, all difficulty ratings were fairly
low indicating that the participants were able to complete the tasks with
relative ease.
| Task | CardZort | WebSort | OpenSort |
|---|---|---|---|
| Sort items into groups. | 2.00 (1.07) | 1.88 (.64) | 1.00 (.00) |
| Name the groups. | 2.13 (.99) | 1.13 (.35) | 1.38 (1.06) |
| Move items from any group to another group. | 2.13 (.83) | 2.00 (1.07) | 1.00 (.00) |
| Complete the sorting session. | 1.50 (1.50) | 1.00 (.00) | 1.50 (.76) |
| Tasks Average | 1.94 (.56) | 1.50 (.38) | 1.22 (.28) |
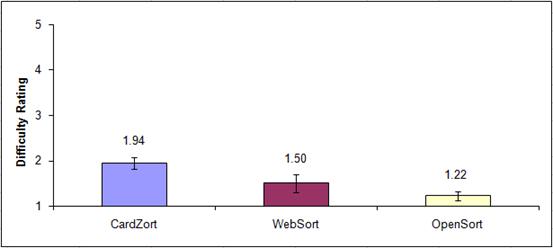
Figure 8. Mean task difficulty across applications.
Task completion time
Time-on-task was measured in seconds, from the start to
end of each task and averaged across all participants for each application.
A two-way within subjects ANOVA (task x program) was conducted to compare
total time across tasks and application. Results showed no main effect of
program, task, or any interaction.
Satisfaction
Satisfaction was measured using the 10-item System
Usability Scale (Brooke, 1996) that provides a total score out of 100. A
one-way within subjects ANOVA revealed significant differences between the
scores, F(2, 14) = 5.88, p= .014, η2 =.46. Post-hoc tests
revealed that participants were more satisfied with OpenSort than WebSort
(Figure 9).
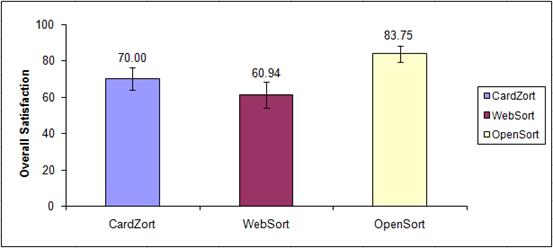
Figure 9. Mean satisfaction scores across applications.
Preference
Participants unanimously chose OpenSort as the most
preferred card sort application (Figure 10). Preference differences across
applications was analyzed using a Friedman’s Chi Square, X2 (2,
N = 8)= 12.25, p< .01. Post-hoc tests showed that OpenSort was more preferred than
WebSort (mean rank = 1.0 and 2.62, respectively).
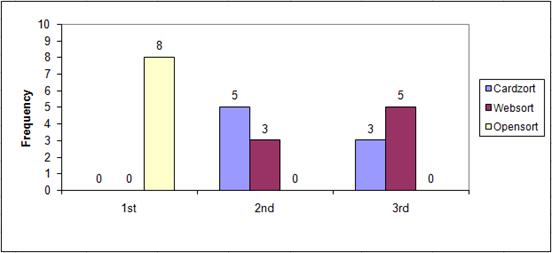
Figure 10. Application preference ranking: Each bar represents the number of participants that chose that application first, second, or third.
Discussion
OpenSort was found to be the card sorting application that
was the least difficult to use, most satisfying, and most preferred.
CardZort was reported to be the most difficult program to use, but WebSort
was preferred the least. The following sections discuss usability issues
that were discovered for each program.
OpenSort
Figure 11 shows the main sorting screen for OpenSort, the
most preferred application. Users found the direct manipulation of the cards
and group naming to be very easy and intuitive. Users also liked the
realistic look of the online cards and the dynamic manner in which the cards
were “dealt” onto the screen. This dynamic feature added an element of “fun”
to the exercise.
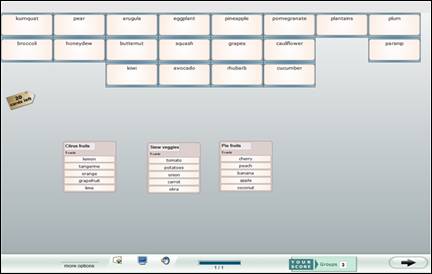
Figure 11. OpenSort user interface (www.themindcanvas.com).
Despite this, there were several interactions with the
application that they found to be somewhat confusing. Before going to the
sorting screen, participants were presented a preview screen that showed how
the interface would look while they were sorting. It was not clear to the
participants that this was an example and not the actual sorting screen.
Several participants tried to drag the cards on this page and were
frustrated when they couldn’t move anything. It was unclear to them that
they had to proceed to the next screen in order to begin the sorting
exercise.
In addition, users found the graphical icons at the bottom
of the screen to be unclear (e.g., proceed to next page, help). There were
no textual instructions on the preview screen how to proceed to the sort
other than the arrow button in the bottom right of the screen. Likewise,
access to help was available at the bottom of the sorting screen via a
computer monitor icon, which participants did not recognize as a help link.
Users found it easy to combine groups and subdivide larger
groups with OpenSort. This was also the only program that offered online
Help while sorting. Those that found the help, however, were disappointed to
find that this information was only available in the form of viewable demos
that had to be watched in their entirety. Participants expressed that they
would have preferred the option of a text-based help section instead.
CardZort
Figure 12 shows a sample sorting screen for CardZort.
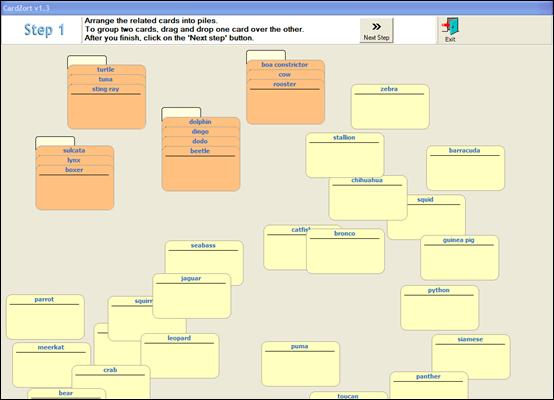
Figure 12. CardZort user interface (www.cardzort.com).
Users found the cards to be difficult to drag and drop to
form groups in CardZort. In particular, when moving a card to a group, users
had to be very precise with their mouse cursor placement. If the cursor was
on the edge of the card being moved and was outside of the border of the
group in which it was to be included, then the new card was placed behind
the intended group and was obscured or completely hidden.
Users also found it frustrating that they had to complete
all of the sorting before they could name any of their groups. When creating
a group for the first time, users thought they should have been able to
click on the blank tab above each group and name it as the group was
created.
Aside from the basic instructions at the top of the page,
CardZort did not provide any form of a Help section whereby users could find
detailed explanations of the program features. This is considered an
essential component of any program, especially for first-time users. In
addition, CardZort did not provide a means by which users could create
subgroups or duplicate cards for instances where they may want to place a
card in multiple groups. Users were observed during the usability study to
comment that both of these features would be helpful.
WebSort
Figure 13 shows a sample sorting screen for WebSort.
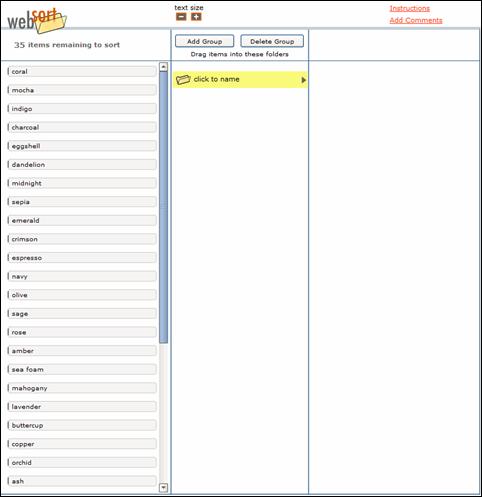
Figure 13. WebSort user interface (www.websort.net).
As the least preferred application, WebSort was found to
be overall difficult to use. Participants were not able to see all items to
be sorted at one time. If the number of items to be sorted exceeded 23 (in
1024 x 768 screen resolution), participants had to scroll down the item list
to see the entire list. In addition, participants were able to view the
cards within only one group at a time; they had to click on a group name to
show its contents.
Like CardZort, WebSort did not offer extended Help
information beyond the initial instructions and users were unable to create
subgroups or duplicate items.
Study 2 Summary
Results from Study 2 show that OpenSort was the unanimous
favorite of the three card sort applications from the end users’
perspective. Participants liked the step-by-step instructions and found the
cards easy to manipulate, group, and name. Participants reported that the
sorting and naming process in CardZort and WebSort was more cumbersome and
the user interface was overall less usable. Ease of dragging and dropping
the cards and concurrent group naming were found to be critical factors of
success.
It must be noted that the open card sort conducted by the
users was limited in its scope. Only 35 single-word items were sorted in
each program. This represents a small card sort exercise; most times, card
sorting is conducted with 100 or more items, with each item described by
multiple phrases or sentences. One of the drawbacks, however, of electronic
card sorting programs, when compared to physical card sorting, is the
diminished space (or screen real estate) users have to group and move cards
around. Given that users found the interaction with some of the programs
cumbersome in this study, it is expected that with a sort using 100 or more
cards, these problems would only be exacerbated.
Conclusion
Results from this two-part study are interesting in that
the “best” electronic card sort application appears to be dependent on the
participant group using it. Researchers preferred WebSort to set up and
analyze an open card sort while end users preferred OpenSort to do the
actual card sorting. It should be emphasized that this study examined
performance upon first-time usage. It is expected that with continued use,
all participants would become more comfortable with the programs and find
them easier to use. However, the process of a card sort activity requires
only a single participation by each end user. Therefore, first-time
perceptions of usability are extremely important to this user group. One may
argue that researchers may spend more time experimenting with the
application before using it and therefore, first-time usability may be less
important. Still, first impressions are a critical factor in the face
validity of a product and subsequent decision-making of whether to use it
again.
The disparate results of this study underscore the
importance of usability testing during product design for
all user groups. It is possible
that the application developers of OpenSort focused more on the end user
experience than the researcher experience. Likewise, the developers of
WebSort may have focused more on facilitating researcher activities rather
than the end user experience. Electronic card sorting has great potential to expedite the process and
improve the generalizability of its results by involving users from remote
locations. However, these benefits will only be realized if the card sorting
applications themselves are intuitive, efficient, and well-liked by
researchers and end users.
Table 5 provides a feature summary of the programs
evaluated in this study. As noted earlier in Table 1, there are many other
card sorting programs also available. Practitioners are encouraged to
evaluate these programs and see how they compare to those evaluated in this
study in terms of usability and satisfaction, both from the researcher and
end user perspective.
| Feature | CardSort | WebSort | OpenSort |
|---|---|---|---|
| Allows import and paste of text list of card items | X | X | |
| Allows images to be placed on cards | X | X | |
| Online help available for researcher | X | X | X |
| Allows researcher to customize sorting instructions | X | X | |
| Provides ability to download raw data | X | X | |
| Method of displaying cards | Stacked cards | Vertical list of terms | Stacked Cards |
| Allows users to name groups as they sort | X | X | |
| Allows users to create duplicate cards | X | ||
| Allows users to create subgroups | X | ||
| Provides online help for end user while sorting | X | X | |
| Generates dendrogram as results | X | X | X |
| Provides ability to manipulate dendrogram | X | ||
| Provides additional methods of visualizing results | X |
Acknowledgements
We thank Rashmi Sinha from MindCanvas for graciously providing free access to OpenSort for this study.
References
Brooke, J. (1996). SUS: A Quick and Dirty Usability Scale,
in P. Jordan, B. Thomas, B. Weerdmeester, & I. L. McClelland (eds.)
Usability evaluation in industry
(pp. 189-94). London, UK: Taylor & Francis.
Bussolon, S., Russi, B., & Del Missier, F. (2006). Online Card Sorting:
as good as the paper version. Proceedings of the 13th Eurpoean conference on Cognitive ergonomics:
trust and control in complex socio-technical systems, ACM International
Conference Proceeding Series: vol. 250.
Courage, C. & Baxter, K. (2005).
Understanding Your Users: A practical guide to user requirements:
Methods, Tools, & Techniques (pp. 415-456). San Francisco, CA: Morgan Kauffman Publishers.
Harper, M., & Van Duyne, L. R. (2002). Computer-based card
sort training tool: is it comparable to manual card sorting? Proceedings of
the Human Factors and Ergonomic Society 46th Annual Meeting (pp.
2049-2053).
Morae™, TechSmith ©2004. Retrieved from
http://www.techsmith.com/morae.asp
Zavod, M.J., Rickert, D. E., & Brown, S.H. (2002). The
automated card-sort as an interface design tool: a comparison of products.
Proceedings of the Human Factors and Ergonomics Society 46th Annual Meeting (pp. 646-650).