
Abstract
Banner blindness, the phenomenon of website users actively ignoring web banners, was first reported in the late 1990s. This study expands the banner blindness concept to text advertising blindness and examines the effects of search type and advertisement location on the degree of blindness. Performance and eye-tracking analyses show that users tend to miss information in text ads on the right side of the page more often than in text ads at the top of the page. Search type (exact or semantic) was also found to affect performance and eye-tracking measures. Participant search strategies differed depending on search type and whether the top area of the page was perceived to be advertising or relevant content. These results show that text ad blindness occurs, significantly affects search performance on web pages, and is more prevalent on the right side of the page than the top.
Practitioner’s Take Away
The findings in this study suggest that users experience text advertising blindness. Users were less successful, reported more task difficulty, and took longer to find information when it was embedded in text advertisements positioned at the top and the right side of the page.
Practitioners should realize the following about text advertisements:
- Users demonstrate text advertisement “blindness” when viewing web pages. This means that information displayed in areas of the page dedicated to text ads (e.g., top of the page, right side) is generally ignored or viewed last.
- Users are less likely to find information on a web page if it is located on the right side of the page than on the top of the page if both areas resemble text ads. This is especially true when they are searching for specific information.
- When conducting an informational, or semantic, search, users have equal amount of difficulty finding information that is embedded in an ad either at the top or on the right side of the page.
- The perception of whether a region is perceived as advertising affects how web pages are searched. When a region is seen as advertisements, users will scan the area if it necessitates completing their task and will likely do so only after scanning other content areas. However, if the region is perceived as content, users will integrate the area into their search strategy, possibly as an expected location for their search goal or a location covered by a heuristic.
- Users typically associate the right side of a web page with text ads and consequently view this area of the page last or not at all. As a result, both designers and advertisers should use caution when placing content information on the right side of the page.
Introduction
Internet advertising is a primary source of revenue for the majority of websites. In 2009, approximately $22.7 billion in advertising revenues were generated on the Internet (Interactive Advertising Bureau, 2010). Often, Internet advertising pays for web content and services such as videos, blogs, photos, social networking, or news stories, which otherwise would be paid for by web users through per-use or subscription fees (Prasada, Mahajan, & Bronnenberg, 2003). Search and banner advertising accounted for 69% of advertising revenue in 2009 (Interactive Advertising Bureau, 2010). Search advertising was the largest generator (47%) of advertising revenue. Second to search advertising was static banner advertising, which accounted for 22% of revenue. Search advertising remained the largest source of revenue even when animation (rich media advertising) is included (7%). A large component of search advertising is text advertising. Often in search engine results, text advertising is related to the searched topic and typically contains a title, a tag line containing a promotional message from the sponsoring entity and a URL to the entity’s website (AdWords, 2011). In addition to search engines, another common example of such text advertising is the Google advertising network (AdSense, 2011). Design decisions about the appearance of the advertisement are left largely to the producers of the website (see Figure 1).
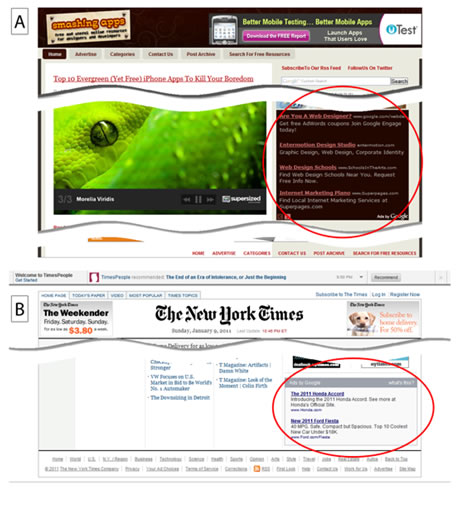
Figure 1. Google advertising regions located on (A) smashingapps.com and (B) NYTimes.com.
Even though banner ads are a large source of revenue, users exhibit a phenomenon called "banner blindness" in which they ignore page elements that resemble banners while reading a web page (Benway, 1998). This phenomenon occurs with both large and small text, and salient elements not relevant to the task. A more recent and comprehensive examination of banner blindness was conducted by Burke, Hornof, Nilsen, and Gorman (2005). They found that when advertisement banners were present, search performance decreased, although differences in search time and mental workload between static and animated banners occurred only for the most salient banners (e.g., flashing and brightly colored). Interestingly, participants habitually avoided fixating on regions of the web page stimuli where banners were typically located or expected.
The location of the banner advertisements on a web page has been identified as a prominent factor in the degree of banner blindness (Albert, 2002; Benway, 1998; Burke et al., 2005; Granka, Hembrooke, & Gay, 2006; Mosconi, Porta, & Ravarelli, 2008). Albert (2002) found that banner advertisements located below the website branding/search area were viewed longer and by more participants than banners that were placed above the branding/search area. Granka et al. (2006) and Mosconi et al. (2008) both concluded that advertising placed outside the main content area led to decreased viewing of banners. Cooke (2008) found that participants ignored information located on the right side of the web page, which typically consisted of text and image-based links. Through a talk-aloud protocol, participants revealed that they did not look at that area of the page because they expected it to contain information irrelevant to their task, such as advertising. Readers tend to make initial or anticipatory eye movements towards the center of a text page (Rayner, 1988) or the top banner of a web page (Burke et al., 2005), but not towards the right side of a page, which may contribute to the high degree of banner blindness for that region.
The type of search a user performs on a web page also influences the degree of banner blindness. Yesilada, Jay, Stevens, and Harper (2008) asked participants to complete both search and “aimless” browsing tasks. During the search task, users located information to answer a specific question. During the aimless browsing task, users merely familiarized themselves with the web page. The result was that more banners were ignored in the search task than in the aimless browsing task. Similarly, Pagendarm and Schaumburg (2001) instructed users to search web pages in either a goal-directed or aimless fashion and found that the goal-directed group recognized fewer banners, recalled fewer details about banners, and recalled fewer of the advertised companies than the aimless browse group. Riegelsberger, Sasse, and McCarthy (2002) noted that the less directed the search task, the longer its duration, which may provide more opportunities for users to fixate on banner ads while aimlessly browsing.
Rayner (1998) noted that fixation duration can be used as a measure of cognitive load because it varies for different types of tasks such as visual search, scene perception, reading, etc. As cognitive workload increases, it is suggested that fixation duration also increases. Burke et al. (2005) found that users perform tasks with known targets (i.e., exact searches) faster and with fewer fixations than tasks with semantically defined targets (i.e., semantic searches). Their finding that users fixate more during semantic searches coincides with eye tracking differences in efficient and inefficient visual search tasks (Rayner, 1998; Wolfe, 1998). Semantic searches also yielded more diffuse gaze patterns that tended to include banner advertisements while exact searches yielded more focused gaze patterns that tended to ignore banner advertisements (Burke et al., 2005). Thus, the more goal-directed the search task, the higher the degree of banner blindness. Semantically defined targets do not allow for the guidance of visual attention (Wolfe, Cave & Franzel, 1989), leading to inefficient search processes characterized by more fixations and longer response times (Wolfe, Butcher, Lee, & Hyle, 2003). With exact search tasks, participants knew the exact target, which allowed them to guide their attention to the target more efficiently and thus disregard distracter links. In semantic searches, the exact target was unknown so participants had to engage in less efficient visual search behavior. Interestingly, reading tasks generated more fixations and shorter fixation durations than visual search and scene perception activities (Rayner, 1998). Rayner also noted that eye movements and attention are coupled tightly in complex tasks, such as reading, because it is more effective to move the fovea to the focus of attention than to move attention to the parafovea or periphery.
Knowing how users typically search web pages is beneficial for understanding why banner blindness arises. Grier, Kortum, and Miller (2007) proposed the EHS theory, which states that search occurs in three distinct stages: Expected location search, Heuristic search, and Systematic search. In the Expected location search, the user examines the probable location of the information where the expected location is derived from previous experiences. In the event that an expected location does not exist or the user was unable to locate the information in the expected region, the user will engage in a Heuristic search. Users employ several heuristics while scanning a page. First, the user examines the top-left corner of the main content in the web page. If the target is not located there, the user will examine areas of the main content that have medium saliency levels. Because of this heuristic, both high salience elements, such as advertisements, and low salience items that blend well with the page content are ignored. The last heuristic implies that information clusters around other similar information. If the target is not located with the heuristic search, the user engages in a Systematic search of the main content area of the web page and examines each element serially. If the search target is not found in the main content area, the user looks at other areas of the page. The cycle of heuristic and systematic searches repeat for each area until the search target is located, the user gives up, or all elements/areas on the web page have been inspected.
Few studies have examined the efficacy of text advertising and its relationship to the banner blindness phenomenon. Shrestha, Owens, and Chaparro (2009) explored the effect of target location and the congruency of text advertisements on a search engine results page. Results indicated that 79.1% of participants successfully located targets in the text ad region above the search results, while only 40.9% found targets in the text ad region to the right of the search results. Shrestha et al. found increased fixation counts on both search results and advertisements to the right of the search results, but these extra fixations did not necessarily lead to increased success for participants. In fact, participants fixated less often on search results and advertisements during trials where the target was located in the ads above the search results than when it was located in the ads to the right of the search results. However, they were more successful at locating ads above the search results. These findings indicate that target location was the primary factor influencing both fixation counts and task success and that increased fixation counts do not always correlate with lower banner blindness. However, when considering this finding, note that Nielsen (2003, 2007) argued that the concept of advertisement blindness does not apply to search advertisements because when users employ search engines, they are searching for a solution, and if an advertisement may provide a solution to their task, they will click on it.
Fox, Smith, and Chaparro (2009) examined the effects of color schemes and locations on text advertisement efficacy. Analysis of eye-tracking data indicated that ads located above the page content received significantly more fixations, but not increased recognition. Buscher, Dumais, and Cutrell (2010) examined how users interacted with search results during several types of search task, ad/results congruence, and text ad locations. They used fixation impact as their dependent measure, which is highly correlated with fixations as it is derived by the product of fixation count and dwell time. Overall, Buscher et al. found that advertisements located to the right of search results had a lower fixation impact than other areas. This finding did not occur with advertisements located above the search results where the fixation impact may have been modulated by ad congruency. When the search trial used advertisements that were congruent with the search results, fixation impact for ads located above the search results increased at the expense of fixations directed towards the search results themselves. When the ads were incongruent, fewer fixations were allocated to ads located above the search results, but more toward the search results. The fixation impact of ads to the right of search results did not differ across congruent or non-congruent ad conditions. This provides evidence that users were likely aware that the region to the right of the search results were advertisements and were subsequently ‘blind’ to the ads. All three studies (Fox et al., 2009; Shrestha et al., 2009; Buscher et al., 2010) indicated some degree of text advertising blindness in which users ignore text advertisements.
Summary
Previous literature has indicated that a mixture of factors contribute to advertising blindness, particularly with web banners. In the past, users have been less successful when completing tasks that rely on advertising. Participants recalled fewer details about areas or elements associated with advertising. Advertisement location has been shown to greatly affect the extent of advertising blindness. Participants have exhibited blindness to advertisements placed to the right of the content more than other locations on a web page. Areas that fall outside of the content region or that are associated with advertising, such as the region to the right of the content, received fewer fixations. Fixation order has also been influenced by whether a region is perceived as advertising. The degree of blindness has been affected by characteristics of web elements, where elements resembling banners are actively ignored except for the most salient banners. The type of task users complete, ranging from simple browsing to knowing the exact terms they are supposed to locate, has been shown to affect the extent of blindness as well. Directed tasks may lead to fewer fixations and shorter task durations. Tasks with increased cognitive workload may lead to larger fixation durations. Exploring this issue further, particularly with eye-tracking, is important because text advertising is becoming more prevalent as the highest revenue generating form of advertising currently used on the web.
>Purpose
The purpose of this study was twofold: (a) to establish whether text advertisements are susceptible to user “blindness” and (b) to determine the effects of search type (exact or semantic) and target location on the degree of blindness. The following was hypothesized:
- Text advertising is prone to the same blindness effects that have been discovered with graphical banner advertisements. Namely, participants will have more difficulty and less success finding information that is located in text advertising areas on a web page.
- More focused searches (exact) will result in a higher incidence of text advertisement blindness than less focused (semantic) searches.
- Eye-tracking measures will provide converging evidence for text ad blindness. We predict that participants will fixate later and less often on text ad regions than on content regions of the web page.
Both standard usability measures and eye-tracking data were examined for each hypothesis.
Methods
The following sections discuss the participants, materials, and procedures used in this study.
Participants
Thirty-two participants were recruited from psychology and general education courses at Wichita State University for course credit, and all gave informed consent before the experiment. Seven participants were excluded from the study due to problems with eye-tracking calibration. Twenty-five participants (10 males and 15 females, mean age 23.5 years, SD 6.17 years) had Internet and computer experience, with the majority reporting at least 7-14 hours of computer use per week.
Participants reported using the Internet for a variety of reasons, the primary three being educational purposes, e-mail, and entertainment. Other reported activity included gathering product information, researching travel information, work/business, personal needs, browsing the web, and communicating with others.
Materials
The following sections discuss website stimuli, tasks, eye-tracking apparatus, and questionnaires.
Website stimulus
A website was created for the study consisting of 29 web pages organized into seven categories. The overall theme of the website was to provide information about travelling to Hawaii and its six major islands. The website categories were the Hawaiian Islands, the Island of Maui, the Island of Molokai, the Island of Oahu, the Big Island of Hawaii, the Island of Kauai, and the Island of Lanai. The sub web pages for each island were organized into history, points of interest, travel tips, and a summary page. The category for the entire chain of islands included similar topics such as travel tips, festivals, and state history.
Each page of the website had a similar organizational structure. All the pages contained a top navigation bar that listed each island and a Home section with information about all of the Hawaiian Islands. Left-side navigation contained sub-category web pages for each of the main categories. The center of the web page consisted of a content section that included two text advertisements at the top, a section header, copy, and a single photo related to the category or sub-category of the web page. Immediately to the right of the center area was a list of 5-6 text advertisements. The bottom of the page contained a single footer with copyright information. Above the main navigation was a website logo. An example web page from the website is provided in Figure 2.
The majority of the content was adapted from the Hawaiian Convention and Travel Bureau’s website (http://www.hvcb.org/). Some content was adapted from Wikipedia articles about the history and festivals in the Hawaiian Islands. The content was edited to ensure it would proceed beyond the fold of the web page, thus requiring users to scroll to see the entire content.
The text advertisements were generated from Google.com searches for Hawaiian travel related topics. In total, 103 unique text advertisements were selected from the Google.com searches and were customized for each of the categories and subsequent sub-categories in the website. With customizations of the text advertisements, 205 text advertisements were created and placed within the 29 web pages of the travel website.
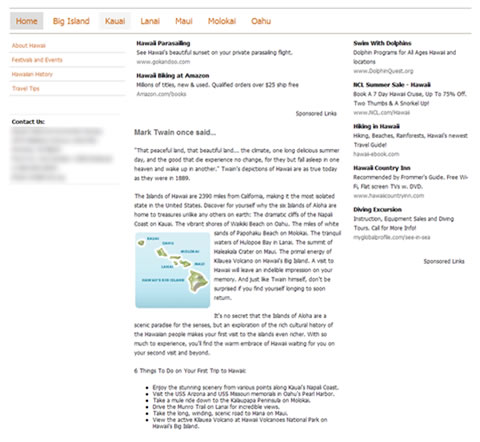
Figure 2. A page from the Hawaiian travel web page stimuli
To analyze the eye-tracking data, Areas of Interest (AOIs) were defined for each target page. AOIs are geometric areas of a web page that correspond to specific content. All AOIs excluded any graphical components. The target locations were within their respective AOIs (e.g., Content target locations were located within the Content AOI; see Figure 3). These AOIs were all located above the initial page fold, or point that requires scrolling to view content or web elements below.
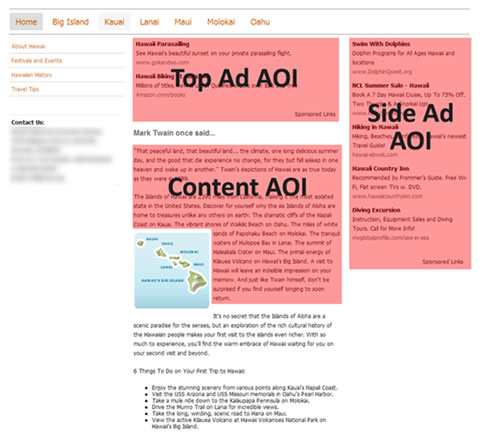
Figure 3. An example of a web page with the Content AOI, Top Ad AOI, and Side Ad AOI, the target was always located above the page fold.
Tasks
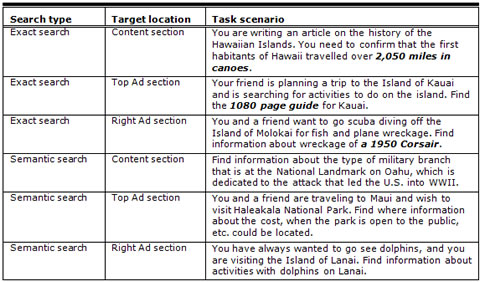
Two types of search tasks were used in the study: exact and semantic searches. Exact searches directed participants to find an exact target in the website. For example, participants were given the altitude of a city (i.e., nearly 1,700 feet) and asked to locate the fact in the website. Semantic searches instructed participants to find a target within the website with information semantically related to the goal. For instance, participants were asked to find information about the type of military branch located at the National Landmark in Oahu that was dedicated to the attack that led the U.S. into World War II. Target locations were equally likely to appear within the content of the page or within a text advertisement. For targets appearing inside a text advertisement, half were located in the top ad area and half were located in the side ad area.
Overall, participants completed 16 target-present search trials: eight target locations in the Content section, four target locations in the Top Ad section, and four target locations within the right Side Ad section. In each of the three sections, half the tasks were exact searches and the other half were semantic searches. Additionally, participants performed one target-absent search where they were asked to search for a target that was absent from the website, but could fall logically under a section of the website. See Table 1 for examples of the tasks used in the study.
Within the content of the page, the target location was positioned either in the first or second paragraph, which were always located above the page fold. In Figure 3, these targets were located in the region called the Content AOI. In the top ads, the target location was situated either in the first or second advertisement (Top Ad AOI). In the right ads, the target location was positioned in the top or bottom half of the advertisement section (right Side Ad AOI). The target locations were equally likely to be in the top or bottom half of each section. Targets were spread across all seven categories of the website. Tasks for each target location were worded similarly to minimize indication of the target location. Task order was counterbalanced across participants.
Two practice trials, one semantic search and one exact search, were provided to allow the participants to familiarize themselves with the search task types. These practice trials were not analyzed. The targets for both practice trials were located within the center content section of the web page.
Table 1. Examples of task scenarios used in the study. For exact searches, participants were instructed that they should search the website for the bold, italicized text found in the task scenarios.
Eye-tracking apparatus
A Pentium IV-based PC with a 96 dpi 17” monitor with a resolution of 1280 by 1024 pixels integrated with the Tobii 1750 eye-tracking system running at 50Hz was used to capture eye-tracking measures. Tobii StudioTM software was used to record and provide fixation and AOI eye-tracking data of the participants. Custom software was created to analyze and generate summary statistics from the eye-tracking data collected from Tobii StudioTM.
Questionnaires
A background questionnaire was used to collect demographic information and Internet/computer experience. A modified version of the System Usability Scale (SUS) was administered to measure user satisfaction with the website (Brooke, 1996). The modification of the SUS focused the usability measures toward websites instead of "system" in order to reduce confusion among participants.
A post experiment questionnaire collected information about ad recall, ad location, and search strategies for the exact and semantic tasks. Additionally, participants were asked if any information on the website was difficult to find in order to gauge if participants associated text advertising with difficult tasks. Several distracter questions were included to prevent participants from determining the nature of the study. These questions asked about color schemes, content, and the appearance of the top and left navigation menus.
At the end of each trial, participants were asked to rate the difficulty of the given task. A 5-point Likert scale was used to measure difficulty (1 = very easy, 5 = very difficult).
Procedure
Participants each completed eight semantic searches, eight exact searches, and one target‑absent search in random order. The study was portrayed and advertised as a website evaluation study to prevent participants from determining the actual purpose. Each experimental session lasted approximately 45-60 minutes. Participants answered the demographics/experience questionnaire and were calibrated on the Tobii 1750 eye-tracker using a nine-point calibration process. If the participant was not able to calibrate accurately, they were dismissed from the study.
To complete the task portion of the study, participants were handed a task card and asked to read it aloud. Participants were allowed to ask questions to clarify the nature of the task before starting, but were not provided information on the target location. Once participants indicated that the task was understood, they handed the task card back to the researcher. This was done to eliminate the possibility of looking at the card while completing the task and thus disrupting their eye gaze from the monitor. If participants needed the task information again during the trial to remind them of their target, they asked the researcher to reread the task aloud. The researcher did not confirm or deny whether the participant’s target choice was correct. Participants were asked not to engage in talk-aloud protocol once the trial began to prevent interference with the data collection of eye movements by the eye tracker.
All participants completed the practice trials first. The order of the remainder of the tasks was counterbalanced across participants. All trials were limited to a maximum duration of 105 seconds (determined through pilot testing as a reasonable amount of time to find the target). Typically, this resulted in trial duration of 101 to 103 seconds given Tobii Studio’sTM brief delay in launching the web stimuli. The delay was determined by examining task duration when Tobii StudioTM closed the web stimuli in unsuccessful trials. The beginning of the trial started when the participant clicked a start button. Typically 2-4 seconds later, the web stimuli would appear. In the subsequent analyses, this delay was removed from the task duration. Participants clicked on the search target once they found it and then pressed F10 on the keyboard to end the trial. Eye-tracking data was collected during all trials. If the participant was not able to locate the target and the duration limit was reached, Tobii StudioTM closed the web stimulus and the trial ended. Alternatively, the participant could give up and end the trial early by pressing F10.
After the trial was completed, participants were asked to provide a task difficulty rating using the 5-point Likert scale. In addition, participants were asked to recall the overall web page design used within the website and sketch a wireframe representation on paper of the pages they visited during their tasks. They were instructed to label each section. In some cases, they were asked to provide additional clarification in their sketch if the details or labels of web elements were vague. Finally, participants completed the SUS and post-experiment questionnaire.
Analyses
Both performance and eye-tracking metrics were examined. Data from the target‑absent condition were omitted from the analyses.
Task success was dependent on whether the participant clicked on the correct target within the 105 second allotted time limit. If the correct target was selected, then the task was marked as successful. If it was not, then it was marked as a failure.
Task duration was calculated from the onset of the trial to either when the target was clicked, 105 seconds expired, or the participant gave up completing the task and announced that the target could not be located.
Task difficulty was defined by the self-reported difficulty score given after each trial. Trials were scored from 1 to 5 with very easy being rated as 1 and very difficult being rated as 5. Task difficulty was calculated for both search type and target location conditions.
Ad recall was measured from the post-experiment interview. One question asked participants to indicate regions of the website where advertisements were located. A second question asked participants to sketch a prototypical page in the website. If either response indicated advertisements in the top or side advertising areas, it was recorded that the participant recalled ads in that location.
Fixation count was defined as the number of fixations in a particular AOI or on the entire web page. A single fixation was defined by the standard Tobii StudioTM fixation filter, which consists of two or more consecutive sample points that fall within a 35-pixel radius from the averaged sample point location as collected by the Tobii eye-tracker. For a participant located 65 cm from the eye-tracker, the approximate visual angle is 1.66° for the 35-pixel radius fixation. The sample points were defined by binocular location of the point, which was determined by the median location between the left and right eyes of the participant. If only one eye was trackable, then the location of the sample point for that eye was used. If neither eye was available, it was recorded as missing data and was omitted from analysis. Whole page fixation count was defined as the sum of all fixations on a target web page. AOI fixation counts were calculated by summing the number of fixations within an AOI.
Fixation duration was defined as the length of time from the first sample point to when the sample point was located outside of a 35-pixel radius from the averaged location of consecutive sample points. AOI mean fixation durations were calculated by averaging the duration of fixations found within an AOI.
Order of fixations was defined as the rank order the Content AOI, Top Ad AOI, and Side Ad AOI were fixated. The order was determined by calculating the time to first fixation for each AOI and assigning the appropriate rank. In the event the AOI was not fixated, it was omitted from the rankings.
The eye-tracking data were log transformed to correct for leptokurtosis and positive skewness in fixation count and mean fixation duration data. The transformations affected fixation counts and mean fixation duration for whole page and within page AOI analysis. Generally, the log transformations corrected skewness and kurtosis issues with the data.
Results
The following sections discuss task success, ad recall, task difficulty, task duration, and eye-tracking metrics.
Task Success
Task success was examined across target location (Content, Top Ad, or Side Ad) and search type (exact or semantic search). Figure 4 shows task success by search type and target location.
Participants were most successful at identifying targets in the Content AOI (82%), followed by the Top Ad AOI (52.9%), and then the Side Ad AOI (36.8%). Analysis of search type indicated that participants were more successful in exact searches (67%) than semantic searches (60%). Differences in success were examined with Chi-Square tests of association and further examination of residual values. The relationship between target location and task success was significant, Χ2(2, N = 396) = 64.531, p < .001, indicating that task success was significantly higher when the target was within the Content AOI (z = 3.3) and significantly lower in the Side Ad AOI (z = -3.3). Additionally, participants were slightly less successful, but not significantly, when the target was located in the Top Ad AOI (z = -1.3). The relationship between task success and search type was not significant, Χ2(2, N = 396) = 1.976, p > .05. The results of both Chi-Square tests indicate that target location, but not search type, has an effect on the success of the trial.

Figure 4. Percentage of task success for search type and target location, error bars are +/- one standard error.
Ad Recall
If one considers the implication of text advertising blindness to be that users ignore areas resembling text advertising, ad recall should be in sync with the task success results. With a higher success rate for the Content and Top Ad target locations, participants should have more recall of text advertisements in this region compared to Side Ad target locations. Ad recall was recorded in this study when users indicated the presence of an ad in the web page sketch or reported ads being present in the open-ended question at the end of the experiment. Overall, 12 of 25 participants recalled advertisements located in the Top Ad AOI. When ads were not recalled, participants typically reported that the Top Ad AOI contained information related to the content, such as related links. Twenty-four of 25 participants reported that the Side Ad AOI contained advertisements. No participants reported advertising in the Content AOI, which never contained ads. Figure 5 contains frequency of ad recall per advertising region.
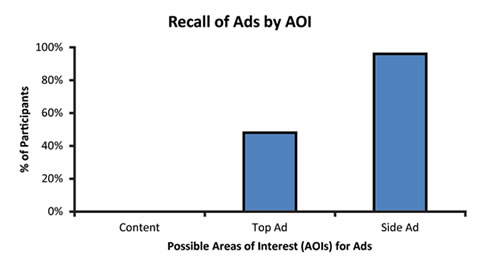
Figure 5. Ad recall across advertising regions
Task Difficulty
Not surprisingly, users rated the unsuccessful trials as more difficult than successful trials. Results of an independent-samples t-test indicate that task difficulty between successful (M = 1.99, SD = .842) and unsuccessful trials (M = 4.014, SD = 1.103) was significantly different, t(239.013) = 19.051, p > .001, d = 1.49.
A two-way ANOVA was conducted to examine whether task difficulty differed across search type (exact, semantic) and target location (Content, Top Ad, Side Ad) conditions when participants were successful in finding the target. The ANOVA returned a significant main effect of target location, F(2, 246) = 5.179, p = .006, η2 = .04. The main effect for search type and the interaction between target location and search type were not significant. Figure 6 illustrates the differences in task difficulty between conditions. Post-hoc analyses showed that participants rated the Content target location tasks as significantly easier than the Side Ad target location (MD = -0.4553, p = .007).
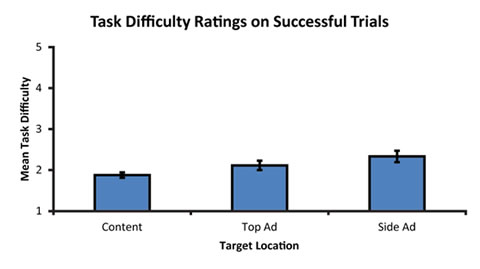
Figure 6. Mean task difficulty ratings for target location for successful trials, error bars are +/- one standard error.
Task Duration
Similar to task difficulty, if participants were experiencing text advertising blindness, task duration for search tasks where the target information was located in advertising areas should have been longer than non-advertising areas. Additionally, participants should have been faster at completing exact searches than semantic searches (Burke et al., 2005). Task duration was calculated from the onset of the trial to either when the target was clicked, 105 seconds expired, or the participant gave up on completing the trial and announced that the target could not be located.
A two-way ANOVA was conducted to examine whether differences existed for task duration across search type (exact, semantic) and target locations (Content, Top Ad, Side Ad) when participants successfully found the target locations. A significant interaction was reported between search type and target location, F(2, 246) = 5.39, p = .005, η2 = .042. Figure 7 illustrates the differences in task duration between conditions.
Post-hoc analyses showed that exact searches in Content target trials were the quickest and exact searches with Side Ad targets were the slowest. There was little difference in task duration across target locations for the semantic searches. Participants completed exact searches in Content target location trials quicker than Top Ad target location trials (MD = 12.689, p < .01), Side Ad target location trials (MD = 27.19, p < .01), semantic searches in Top Ad location trials (MD = 11.876, p < .01), Content target location trials (MD = 16.443, p < .01), and Side Ad target trials (MD = 19.249, p < .01). Participants were slower during exact searches with Side Ad target locations than Top Ad location trials (MD = 14.5, p < .01), semantic searches with Content target location trials (MD = 10.746, p < .01), Top Ad target location trials (MD = 15.323, p < .01), and Side Ad location trials (MD = 7.94, p < .01). Finally, participants completed semantic searches during Side Ad target trials slower than Top Ad target trials (MD = 7.383, p < .01) and during exact searches with Top Ad targets (MD = 6.56, p < .05).
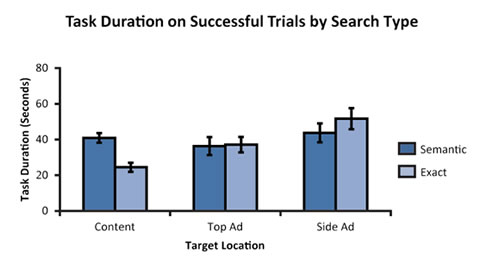
Figure 7. Task duration in seconds for search type and search target for successful trials, error bars are +/- one standard error.
Eye-Tracking Metrics
Several eye-tracking metrics were examined to explore how participants viewed the text advertisements. Eye-tracking data analyses were limited to visitations to the web page that contained the target location.
In previous studies (Zelinsky, 1996; Zelinsky & Sheinberg, 1997), fixation counts have been highly correlated with other measures of participant gaze behavior and can thus serve as a useful summary statistic and greatly simplify the analyses of eye-tracking data. Correlation coefficients were calculated between fixation count, gaze time, and scan path length. Primarily, fixation count was positively correlated with gaze time for both successful and unsuccessful trials (r = .962, p < .001, r2 = .925; r = .979, p < .001, r2 = .958) and scan path length for successful and unsuccessful trials (r = .98, p < .001, r2 = .96; r = .978, p < .001, r2 = .957). Given these results, fixation count served as the primary data in subsequent analyses and further examination of gaze time and scan path length were not explored.
Heatmaps
Heatmaps were generated for successful and unsuccessful tasks for each type of search task. Heatmaps were aggregated across all similar tasks. Polygons were superimposed over the AOI to indicate the location of the Content, Top Ad, and Side Ad AOIs. Cooler colors (blue, green) indicate fewer fixations while warmer colors (yellow, orange, red, purple, white) indicate increases in fixations. Content search tasks are represented in Figure 8. Top Ad search tasks are represented in Figure 9. Finally, Side Ad search tasks are represented in Figure 10.
It can be seen that the heatmaps show fewer fixations on the Content AOI when participants failed to find targets during Content search tasks, which suggests that they were not thoroughly searching the Content AOI of the page. During Top Ad search tasks, participants that failed to successfully find search targets primarily searched the Content AOI and largely ignored the Top Ad. Even when successful, participants still searched the Content and Side AOIs. While completing Side Ad search tasks, participants primarily searched the Content and Top Ad AOIs even when successful. When participants were unsuccessful, they ignored the Ad AOIs.
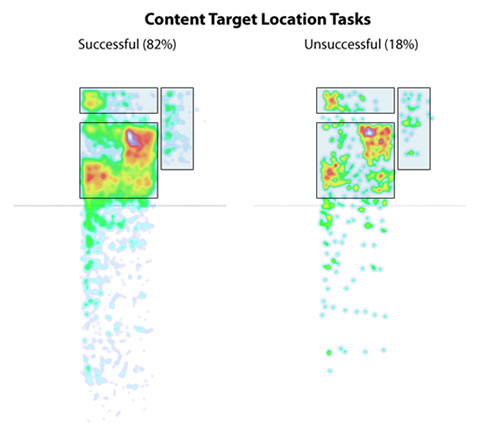
Figure 8. Heatmaps for successful and unsuccessful Content target location tasks
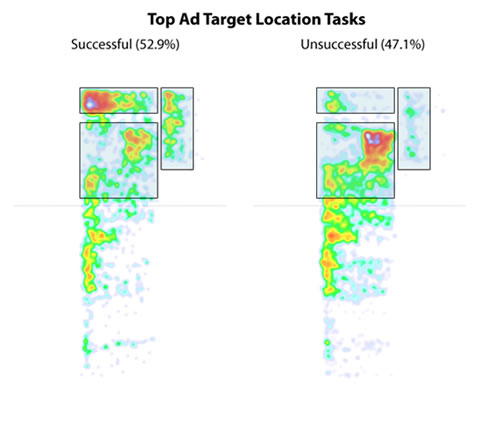
Figure 9. Heatmaps for successful and unsuccessful Top Ad target location tasks
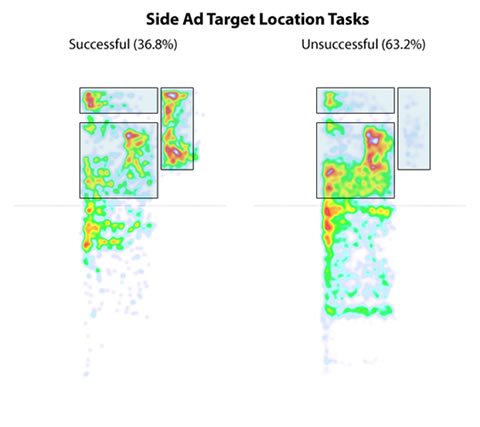
Figure 10. Heatmaps for successful and unsuccessful Side Ad target location tasks
Fixation order by AOI
If an area on a web page was related to advertising and users actively ignored it, then it was expected that those areas would be fixated after the main content area of the page, if at all. The AOI rank order was calculated for both successful and unsuccessful trials in an attempt to understand successful and failed search strategies. AOI rank order was defined as the order the Content AOI, Top Ad AOI, and Side Ad AOI were fixated. The order was determined by calculating the time to first fixation for each AOI, and assigning the appropriate rank. Mean rank order was calculated by a Friedman test.
Successful Trials
A Friedman’s Chi-Square was conducted to determine if fixation order of AOIs were significantly different. The results indicated reliable differences in rank order for successful vs. unsuccessful trials, Χ2(2, N = 60) = 30.833, p < .001. Additionally, Kendall’s W Coefficient of Concordance indicated a small effect size, W = .257. Figure 11 contains the means for rank order of each AOI. The rank orders of AOIs in successful trials indicated that the Side Ad AOI was viewed after the Content and Top Ad AOIs. This supports the notion that participants fixated on regions unrelated to advertising before advertising related regions. Post-hoc analyses showed that the ranks between the Content AOI and Side Ad AOI were significantly different, z = -4.141, p < .001. Additionally, significant differences were noted between the Top Ad AOI and Side Ad AOI, z = -4.593, p < .001. The rank order of fixation for the Content and Top Ad AOIs were not significantly different from each other (p > .05).
Unsuccessful Trials
The rank orders of AOIs in unsuccessful trials indicate that the Side Ad AOI was viewed after the Content and Top Ad AOIs, as in the successful trials analysis. A Friedman’s Chi-Square was conducted to determine if rank order of AOIs differed. The results indicated significant differences in rank order for unsuccessful trials, Χ2(2, N = 42) = 27, p < .001. Additionally, Kendall’s W Coefficient of Concordance indicated a medium effect size, W = .321. Figure 11 contains the means for rank order of each AOI. Post-hoc analysis showed significant differences between the Content AOI and Side Ad AOI ranks, z = -4.357, p < .001, and between the Top Ad AOI and Side Ad AOI, z = -3.735, p < .001. The rank order of fixation for the Content and Top Ad AOIs were not significantly different from each other (p > .05).
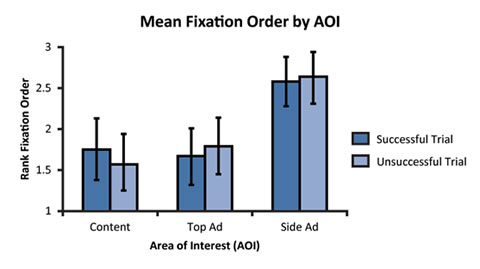
Figure 11. Mean rank fixation order for successful and unsuccessful trials by AOI, shorter bars indicate the region was fixated earlier. For both successful and unsuccessful trials, the Side Ad AOI was viewed after the Content and Top Ad AOI. Error bars represent 95 percentile Bootstrap Confidence Intervals.
In the sample, there was approximately an equal split between participants that thought the Top Ad region were text advertisements or a collection of links related to the content. Previous analyses showed Content and Top was searched first, and that those two were not significantly different from each other. For successful searches, Top Ad AOI rank preceded the Content area, even though the difference was not significant. By examining fixation order, it can be determined whether the classification of the Top Ad region influenced the beginning of the perceived Content region. Results indicated significant differences in rank order for both advertisement and related links classifications, Χ2(2, N = 25) = 15.92, p < .001 and Χ2(2, N = 35) = 20.8, p < .001, respectively. Additionally, Kendall’s W Coefficient of Concordance indicated small effect sizes, W = .318 and W = .297, respectively. Figure 12 contains the mean fixation order for AOIs based on ad recall. Overall, if the Top Ad region was perceived as being related content, participants began their searches in this region. In comparison, if they considered it advertisements, they started searching in the true Content region and fixated more on the Content AOI t(250) = 2.162, p = .032.
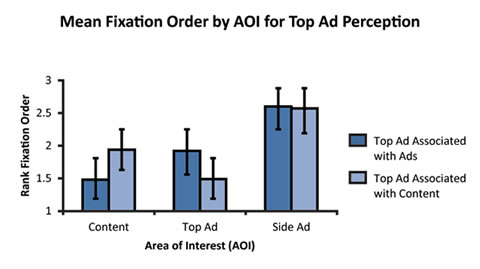
Figure 12. Mean rank fixation order for trials by AOI and Top Ad perception, shorter bars indicate the region was fixated earlier. Participants who associated the Top AOI with ads tended to fixate first on the Content, followed by the Top Ad AOI, while those that associated the Top AOI with Content fixated the Top Ad AOI first, followed by the Content. Both groups fixated on the Side Ad AOI last.
Whole page fixation count
If participants experienced text advertising blindness, it was expected that they would have more fixations on the entire target page in conditions where target items were located in advertising regions. Moreover, in conjunction with previous literature, it was expected that semantic searches would result in more whole page fixations than exact searches (Burke et al., 2005). Whole page fixation count was defined as the total number of fixations across all areas on the target web page.
A 2×3 ANOVA examined the fixation count across search type (exact, semantic) and target locations (Content, Top Ad, Side Ad) for successful trials. A significant interaction was observed between search type and target location, F(2, 246) = 7.379, p = .001, η2 = .057. Figure 13 illustrates the differences in fixation count between conditions.
Post-hoc analysis revealed that both the exact and semantic searches showed an increase in fixation count for Content and Top Ad target location trials with semantic searches having more fixations overall. However, the fixation count for the Side Ad target location condition was equal between search types.

Figure 13. Whole page fixation count for search type and target for successful trials, error bars are +/- one standard error.
Fixation count by AOI
Eye-tracking metrics were analyzed further as a function of AOI—Content, Top Ad, and Side Ad.
A within-subjects ANOVA was conducted to examine the overall differences in fixation counts across the three AOIs (Content, Top Ad, Side Ad). Mauchly’s test indicated that the assumption of sphericity had been violated (χ²= 27.232, p < .001), therefore degrees of freedom were corrected using the Huynh-Feldt estimates of sphericity (epsilon = .913). Results indicated a significant main effect for AOI, F(1.825,458.160) = 207.565, p < .001, η2 = .453. Participants fixated more in the Content AOI than the Top or Side Ad AOIs. Additionally, participants fixated more in Top Ad than Side Ad AOIs.
A three-factor mixed (2×3·3) ANOVA was conducted to examine differences in fixation counts for the three AOIs (Content, Top Ad, Side Ad) as a function of search type (exact, semantic) and target location (Content, Top Ad, Side Ad) on successful trials. Results indicated a significant interaction of AOI by target location, Wilks’ Λ = .235, F(4, 490) = 130.343, p < .001, multivariate η2 = .516. Post-hoc tests revealed several significant differences. When the task target was located in the Content region, participants fixated on the Content AOI more than the Top Ad AOI or Side Ad AOI. When the task target was located in the Top Ad region, participants had more fixations in the Top Ad AOI followed by the Content AOI and then the Side Ad AOI. However, when the task target was located in the Side Ad region, participants fixated less in the Top Ad AOI than the Side Ad and Content AOIs. It should be noted that when the target information was in the Side AOI, the number of fixations in the Content and the Side AOI was equal. Figure 14 illustrates the relationships between AOIs and fixation count. Figure 15 illustrates the relationships between AOIs and target location.

Figure 14. Fixation count of AOIs for successful trials, error bars are +/- one standard error.
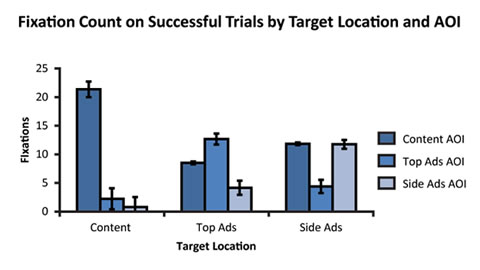
Figure 15. AOI fixation counts across target locations in successful trial completion, error bars are +/- one standard error.
Mean fixation duration by AOI
Mean fixation duration of AOIs should help differentiate between exact and semantic searches. In previous literature, it has been said that cognitive load varies with different search types (Rayner, 1998). AOI fixation counts were calculated by summing the number of fixations located within an AOI on the web page. Fixations were defined using the preceding definition. AOI mean fixation durations were calculated by averaging the duration of fixations found within an AOI on the web page.
A small number of samples were found in several conditions because mean fixation duration cannot be calculated in AOIs where no fixations exist. Therefore, the three factor mixed (2×3·3) ANOVAs could not be calculated for mean fixation duration. Target location was collapsed due to previous findings of a significant main effect for search type in the overall page analysis for mean fixation duration.
A two-factor mixed (2·3) ANOVA was conducted to examine differences of mean fixation duration for three AOIs (Content, Top Ad, Side Ad) for each participant across search type (exact, semantic) for successful trials. Results indicated a significant main effect for AOI, Wilks’ Λ = .779, F(2, 57) = 10.528, p < .001, multivariate η2 = .27. There was no main effect of search type. Post-hoc testing showed that participants had longer fixation duration in the Side Ad search than Content and Top Ads searches. Figure 16 illustrates the relationships between AOIs.
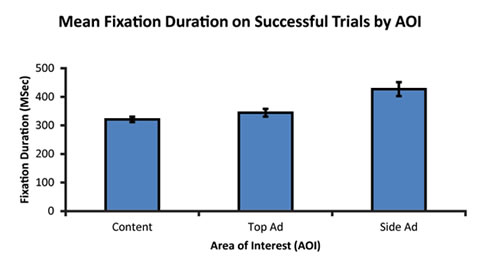
Figure 16. AOI mean fixation duration in milliseconds in successful trial completion, error bars are +/- one standard error.
Discussion
In this study, target information was located either within the content of the web page, in a top text ad region, or in a side text ad region. The success of participants during Content target location trials (82%) and the advertising related target location trials (Top Ad target location, 52.9%; Side Ad target location, 36.8%) indicate that locating target information within advertising areas was more difficult for participants, particularly in the side location. The high failure rates of locating targets within advertising areas suggest that users tend to ignore areas that are related to text advertising. Several metrics, including task success, task difficulty, task duration, fixation count, fixation duration, and AOI rank order support the notion of text advertisement blindness.
Rayner (1998) stated that cognitive workload is correlated with fixation duration and differs by task type. However, there were no differences in fixation duration between the two different search types (semantic and exact). This indicates that exact and semantic searches resulted in similar cognitive workloads. Fixation duration did differ according to AOI. Participant fixations in Side Ad AOIs resulted in longer fixations, signifying increased cognitive workload while searching side ads.
If participants were ignoring advertisements, it would be expected that the Top Ad AOI would be searched after the Content AOI was scanned and few differences in task duration would be noted. Instead, rank order analysis of first fixations in AOIs indicated that there were no differences in rank for Content and Top Ad AOIs. A possible explanation may be that the Top Ad AOI was situated between the content, main navigation, sub-navigation, and Side Ad AOI. Not only does this place the Top Ad AOI in the scan path when the participant moves from navigation regions to the Content AOI, but would be consistent with Rayner’s (1998) explanation that individuals initially direct their eye focus to the global center of displays. Additionally, it is consistent with Burke et al.’s (2005) finding that participants make anticipatory eye movements to the top banner region before the display of the stimulus. Perhaps a more plausible explanation for the observed behavior is that participants treated the Top Ad AOI as part of the content resulting in a less thorough search of the region. This seems likely given less than 50% of participants reported recall of advertisements in the Top Ad AOI, while 92% of participants reported advertisements in the Side Ad AOI. If they were seen strictly as advertisements, similar success rates would have been expected between Top and Side Ad AOIs (52.9% vs. 36.8%). Additionally, the order the Top Ad and Content AOIs were visited and the number of fixations on each AOI differed depending on whether the participants considered the Top Ad AOI as advertisements. When the Top Ad AOI was treated as content, this essentially became the beginning of the content of the web page for the user.
It is possible that users experienced a similar phenomenon in Buscher et al. (2010) in terms of ad/content congruency. When the advertisements were semantically congruent with the search results, participants fixated the top ad region more than the organic search results. When the ads were not congruent, participants fixated more towards the search results. Additionally, no differences depending on congruency were noted in the right ad AOI. Buscher et al.’s findings were very similar to results of this study.
Changes in search strategy during advertising related tasks were supported further by whole page fixation counts for successful trials. Semantic searches required participants to read content on the website to get the gist of the information and determine whether they were looking in an appropriate location instead of looking for more specific information contained within phrases that were used in exact searches. As expected, fixation counts between search types increased at the same rate for Content and Top Ad target locations. However, in Side Ad target location trials there was no difference between fixation counts. This supports the notion that there was a change in search strategy. Generally, semantic type targets garnered more fixations due to the increased density of fixations from reading than for exact searches, which were more amenable to page scanning. The differences between semantic and exact searches reflect this relationship in Content and Top Ad target location trials, including the small increase in the semantic search condition in the Top Ad target location trials. It could be that the increases in whole page fixation counts between searches for targets in the Content and Top Ad target locations are related to the Top Ad AOI being scanned after the Content AOI. However, there were no differences in rank order for both AOIs, except when rank fixation order was examined in terms of whether the Top Ad AOI was perceived as advertising. When the Top Ad AOI was thought of as advertisements, participants fixated first and more often on the Content AOI. Whether the Top Ad AOI was classified as being related to the content or as advertisements had no bearing on whether the participants were successful in their task.
The findings of this study support the EHS theory of search (Grier et al., 2007). The initial search of the content area matches the expected location searches. It is probable that because the main content areas were already searched, users began engaging in heuristic searches and subsequent systematic searches of the advertising areas.
Conclusion
Text advertising is subject to the same “blindness” effects as banner advertising. Users actively ignore text advertising unless it is required to complete their task or it is perceived as not being advertising. In this study, the style and content of the text advertisements were congruent with the content and style of the website, thus minimizing saliency differences between the text advertisements and the website. Likewise, differences in participant success between the Top Ad target location and Content target location conditions indicate that users differentiate between the types of content based upon more than the formatting appearance of the content. The only way to mitigate such an effect would be to make the advertising indistinguishable from the content, which would confuse users and potentially cross ethical boundaries. In fact, the Australian Competition & Consumer Commission (2007) filed suit against Google for failing to distinguish between organic search results and text advertisements in the Australian Google search results pages (www.google.com.au).
For website operators and advertisers that wish to generate revenue from text advertisements on websites, it is recommended that the ads be placed close to the website content. In a common website configuration, placing text advertising on the right side of the layout appears to be detrimental to the efficacy of the advertising. Users have an expectation that the right side of the page typically includes advertising and therefore ignore this area when exploring the page content when searching for information. For instance, visitors to Google exploring the latest category of search results will likely conclude the section called “Top Links” (see Figure 17) is advertising as this region is typically associated with advertising on Google.com.
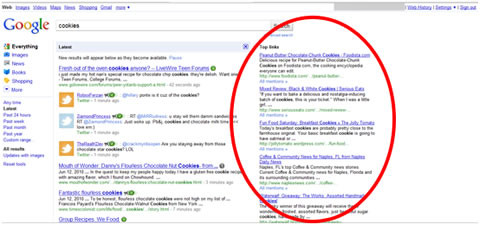
Figure 17. Latest results from Google.com
References
- AdWords (2011). Advertise your business on Google. Retrieved April 11, 2011 from Google Adwords (https://adwords.google.com/support/aw/bin/answer.py?hl=en&answer=6084)
- AdSense (2011). Google Adsense Ad Formats. Retrieved April 11, 2011 from Google Adsense (https://www.google.com/adsense/static/en/AdFormats.html)
- Albert, W. (2002). Do web users actually look at ads? A case study of banner ads and eye-tracking technology. In Proceedings of the Usability Professionals Association 2002 Conference. Orlando, Florida.
- Australian Competition & Consumer Commission (2007). ACCC alleges misleading and deceptive conduct by Trading Post and Google. Retrieved April 11, 2011 from Australian Competition & Consumer Commission (http://www.accc.gov.au/content/index.phtml/itemId/792088/fromItemId/142)
- Benway, J. P. (1998). Banner blindness: The irony of attention grabbing on the world wide web. In Proceedings of the Human Factors and Ergonomics Society 42nd Annual Meeting (pp. 463-467). Chicago, Illinois: HFES.
- Brooke, J. (1996). SUS: A quick and dirty usability scale. In P. Jordan, B. Thomas, B. Weerdmeester, & I. L. McClelland (Eds.). Usability evaluation in industry (pp. 189-94). London, UK: Taylor & Francis.
- Burke, M., Hornof, A., Nilsen, E., & Gorman, N. (2005). High-cost banner blindness: Ads increase perceived workload, hinder visual search, and are forgotten. ACM Transactions on Computer-Human Interaction, 12(4), 423-445.
- Buscher, G., Dumais, S., & Cutrell, E. (2010). The good, the bad, and the random: An eye-tracking study of ad quality in web search. In SIGIR 2010 (pp. 42-49). Geneva, Switzerland: ACM Press.
- Cooke, L. (2008). How do users search web home pages? An eye-tracking study of multiple navigation menus. Technical Communication, 55(2), 176-194.
- Fox, D., Smith, A., & Chaparro, B. S. (2009). Optimizing presentation of Adsense ads within blogs. In Proceedings of the Human Factors and Ergonomics Society 53nd Annual Meeting (pp. 463-467). San Antonio, Texas: HFES.
- Granka, L., Hembrooke, H., & Gay, G. (2006). Location location location: Viewing patterns on WWW pages. In Proceedings of the 2006 symposium on Eye-tracking research & applications (p. 43). San Diego, California: ACM Press.
- Grier, R., Kortum, P., & Miller, J. T. (2005). How users view web pages: An exploration of cognitive and perceptual mechanisms. HCI Research in Web Design and Evaluation, 22-41.
- Interactive Advertising Bureau (2010). IAB 2009 internet advertising revenue report [White Paper].
- Mosconi, M., Porta, M., & Ravarelli, A. (2008). On-line newspapers and multimedia content: An eye-tracking study. In SIGDOC 2008 (pp. 55-64). Lisbon, Portugal: ACM Press.
- Nielsen, J. (2003, April 28). Will pain-text ads continue to rule? Retrieved April 11, 2011 from Jakob Nielsen’s Alertbox (http://www.useit.com/alertbox/20030428.html)
- Nielsen, J. (2007, August 20). Banner blindness: Old and new findings. Retrieved April 11, 2011 from Jakob Nielsen’s Alertbox (http://www.useit.com/alertbox/banner-blindness.html)
- Pagendarm, M., & Schaumburg, H. (2001). Why are users banner-blind. The impact of navigation styles on the perception of web banners. Journal of Digital Information, 2(1).
- Prasada, Mahajan, & Bronnenberg (2003). Advertising versus pay-per-view in electronic media. International Journal of Research in Marketing, 20, 13-30.
- Rayner, K. (1998). Eye movements in reading and information processing: 20 years of research. Psychological Bulletin, 124(3), 372-422.
- Riegelsberger, J., Sasse, M. A., & McCarthy, J. D. (2002). Eye-catcher or blind spot? The effect of photographs of faces on e-commerce sites. In Proceedings of the 2nd IFIP Conference on e-commerce, e-business, e-government (i3e) (pp. 383-398), Lisbon, Portugal.
- Shrestha, S., Owens, J. W., & Chaparro, B. S. (2009). The effect of location and congruency of text ads on information search. In Proceedings of the Human Factors and Ergonomics Society 53nd Annual Meeting (pp. 463-467). San Antonio, Texas: HFES.
- Wolfe, J. M., Butcher, S. J., Lee, C., & Hyle, M. (2003). Changing your mind: On the contributions of top-down and bottom-up guidance in visual search for feature singletons. Journal of Experimental Psychology: Human Perception and Performance, 29, 483-502.
- Wolfe, J. M., Cave, K. R., & Franzel, S. L. (1989). Guided search: An alternative to the feature integration model for visual search. Journal of Experimental Psychology: Human Perception and Performance, 15(3), 419-433.
- Yesilada, Y., Jay, C., Stevens, R., & Harper, S. (2008). Validating the use and role of visual elements of web pages in navigation with an eye-tracking study. In WWW 2008, (pp. 11-19). Beijing, China: ACM Press.
- Zelinsky, G. J. (1996). Using eye saccades to assess the selectivity of search movements. Vision Research, 36, 2177-2187.
- Zelinksy, G. J., & Sheinberg, D. L. (1997). Eye movements during parallel-serial visual search. Journal of Experimental Psychology: Human Perception and Performance, 23, 244-262.