
Abstract
The authors report on a study in which 45 U.S. citizens in three geographic areas and over a range of ages and education levels voted on two ballots that differed only in the wording and presentation of the language on the ballots.
The study sought to answer three questions:
- Do voters vote more accurately on a ballot with plain language instructions than on a ballot with traditional instructions?
- Do voters recognize the difference in language between the two ballots?
- Do voters prefer one ballot over the other?
In addition to voting on the two ballots, study participants commented on pages from the two ballots and indicated their preference page-by-page and overall.
For this study, the answer to all three questions was "yes." Participants performed better with the plain language ballot. Their comments showed that they recognized plain language. They overwhelmingly preferred the plain language ballot.
The authors also discuss issues that arose on both ballots from problems with straight-party voting, with mistaking one contest for another, and with reviewing votes. Based on the study results, the authors provide guidance on language to use on ballots. This article includes links to the two ballots, other materials used in the study, and the full report with more details.
Practitioner’s Take Away
The following are key points from this study:
- Language matters. Study participants voted more accurately on the ballot with plain language than on the ballot with traditional language.
- Education matters. Level of education correlated with accuracy. Voters with less education made more errors.
- Location, gender, age, and voting experience do not matter. None of those factors was a statistically significant correlate of accuracy.
- People recognize plain language. After they voted both ballots, participants were shown pairs of pages (the A and B versions of the same ballot page) and were told, "Notice that the instructions on these pages are different. Please compare them and comment on them." Participants commented that certain words were "simpler," "more common," and "easier to understand."
- People prefer plain language. Asked for an overall preference between the two ballots, 82% (37 of 45) chose Ballot B, the plain language ballot.
- Straight-party voting confuses many people. Even on the plain language ballot, participants made errors related to straight-party voting.
- Some voters do not have a good grasp of levels of government. Many of the errors on both ballots related to confusing U.S. Senate with State Senator and County Commission with City Council.
- Usability professionals can help make ballots and other voting materials more usable through research and consulting.
- Even in a summative test, usability specialists often see ways to improve the product for its next release. In the study reported here, the plain language ballot did significantly better than the ballot with traditional language. Nonetheless, after watching participants work with the ballot, we realized we could make the language even clearer. We include recommendations for an even better plain language ballot.
Introduction
Voting is both a right and a responsibility for U.S. citizens. However, if people do not understand how to use the ballot or what their options are, they may not succeed in casting their votes to match their intentions.
In 2002, the United States Congress passed the Help America Vote Act (HAVA) to improve voting systems and voters’ access to ballots. HAVA gives the National Institute of Standards and Technology (NIST, part of the U.S. Department of Commerce) responsibility for providing technical support to develop voting system standards. NIST, in turn, realized that research and best practices would be needed to set standards for language, design, usability, and accessibility of voting systems.
The study we are reporting in this article is part of NIST’s efforts to provide research-based support for standards on ballot language.
What were we trying to learn?
In this study, we sought answers to three questions:
- Do voters vote more accurately on a ballot with plain language instructions than on a ballot with traditional instructions?
- Do voters recognize the difference in language between the two ballots?
- Do voters prefer one ballot over the other?
What is plain language?
A document is in plain language when the users of that document can quickly and easily find what they need, understand what they find, and act appropriately on that understanding. (For more details, examples, and resources about plain language, see http://www.plainlanguage.gov/ and www.centerforplainlanguage.org.)
Here are eight of the most critical plain language guidelines for ballots:
- Be specific. Give the information people need.
- Break information into short sections that each cover only one point.
- Write short sentences.
- Use short, simple, everyday words.
- Address the reader directly with "you" or the imperative ("Do x.")
- Write in the active voice, where the person doing the action comes before the verb.
- Write in the positive. Tell people what to do rather than what not to do.
- Put context before action, "if" before "then."
Where did the traditional and plain language instructions come from for this study?
In previous work for NIST, the first author, Ginny Redish, a linguist and plain language/usability expert, reviewed more than 100 ballots from all 50 U.S. states and the District of Columbia. The traditional language for Ballot A came from one or more of those ballots.
In that earlier project, Dr. Redish also analyzed the gap between the instructions on the ballots she reviewed and best practices in giving instructions (Redish, 2005). She then developed a set of guidelines for writing clear instructions for voters, focusing on the issues that arose in her earlier analysis (Redish & Laskowski, 2009). The plain language guidelines for Ballot B came from this document, which was originally presented to NIST in 2006.
Methods
We collected both performance and preference data.
For performance data, participants voted on two ballots that differed only in the wording and presentation of language (and the names of parties and candidates). To account for practice effects, we counter-balanced the order in which participants voted. (That is, Participant 1 voted Ballot A, then Ballot B. Participant 2 voted Ballot B, then Ballot A, and so on.)
For preference data, after participants voted both ballots, we showed them the comparable pages from the two ballots, asked them to comment on the differences they saw, and then required a forced choice of preference for each set of pages. After they had gone through all the pairs of pages, we asked for an overall preference with the options of Ballot A, Ballot B, no preference, and the reason for their preference.
Where did we do the study?
We collected data from 45 participants in 3 locations during May and June 2008. Our 3 locations (in alphabetical order) were
- Baltimore, Maryland (N=17),
- East Lansing, Michigan (N=14), and
- Marietta, Georgia (N=14).
We chose the locations for both geographic spread (Middle Atlantic, South, Midwest) and diversity in the type of community (urban, small town, suburban community with a large minority population). In each location, we held the sessions in the usability center of a university. However, our participants were not students at those universities. They were people who live or work in the local communities. (Some of our participants were taking college classes, but no one was studying at the institution where they came to participate in the study.)
Who participated?
We recruited based on two criteria:
- American citizens 18 and older (that is, people who are eligible to vote, whether or not they have ever voted, whether or not they have ever registered to vote)
- Fluent English speaking (as found in a telephone screening interview, so not necessarily native speakers)
All of our participants met these criteria.
Although the following were not screening criteria, we were pleased to achieve diversity in gender, ethnicity, and age.
- Participants were 23 women and 22 men.
- We did not select for ethnicity or race, but we did end up with a diverse set of participants. By our observation, we had 21 Caucasians and 24 people of other ancestry.
- We wanted people over a wide range of ages. Our youngest participants were 18 years old; the oldest was 61. The average age was 36.
Because ballots must be understandable and usable to people regardless of their education, we focused on people with high school or less or with some college but not advanced degrees. By including people with lower levels of education, we hoped to understand more about issues that other researchers had raised regarding voters with lower education levels (Herrnson et al., 2008; Norden, Creelan, Kimball, & Quesenbery, 2006; Norden, Kimball, Quesenbery, & Chen, 2008).
We succeeded in recruiting based on our study plan, and, indeed, education turned out to be the only participant characteristic that correlated with accuracy in our results. Table 1 shows our participants by education level.
Table 1. Number of participants at each education level (N=45)
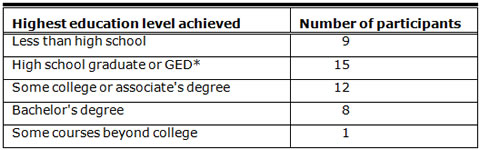
*GED = General Education Development, a series of tests that people can take to show they have the equivalent of a high school education. Many people who drop out of high school take the GED later in life.
How did we recruit participants?
A professional recruiter helped us find appropriate participants. Participants came to us through the following channels:
- Community groups in the locations where we were testing
- Professional and personal networks
- Online classifieds
- Asking people who came through any of the first three channels to refer others who met the screening criteria
Some of our participants, therefore, came to us because they responded to a request online. However, not all did. Some came through referrals. For example, one older gentleman had no email address. His niece read about the study and served as our initial contact to him.
Furthermore, even though most of our participants used email, had a cell phone, and were savvy about other technology, their sophistication with technology did not necessarily mean that they understood what a ballot is like, were used to ballots, or could vote accurately.
How were the ballots presented?
The ballots simulated the experience of electronic voting. However, we did not use any of the currently existing Direct Recording Electronic (DRE) voting systems.
Several reasons supported that decision:
- We did not want to bias the study with the experience or lack of experience any participant might have had with one or another of the currently existing DRE systems.
- Because we were testing instructions and not navigation or casting modes, we did not want to test the specific modes or buttons of just one current DRE system at the expense of not testing the modes or buttons of other DRE systems.
- Also, our ballot design, with instructions on the left and choices on the right, is difficult to program in the DRE systems that existed at the time of the study.
Instead, the ballots were programmed into and presented on identical touch-screen tablet PCs. The PCs were Sahara Slate Tablekiosk L2500s with a 12.1 inch XGA screen.
You can see the setup that we used in Figure 1.
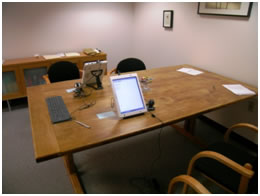
Figure 1. The setup that we used in the study
What were the ballots like?
We adapted our ballots from the NIST "medium complexity" test ballot (NIST, 2007). This is the ballot that Design for Democracy/AIGA used in its project for the Election Assistance Commission (Design for Democracy, 2007).
The NIST test ballot includes straight-party voting and has 12 party-based contests, two retention questions, and six referenda. In some contests, it requires more than one screen of candidates.
We adapted this ballot by slightly reducing the number of party-based contests and the number of referenda, including a few non-party-based contests, and never having more than one screen of candidates in a contest. Each of the ballots in our study included straight-party voting, ten party-based contests, two non-party-based contests, two retention questions, and three referenda.
The screen design and navigation were identical for both ballots.
We kept the same type font and type size in both ballots. We also followed best practices in information design. The political parties were indicated by color names to avoid any bias for or against actual parties. We did not name any party either Red or Blue.
Candidates’ names were made up but resembled a range of typical names. Research by the ACCURATE group at Rice University has shown that study participants are just as accurate and not put off by voting ballots with made-up names as by voting ballots with names of people they recognize (Everett, Byrne, & Greene, 2006).
You can see the ballots in the full report at the NIST web site (Redish et al., 2008, Appendices 2 and 3, 118-171). The ballots are also available separately at http://www.nist.gov/itl/vote/upload/Ballot-A.pdf and http://www.nist.gov/itl/vote/upload/Ballot-B.pdf.
What happened in each session?
Each participant came for an individual one-hour session. The timing of actual sessions ranged from about 45 minutes to about 70 minutes.
Each session had the following major parts:
- Introduction and signing the Informed Consent form
- Voting on two ballots in sequence (A, B or B, A) with a short distracter task in between
- Forced-choice, page-by-page comparison of 16 pages of the two ballots with a written request for a final overall preference
- Questionnaire about demographics, voting experience, and experience with technology, followed by our thanking and paying the participant
Each person received $75 in cash for participating in the study.
What tasks and directions did we give participants as voters?
Just before they voted each ballot, we gave participants a sheet of specific directions to work with. This sheet told participants what party to vote for, what party-based contests to change, which contest to write in a candidate, and how to vote in all the non-party-based contests and for all the amendments/measures. Participants read through the directions for each ballot just before starting to vote on that ballot. They also kept the directions with them to refer to as they went through the ballot. When participants were at the Summary/Review screen at the end of each ballot, we gave them two additional directions that caused them to go back and vote differently in two contests.
We couched each direction in a sentence that put participants into the voting role. For example, the direction for the task of writing in a candidate for Ballot A was “Even though you voted for everyone in the Tan party, for Registrar of Deeds, you want Herbert Liddicoat. Vote for him.”
When they got to the Registrar for Deeds contest on Ballot A, participants saw that Herbert Liddicoat was not on the ballot. They then had to (a) realize that they needed to write him in and (b) succeed at writing in his name in the right way.
This way of giving directions to participants is typical of research on ballots (Conrad et al., 2006; Everett et al., 2006; Greene, Byrne, & Everett, 2006; Selker, Goler & Wilde, 2005; among others). Giving participants these directions was necessary to measure accuracy.
The directions for Ballot A and Ballot B were identical except for the names of the parties and candidates.
Figure 2 lists the tasks participants did (the different voting behaviors). These are not the specific directions that participants were given. For the specific directions that participants worked with, see the full report (Redish et al., 2008, Appendix 7, 183-185).
|
Vote for all the candidates from one party at the same time (straight-party). Review the straight-party candidates to accomplish some of the other directions, leaving some alone and changing others per the directions. Write in a candidate instead of their party’s candidate. Change a vote from the candidate of their party to the candidate of another party in a “vote for one” contest. Change votes in a “vote for no more than four” contest. (This and the previous two tasks required “deselecting” one or more of their party’s candidates if they had successfully voted straight-party.) Skip a contest. Vote per the directions in several non-party-based contests and for three amendments/measures. (The language of the directions carefully avoided exactly matching the wording of either ballot.) Go back and vote the skipped contest from the Summary/Review page. Change a vote from the Summary/Review page. (This and the previous task were directions given on paper to the participant at the appropriate time—when the participant was on the Summary/Review page.) Cast the vote and confirm the casting. |
Figure 2. List of voting behaviors in the study (To accomplish this list of behaviors, voters worked with a set of directions, as described in the text of this article.)
Results
We set out to answer three questions:
- Do voters vote more accurately on a ballot with plain language instructions than on a ballot with traditional instructions?
- Do voters recognize the difference in language between the two ballots?
- Do voters prefer one ballot over the other?
The answer to all three questions for this study is "yes."
Participants voted more accurately on the ballot with plain language instructions
Each ballot in this study had 18 pages where participants voted (plus 8 other non-voting pages). We gave participants explicit directions for voting on 11 of those 18 pages. For 7 pages, we gave no directions, but the absence of directions for those specific contests was, in fact, an implicit direction to not change votes on those 7 pages.
Table 2 shows the correct and incorrect votes on the two ballots: Ballot A with traditional language instructions and Ballot B with plain language instructions.
Table 2. Participants voted more accurately on Ballot B, the plain language ballot (45 participants, 18 possible correct votes on each of two ballots).
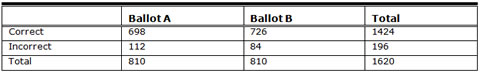
A within-subjects (or repeated measures) analysis of variance (ANOVA) between the number of correct votes for the ballots showed that the difference in accuracy between the two ballots is marginally statistically significant (Ballot A mean of 15.5; Ballot B mean of 16.1, F1,43=3.413, p < .071).
Using the plain language instructions first, helped participants when they got to the ballot with traditional instructions
The number of correct votes on the plain language ballot (Ballot B) differed very little whether participants voted it first or second. However, the number of correct votes on the traditional language ballot (Ballot A) increased from 14.4 for participants who voted Ballot A first to 16.3 for participants who voted Ballot A second. The interaction between which ballot was seen first and the total number of correct items on a given ballot is statistically significant (F1,43=23.057, p < .001). As Figure 3 shows, using the plain language instructions first, helped participants when they got to the ballot with traditional instructions. The reverse order effect (traditional instructions helping on the plain language ballot) was not nearly as strong.
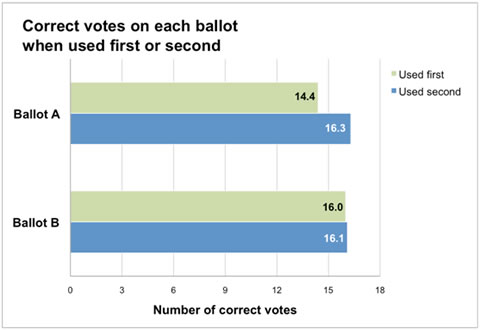
Figure 3. Participants who worked with B first (plain language ballot) did better on A (traditional language ballot) than participants who worked with A first.
Education level made a difference in how accurately different groups of participants voted
We looked at correlations of accuracy with location (our three geographic sites) and with participants’ characteristics (gender, age, voting experience, and education level). Location, gender, age, and voting experience were not statistically significant differentiators of accuracy. Education was. Less education was associated with more errors (r = -.419, p < .004, effect size R2 = 0.176).
Participants recognized the difference in language
The answer to our second question, "Do voters recognize the difference in language between the two ballots?” is also “Yes.”
After voting both ballots, the participant moved with the moderator to another table. The moderator had two stacks of printed pages, a stack from each ballot. The moderator worked with the participant using the section of the test script that you see in Figure 4.
|
Thank you very much for voting both of those ballots. I would like to go over them in more detail with you now. I am going to show you some of the pages from the two ballots. I will show you the same page from both ballots at one time. On each set of pages, I want you to compare the instructions and comment on them. [The moderator then turns over the first page of instructions for both ballots – always with the ballot the participant voted first on the left – and points out which is Ballot A and which is Ballot B. Every page also has A or B in a large letter on the top of the page. The moderator continues:] Notice that the instructions on these pages are different. Please compare them and comment on them. [When the participant stops commenting, the moderator continues:] Thank you for your comments. Do you have anything else you would like to say about these two pages? [When the participant indicates that she or he has no more comments, if the participant has not clearly expressed a preference yet, the moderator asks:] If you had to choose one of these two pages for a ballot, which would you choose? |
Figure 4. An excerpt from the test script showing how the moderator worked with the participant in the preference part of the session
Although we did not use the words "plain language, "language," or "design" when inviting participants to comment—nor at any time during the session—their comments clearly indicated that they were reacting to and recognized the difference in the wording and presentation of the instructions.
The following are just a few typical examples of what participants said:
Comparing the instructions to voters (at the beginning of each ballot)
Participant A3
About Ballot A: I don’t like the paragraph being so large and all together.
About Ballot B: I like the bullets and that the important points are in bold.Participant A6
About Ballot A: The paragraph form is so long. I gotta read all of this.
About Ballot B: I prefer this; it’s less wordy.Participant B17
About Ballot A: When I first read this, I was overwhelmed. I had to read it three times. There was so much to remember.
Comparing the pages about State Supreme Court Chief Justice where A uses "Retention Question" and "retain" and B names the office and uses "keep"
Participant A4
"Keep" is short and sweet compared to "retain." Some people might not know what that ["retain"] means.Participant C32
"To keep." Yes, yes, I do [want to keep her]. Like I’m thinking 30 seconds less.
Comparing "accept/reject" to "for/against" as choices for measures:
Participant B15
I prefer "for/against"; they are simpler words.Participant B23
I prefer "for/against"; it’s what a normal voter would say; it’s a more commoners’ level.Participant C35
"For/against" are more common words than "accept/reject."
Participants overwhelmingly preferred the plain language instructions
Both in the page-by-page comparison and in their final, overall assessment, participants chose the plain language ballot most of the time. On 12 of the 16 pages in the comparison, participants selected the Ballot B page more than 60% of the time. For those pages, the participants’ choice of B ranged from 64% to 98%.
The page with the highest preference for Ballot B was the final Thank you page. Ballot A just said "Thank you." Ballot B said, "Thank you." and then also said, "Your vote has been recorded. Thank you for voting." Participants overwhelmingly wanted to know that their vote had been recorded.
Participant A8
It’s courteous, telling you it’s recorded.Participant B25
It makes you feel good. You feel better leaving. You know what happened.
In addition to the pages described earlier (initial instructions to voters, "keep" versus "retain," and "for/against" versus "accept/reject,") another page where participants significantly preferred Ballot B was the screen for writing in a candidate. On Ballot A, the page had a touch-screen keyboard and very minimal instructions. On Ballot B, the page had detailed instructions—well-written, well-spaced out, with clear steps, and instructions with pictures color-coded to match the action buttons (e.g., accept or cancel). The more detailed instructions were preferred by 87% of the participants (39 of 45).
Participant A5
[B is] more user-friendly; it tells you what to do if you make a mistake.Participant B26
[B]; It’s more in detail; it tells you what it really wants you to do.
On 4 of the 16 pages in the comparison, the participants’ choice was very close between the two ballots, and on 3 of those 4 pages, Ballot A was preferred slightly more often (ranging from 51% to 56% of the participants). Three of the pages that were very close in preference only had instructions about the maximum number that a voter could choose. For example, in the contest for County Commissioners, 23 of 45 participants preferred the Ballot A instruction "Vote for no more than five" while 22 of 45 preferred the Ballot B instruction, "Vote for one, two, three, four, or five."
The page that received the highest percentage preference for the Ballot A version was the page for the President/Vice President contest where Ballot A was, in fact, more explicit than Ballot B. Ballot B just said, "Vote for one." Ballot A said, "Vote for one. (A vote for the candidates will actually be a vote for their electors.)" We put the extra wording on Ballot A because we thought people would find it difficult to understand and unnecessary. And, indeed 44% (20 of 45) participants had a negative reaction to the extra sentence on Ballot A.
Participant B28
You don’t really need all that.Participant C35
It’s information I don’t care about. It just confused me more.
But 56% (25 of 45) thought people would want the extra fact.
Participant A9
I’m not sure it’s necessary, but in the interest of full disclosure, it’s more accurate.Participant C39
It’s better to have more information.
For detailed statistics and discussion of participants’ page-by-page preferences, see the full report (Redish et al., 2008, Part 4, 72-102).
A large majority (82%) of participants chose Ballot B for their overall preference
The answer to our third question, “Do voters prefer one ballot over the other?” is a resounding “Yes” in favor of Ballot B, the ballot with plain language instructions. Eighty-two percent (37 of 45 participants) chose Ballot B for their overall preference. Just 9% (4 of 45) chose Ballot A, and 9% (4 of 45) chose “no preference.” The choice of the plain language instructions for ballots is statistically significant (p<.001).
This study allowed us to observe as well as count errors
Most research studies about voting look at residual votes (undervotes and overvotes) as errors. However, those researchers are reviewing ballots after an election. They rarely know why the errors happened. Did voters simply choose not to vote in a particular contest? Did they not understand the instructions on the ballot or in the help? Was the design hindering them? What specifically about the language or design was a problem? Research that focuses on already-cast ballots can only speculate. (See, for example, Alvarez, Goodrich, Hall, Kiewiet, & Sled, 2004; Kimball & Kropf, 2005; Norden, Kimball, Quesenbery, & Chen, 2008.)
In this study, we were able to observe people as they voted. Just by observing the act of voting, we learned a lot about when and how our participants had trouble with these ballots. In addition, many participants talked as they were voting about what they were doing and why they did what they did. These observations along with the error data help us to understand why participants had problems with both ballots.
Participants still had problems with both ballots
Plain language was better. But even the plain language ballot could not overcome some problems participants had. On both ballots, participants
- were confused by the concept of straight-party voting,
- changed contests at the wrong level of government, and
- misunderstood the use of red to show undervoting on the Summary/Review screen.
Straight-party voting is confusing
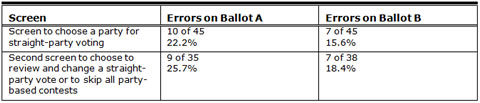
Participants were more likely to correctly select straight-party voting on Ballot B (84.4% correct) than on Ballot A (77.8% correct). However, that still leaves a high error rate on both ballots, as you can see in Table 3.
One participant on A chose the wrong party. All the other errors in Table 3 for the first straight-party page were people not choosing a party when we directed them to vote straight-party and then change a few party-based contests. In a real election, not voting straight-party would not be an error. Voting contest by contest is acceptable. We coded it as an error because it was contrary to our directions and was an indication that the language on the ballot was not helping people understand the options for and implications of voting straight-party and then changing party-based contests.
The "errors" for the second straight-party page were from our observations. The second straight-party page only asked for a navigation choice—skip to the first non-party-based contest or go through the party-based contests to review and possibly change a party-based vote.
Table 3. Participants did not make correct choices on the straight-party screens
In a recent study that focused on straight-party voting (SPV), Campbell and Byrne also found problems. "Voters had significant difficulty in interpreting SPV ballots and were reluctant to generate them, though this was improved when ballots had more clear and detailed instructions. Participants also tended to believe that SPV should not work the way they believed it had worked on ballots they had previously seen" (Campbell & Byrne, 2009, p. 718).
Campbell and Byrne are continuing to study straight-party voting.
We speculate that the result in our study comes from one or more of the following reasons:
- Many voters are not familiar with straight-party voting. (Some states have straight-party voting and some do not. Of the three states where we conducted the study, Michigan allows straight-party voting. But location made no difference in how voters did in this study.)
- Many voters are not aware of which contests are typically party-based and which are not.
- Many voters do not know the word "partisan." (Ballot A used that word; Ballot B did not.)
- The concept of being able to vote straight-party and then change a straight-party vote is difficult for many voters. This option is only available in electronic voting, so people with experience in paper-based voting may find it confusing.
Many voters do not understand levels of government
A second problem participants had with both ballots was changing the wrong contest. They mistook the U.S. Senate contest for the State Senate contest we directed them to change. They mistook the County Commissioners contest for the City Council contest we directed them to change. On the ballot they were voting, the U.S. Senate contest came before the State Senate contest. The County Commissioners contest came before the City Council contest.
To a certain extent, this problem might not arise in a real election where people know for whom they want to vote and know what roles those people have. Participants in our study were voting according to directions we gave them for people whose names and roles were new to them.
However, from comments participants made and our observations as well as the error data, we think the following reasons contributed at least somewhat to this problem:
- Voters must know a lot about how elections work to follow a ballot.
- Few voters, especially younger people, have had a course in civics, and many voters may not understand different levels of elected office.
- With an electronic voting system, voters do not see the entire ballot at one time. They do not know what contests are yet to come.
- Experience with other technology does not necessarily carry over to give voters a good mental model of using an electronic voting system.
Red boxes on the Summary/Review page confused some voters
A final problem that we must discuss from this study is what happened on the page that participants came to after they finished voting. Ballots A and B both had a page that showed participants how they had voted. On that page, contests in which they had not voted for the maximum number possible were shown in red. (See Figure 5.) This is a common graphical/interaction treatment for undervoted contests in electronic voting.
From our notes and reviews of the video recordings, 22 participants (49%) had no questions or problems on the Summary/Review page for either Ballot A or Ballot B. They were able to reach the end of the ballot having marked the choices as they intended and were ready to cast their ballots. Of those who had no observable questions or problems, 7 voted on Ballot A first and 15 voted on Ballot B first. This suggests that the instructions on Ballot B were more helpful to participants than the instructions on Ballot A.
However, more than half (23 or 51%) did have questions or problems on the Summary/Review page on at least one of the ballots. This is a disturbing number.
These problems were overwhelmingly related to resolving votes shown in the red boxes. Observational data tells us that 17 participants (37.8%) verbalized questions or concerns about the red boxes. (Note that because of errors they made while voting, some participants had much more red on the Summary/Review page than Figure 5 shows.)
This participant’s comment sums up the problem many participants had:
Participant B26
[Reads the instruction about red messages.] But I did. I did what it told me to do. … I voted for the number of candidates. I’m concerned that it should have turned to blue. That would make me sure that I did the right thing. I wouldn’t vote because [the red] is telling me I’m not doing the right thing.
Participants went to extraordinary lengths to get red boxes to turn to blue. They voted for candidates they did not really want or wrote in people to fill out the correct total, including adding blank write-in votes or writing in names they knew were fake, celebrities they knew were not running, or their own or friends’ names
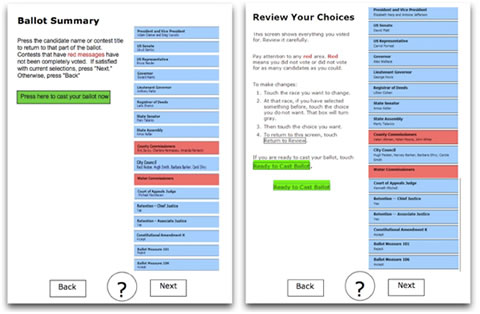
Figure 5. After voting, participants came to a Summary/Review page that showed how they had voted. The pages in this figure—Ballot A on the left and Ballot B on the right—show red for the two contests where participants were directed to vote for fewer than the maximum or none at all. (The page that the participant saw may have shown different contests in red, depending on how that participant had actually voted.)
In the end, following our further direction given at this page, participants could have cleared the red from one of these two contests—voting for the Water Commissioners, a contest we had earlier directed them to skip. However, following our directions, they could have still undervoted that contest by only voting for one (not two) Water Commissioners.
Also, by our directions, participants should have left the County Commissioners contest in red (undervoted). To turn the box blue, participants would have had to vote for five people for County Commissioner. However, only three candidates belonged to the political party that participants were voting for (Tan party on A, Lime party on B). Our directions to vote straight party and our not giving participants a direction to change from that straight-party vote for County Commissioners meant that a correct vote left the County Commissioner contest box red.
In our recommendations, we suggest better instructions for the Review page. We also suggest putting more information in the boxes, as we show in Figure 6, telling people for whom they have voted, those people’s parties (in party-based contests), and how many more people they could vote for when they have undervoted.
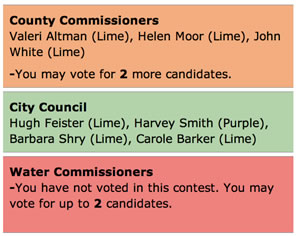
Figure 6. More information in the box for each contest on the Review page may help people better understand when they have undervoted a contest and what their options are.
We believe that better instructions and more information will help, and we also recommend using a less strong color, such as amber, for contests where the person has voted for fewer than the maximum number and a toned-down red for contests where the person has not voted at all. For many of our participants, it was clearly the "redness" of the signal that caused them to go to extremes to "make it right."
Participant A2, after voting for one water commissioner
Why is it still red?Participant A3, on seeing the red boxes
There’s something I did wrong.Participant A13, after voting for one water commissioner
Why is it red? Why is it still red? So I have to vote for two.
Recommendations
This section covers two types of recommendations:
- recommendations for local election officials about language to use on ballots
- recommendations for usability specialists about future research
Recommending ballot language
The United States does not have a single uniform ballot, not even when there is a federal election. Instead, federal contests are put together with state, county, and local contests into ballots that may differ for each voting precinct. Local election officials create those ballots, following state and local laws. They create the ballots for their specific voting technology (DRE, optical scan, paper and pencil, and so on). They may have to create several versions to accommodate different technologies, for example for in-person voting and mail-in voting.
Thus, we cannot create a model ballot that all local election officials can use. Instead, in the rest of this paper we give our overall recommendation and a set of guidelines for accomplishing it. We have also created Ballot "C"—our Ballot B revised to alleviate problems participants had even with the plain language ballot in our study. Sixteen of the pages of Ballot C, representing all the different types of pages in the ballot, are available at http://www.nist.gov/itl/vote/upload/Ballot-C.pdf.
The following are our recommendations:
- Recommendation 1: Use plain language in instructions to voters.
Guidance for Recommendation 1: See the guidelines in the Appendix to this article. This Appendix is also Appendix 10 in the full report. - Recommendation 2: Consider removing straight-party options from ballots.
- Recommendation 3: Do more voter education.
- Recommendation 4: Test ballots with voters before each election.
Because local election officials constructing ballots are going to continue to make decisions on every page of every ballot for every election, all ballots need usability testing. The best way to guard against disaster in an election due to ballot design or language is to have a few actual target voters try out the ballot before the design and language become final. The methodology for having voters try out a draft is usability testing (Rubin & Chisnell, 2008). We strongly recommend this behavioral test with actual voters. Having election officials review the ballot may show functional and copy edit problems, such as a misspelled name; but some problems (such as people not seeing a contest, not seeing an important instruction, or voting contrary to their intent) will become apparent only when a few voters try out the ballot.
The Usability Professionals’ Association’s project on Usability in Civic Life has a kit to help local elections officials learn about, plan, conduct, and learn from usability testing. (Usability Professionals’ Association, Usability in Civic Life Project, Voting and Usability Project. The LEO Usability Testing Kit. http://www.upassoc.org/civiclife/voting/leo_testing.html)
The following web sites are other resources about usability testing:
Recommending future research
This study (like all specific research studies) was limited. In this study, education mattered; but we did not specifically test our low-education participants for low literacy. Our participants ranged in age from 18 to 61, but we did not concentrate on older adults although we know that aging brings memory problems, vision problems, and more. Our study focused on reading; we did not include people with special needs, such as those who must listen to rather than see the ballot. We studied electronic ballots, not paper. The ballots were only in English.
Future research might investigate the following questions:
- How well do low-literacy voters succeed with a plain language ballot?
- Does plain language make as much (or perhaps even more) difference for older adults?
- Does plain language make as much (or perhaps even more) difference for blind and low-vision people who must listen to rather then read the ballot?
- Do our results about plain language on ballots in English carry over to other languages?
- How could our findings be implemented on a paper ballot?
- Would removing the straight-party option improve success on all parts of the ballot?
- Will changing the color of undervoted boxes make a difference? Will changing instructions on the Review page make a difference? Will adding more information in the boxes on the Review page make a difference?
- What type of voter education is most effective in helping people understand the process of voting, where contests come on typical ballots, what the different levels of government are, and so on?
- Would a similar study with the ballots of other voting systems in other countries have similar results?
Conclusions
Although many election officials know that language matters; many do not know just what about language matters, how much it matters, or what to do about the wording on ballots. Through this NIST-sponsored research, we now have evidence that plain language affects voting accuracy, especially for voters with lower levels of education. Not only does plain language help voters vote the way they intend, voters recognize differences in language and greatly prefer to have plain language instructions.
In this study, U.S. citizens voted more accurately on a ballot with instructions in plain language than on a ballot with instructions in traditional language. When asked to compare pages from the two ballots, these same voters recognized plain language, preferring short, simple words, short paragraphs, and clear explanations. When asked for an overall preference (Ballot A, Ballot B, no preference), 82% chose Ballot B, the ballot with plain language instructions.
We have presented the findings from this study to local election officials from across the U.S. They have been eager to have evidence-based information on how to write instructions for ballots. Some have gone as far as working with state legislators to change election laws to make room for plain language in elections. It has been gratifying to know this work is gradually being adopted throughout the U.S. for ballots and other election materials.
Plain language is a critical part of making voting easier and more accessible for all voters. Other critical parts include the information design and the interaction design (both of which we held constant in our study). However, even clear instructions cannot compensate for all problems in voting. In particular, straight-party voting remained confusing to many voters, as did contests at different levels of government, and being shown their undervotes in bright red boxes.
References
- Alvarez, R. M., Goodrich, M., Hall, T., Kiewiet, D. R., & Sled, S. M., (2004). The complexity of the California recall election. VTP Working Paper #9, CalTech/MIT Voting Technology Project. Available at http://www.vote.caltech.edu/drupal/node/26.
- Campbell, B. A., & Byrne, M, D. (2009). Straight-Party Voting: What Do Voters Think? IEEE Transactions on Information Forensics and Security, 4 (4), 718-728.
- Conrad, F. G., Lewis, B., Peytcheva, E., Traugott, M., Hanmer, M. J., Herrnson, P. S., Niemi, R. G., & Bederson, B. B.(2006, April 22). The usability of electronic voting systems: Results from a laboratory study, paper presented at the Midwest Political Science Association, received from Conrad, F.G.
- Design for Democracy/AIGA (2007). Effective Designs for the Administration of Federal Elections. Available at http://www.aiga.org/content.cfm/design-for-democracy-eac-reports.
- Everett, S., Byrne, M., & Greene, K. (2006) Measuring the usability of paper ballots: Efficiency, effectiveness, and satisfaction. Proceedings of the Human Factors and Ergonomics Society 50th Annual Meeting. Available at http://chil.rice.edu/research/pdf/EverettByrneG_06.pdf.
- Herrnson, P. S., Niemi, R. G., Hanmer, M. J., Francia, P. L., Bederson, B. B., Conrad, F. G., & Traugott, M. (2008). Voters’ evaluations of electronic voting systems: Results from a usability field study. American Politics Research, 36 (4), 580-611.
- Greene, K., Byrne, M., & Everett, S. (2006). A comparison of usability between voting methods. Proceedings of the 2006 USENIX/ACCURATE Electronic Voting Technology Workshop. Available at http://www.usenix.org/events/evt06/tech/.
- Kimball, D. C., & Kropf, M. (2005). Ballot design and unrecorded votes on paper-based ballots. Public Opinion Quarterly, 69 (4), 508-529.
- NIST (2007). Usability Performance Benchmarks for the Voluntary Voting System Guidelines. Available at http://vote.nist.gov/meeting-08172007/Usability-Benchmarks-080907.doc.
- Norden, L., Creelan, J., Kimball, D., & Quesenbery, W. (2006). The Machinery of Democracy: Usability of Voting Systems. Brennan Center for Justice at NYU School of Law, available at http://www.brennancenter.org/content/resource/the_machinery_of_democracy_voting_system_usability/.
- Norden, L., Kimball, D., Quesenbery, W., & Chen, M. (2008). Better Ballots. Brennan Center for Justice at NYU School of Law. Available at http://www.brennancenter.org/content/resource/better_ballots/.
- Redish, J. C., Chisnell, D. E., Newby, E., Laskowski, S. J., & Lowry, S. Z. (2008). Report of Findings: Use of Language in Ballot Instructions, NISTIR 7556. Available at http://www.nist.gov/itl/vote/upload/NISTIR-7556.pdf.
- Redish, J. C. (2005). Review of the gap between instructions for voting and best practice in providing instructions. Available at http://www.nist.gov/itl/vote/upload/instructiongap-2.pdf.
- Redish, J. C., & Laskowski, S. J. (2009, originally 2006). Guidelines for Writing Clear Instructions and Messages for Voters and Poll Workers, NISTIR 7596, Available at http://www.nist.gov/itl/vote/upload/032906PlainLanguageRpt-2.pdf.
- Rubin, J., & Chisnell, D. E. (2008). Handbook of usability testing: How to plan, design, and conduct effective tests, 2nd edition. Indianapolis, Indiana: Wiley Publishing, Inc.
- Selker, E. J., Goler, J. A., & Wilde, L. F. (2005). Who does better with a big interface? Improving voting performance of reading for disabled voters. VTP Working Paper #24, CalTech/MIT Voting Technology Project. Available at http://vote.caltech.edu/drupal/node/78.
- User-Centered Design (2006). Preliminary Report on the Development of a User- Based Conformance Test for the Usability of Voting Equipment. Available at http://vote.nist.gov/032906User-BasedConfTesting3-10-06.doc.