
[:en]
Abstract
An online feedback survey for the 2020 United States Census Partnership program included a question asking respondents to rank the amount of time they spent on six job-related tasks. For this study, we randomly assigned respondents to answer this question using either the numeric entry or drag-and-drop option available in Qualtrics™. We compared the two designs by their distribution of rankings and by the amount of time respondents spent on-screen to answer the question. The distribution of rankings did not vary by design, and we found no differences in time-on-task.
However, we did uncover certain challenges while analyzing the data that should be taken into consideration when using these specific ranking designs. The drag-and-drop option produced a dataset that appears cleaner because all items are ranked (which is true even if only one item is moved), yet some rankings may be “forced” if a respondent intended to skip an item. The numeric entry option, however, gives respondents the capability to rank multiple items equivalently. This can be useful if a researcher would like to allow respondents to express ambivalence about the relative ranking of items, but it also often results in out-of-range responses.
Keywords
Ranking questions, numeric entry, drag-and-drop option, drag and drop, Qualtrics
Introduction
Ranking questions ask survey participants to arrange items in a list according to the respondent’s preferred order (Krosnick & Alwin, 1988). Two of the most common ways to implement ranking questions in online surveys are with drag-and-drop and numeric entry options. The drag-and-drop option is unique to electronic surveys because it requires respondents to move each item either by dragging it, or by selecting an arrow to move it, into the preferred position within a list. This allows respondents to visualize the final order of their response. The numeric entry option works similarly for paper and electronic surveys. With a numeric entry option, the respondent assigns a number to each item, but visually the items stay in the same position. Although there is research comparing drag-and-drop and numeric entry options, questions remain regarding these particular designs. This research addresses two questions: 1) Does using one or the other design result in a different response distribution? 2) Is one design easier or more difficult to use, as measured by time-on-task?
To answer these questions, we embedded a two-condition, randomized experiment into an online employee survey of United States Census Partnership Specialists and Coordinators. As part of the survey, respondents were asked to rank the amount of time they spent on each of six job-related tasks. They were assigned either to drag and drop the item or enter a number beside the item to indicate its position. Job tasks were presented in a randomized order. We examined response distributions of the rankings between the two designs and examined user effort by comparing time-on-task.
In this study, we include a review of some of the previous research on ranking questions. We outline our data collection methods and include a description of the participants, our experimental design, and data limitations and challenges. Then, we report our results and offer recommendations.
Background on Ranking Questions
There is a handful of studies comparing different ranking question designs. Blasius (2012) compared four designs, including numeric entry and drag-and-drop, and concluded that drag-and-drop options are preferred for internet surveys. Although we found in this study that time-on-task and missing data were similar, Blasius (2012) argued the drag-and-drop design makes it easier to verify responses because respondents can visualize the final order. Numeric entry designs are typically static, so items appear to be visually out-of-order even after rankings are assigned to them. Karth (2011) came to a similar conclusion by finding that respondents self-reported that they preferred the drag-and-drop option over numeric entry; although, Karth (2011) also found the drag-and-drop design did not score better on usability scales, nor did it take less time to complete a ranking task. Karth (2011) also argued that respondents preferred the drag-and-drop design because it is easier to visually verify one’s responses.
Other researchers have suggested a “percent apportionment” type question to elicit respondent rankings (Duffy & Webber, 1974). In this type of question, respondents might estimate, for example, the percentage of time they spent on a list of tasks. For our purposes, this design was less desirable. In an early version of our survey, we attempted this approach by listing each of the items with a text box beside it for respondents to input the estimated percentage of time they spent on each task. During usability testing with four Census Bureau employees, participants struggled with this question. They self-reported difficulties in estimating the amount of time they might spend on each task, converting the times to percentages, and ensuring the percentages added to one hundred. To reduce cognitive burden and improve measurement, we suggested a ranking question. These kinds of questions still require more effort than other closed-ended questions (Alwin & Krosnick, 1985; Dillman et al., 2014; Smyth et al., 2018), but ranking should be more manageable than percent apportionment because additional calculations are not needed to verify one’s responses (Karth, 2011).
However, the ranking options available to us were different than what Blasius (2012) and Karth (2011) tested. In both cases, they tested a drag-and-drop option requiring respondents to move an item horizontally from one column to another and then vertically to place it in position (see Figure 1). Blasius (2012) also tested an “arrows” design, which allows respondents to move items using arrows alongside each item (see Figure 2). Both options are distinct from the option available to us, which allows respondents to move items vertically within the same column (see Figure 3 in Methods). Not knowing if this particular version of a drag-and-drop design would still be preferred to a numeric entry design (as these authors suggested), we decided to use both ranking designs and compare them.
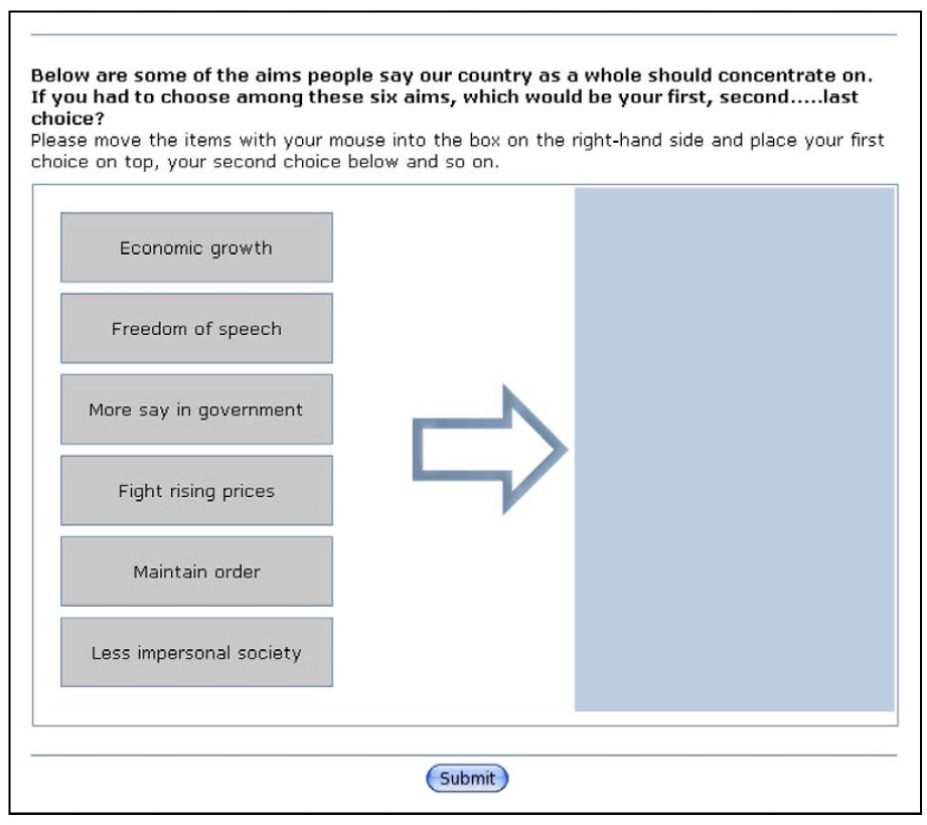
Figure 1. Drag-and-drop design using columns (Blasius, 2012).
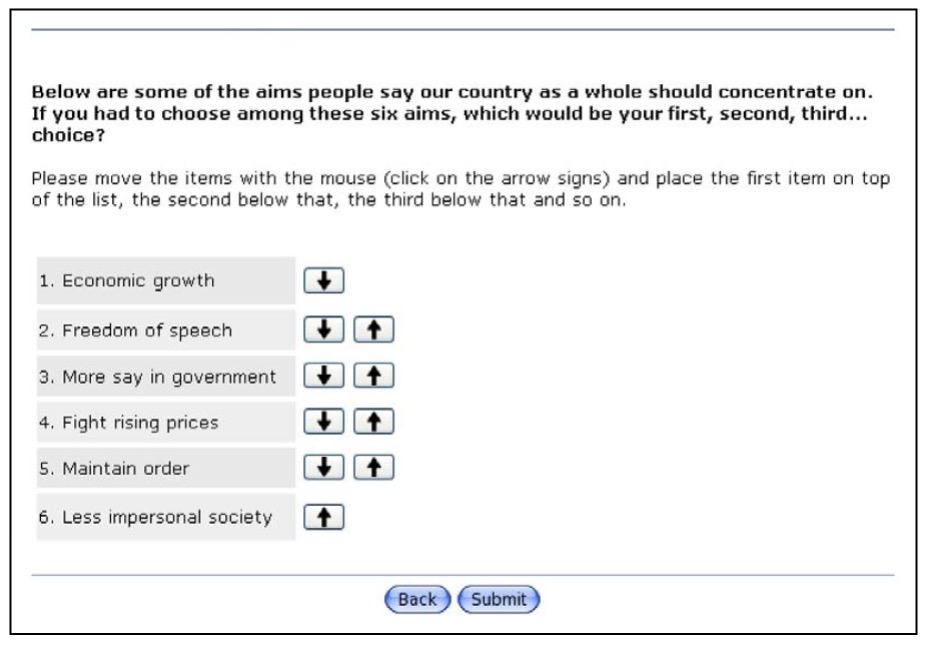
Figure 2. Drag-and-drop design using arrows (Blasius, 2012).
Methods
Survey
As part of the 2020 Census, the United States Census Bureau hired temporary workers to assist with its Partnership Program. The program was designed to recruit community members such as small business owners, leaders, and others to act as Census Bureau ambassadors and encourage fellow locals to complete the decennial census. Between April 23 and May 27, 2020, the Census Bureau fielded the Partnership Specialists and Partnership Coordinators Survey. Partnership Specialists are involved in the day-to-day outreach, engagement, and educational activities involved in securing Census Bureau partners. Partnership Coordinators work in a managerial position to supervise and coordinate Specialists’ activities. The survey measured employee perceptions of the job’s various roles and tasks, including Census Bureau trainings, the quality of the informational materials they were given to perform their job, their experiences working at the onset of the pandemic, and their opinions about work-related, online platforms such as the Customer Relationship Management (CRM) and the Response Outreach Area Mapper. The survey was developed in Qualtrics™ (www.qualtrics.com), a platform used to design and distribute web surveys. We contacted respondents through their work email addresses using Qualtrics’s email function and asked them to participate while on duty and using their Census Bureau-issued laptops. The survey was written in English and took about 40 minutes to complete. There were 1,293 respondents in the final, unweighted sample, with a response rate of 91%. We embedded the ranking question experiment within the survey. It appeared approximately halfway through the questionnaire.
Participants
The demographic characteristics of respondents are reported in Table 1. Respondents were very highly educated, with more than half having earned a post-graduate degree. Almost 90% of respondents had a bachelor’s or graduate degree. The majority of respondents were 45 years of age or older.
Table 1. Demographic Summary of United States Census Partnership Specialist and Coordinator Respondents
|
Age |
n |
% |
|
18-34 |
161 |
12.5 |
|
35-44 |
329 |
25.4 |
|
45-64 |
658 |
50.9 |
|
65+ |
125 |
9.7 |
|
Refused |
20 |
1.5 |
|
Total |
1293 |
100.0 |
|
Education |
|
|
|
Less than Bachelor’s |
130 |
10.1 |
|
College Graduate |
422 |
32.6 |
|
Post-Graduate |
726 |
56.1 |
|
Refused |
15 |
1.2 |
|
Total |
1293 |
100.0 |
Experimental Design
In our experiment, we used the drag-and-drop and numeric entry options available in Qualtrics. Figures 3 and 4 show how these versions of the question appeared to respondents. Both asked respondents to rank the amount of time they spent on six job related tasks. Respondents were randomly assigned to one or the other option; the tasks were also presented in a randomized order. When assigning participants to a task, we implemented the option to “evenly present elements” to adjust for the possibility that the groups could be unbalanced by chance. The numeric entry option uses a familiar design that allowed respondents to enter a number beside the item to indicate its ranking. The drag-and-drop option, however, was somewhat unusual. This option allowed respondents to drag and drop each item vertically into the respondent’s preferred position, whereas other drag-and-drop designs (see Figure 1) allowed items to be dragged horizontally from one column to another or by using arrows to move items vertically.
We did not implement response requirements or validation settings on either option. This meant respondents could skip the question altogether or, in the case of the numeric entry option, they could skip particular items. Respondents using the drag-and-drop option could not skip specific items; with this design, if any item is ranked, the placement of the rest of the items are recorded as well, even if the respondent intended to leave one or more items unranked. Foregoing response requirements also allowed respondents using the numeric entry option to enter numbers outside of the intended range or to enter duplicate rankings.
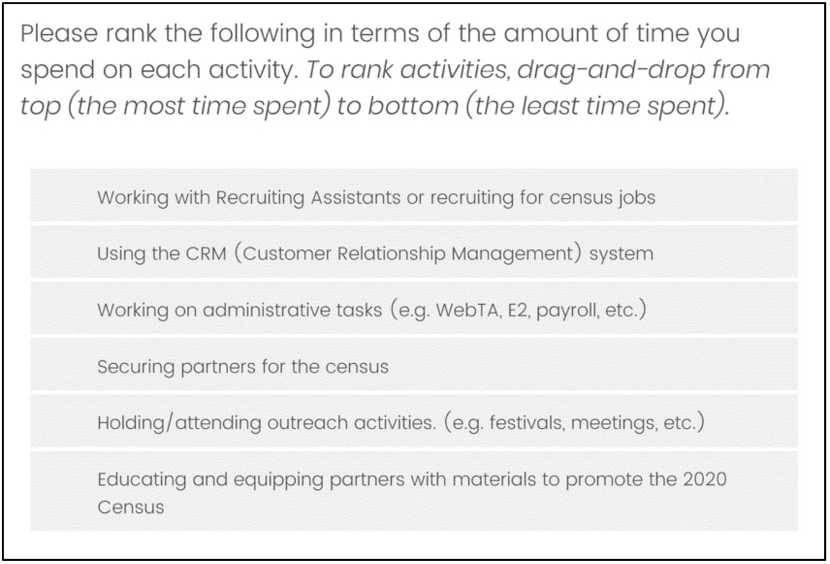
Figure 3. Survey question with drag-and-drop design (United States Census Bureau, 2020).
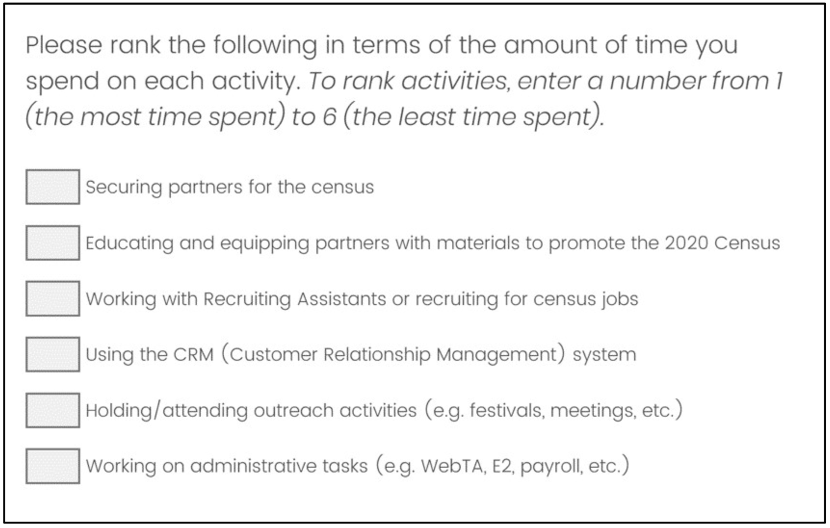
Figure 4. Survey question with numeric entry design (United States Census Bureau, 2020).
Data
As respondents completed the ranking question, Qualtrics recorded and stored the rankings for each of the six items, resulting in six columns in the dataset. Qualtrics provides many options to download data; we used a comma-separated (.csv) file with the option to split multi-value fields into columns.
Each column tallied how often the item was ranked in each position. For example, Table 2 shows ranking results for all six items. The second column shows that 30 respondents ranked “working with Recruiting Assistants or recruiting for census jobs” as the most time consuming, whereas 45 ranked it as the second most time consuming. Comparing items across the top row, it is clear that “securing partners” was commonly ranked as the most time-consuming task, time spent on the CRM system was ranked next, and so on. The numeric entry option allowed for out-of-range responses (discussed in greater detail in our results), which accounts for various responses greater than 6.
Table 2. Raw Coding of Answers to the Question: “Please rank the following in terms of how much time you spend on each activity…”
|
Response Value |
Wrk w/ Asst (n) |
Admin (n) |
Securing Partners (n) |
Education (n) |
CRM (n) |
Outreach (n) |
|
1 |
30 |
121 |
571 |
175 |
352 |
126 |
|
2 |
45 |
154 |
277 |
310 |
241 |
237 |
|
3 |
100 |
122 |
196 |
288 |
212 |
334 |
|
4 |
157 |
171 |
109 |
272 |
244 |
279 |
|
5 |
299 |
338 |
75 |
155 |
145 |
209 |
|
6 |
629 |
359 |
37 |
67 |
69 |
77 |
|
8 |
– |
– |
– |
– |
1 |
– |
|
10 |
1 |
3 |
– |
1 |
1 |
1 |
|
20 |
– |
– |
3 |
1 |
1 |
2 |
|
30 |
– |
– |
– |
– |
1 |
– |
|
40 |
– |
– |
– |
– |
1 |
– |
|
50 |
– |
– |
1 |
– |
– |
– |
|
60 |
1 |
– |
– |
– |
– |
– |
|
Missing |
31 |
25 |
24 |
24 |
25 |
28 |
Note on abbreviations: Wrk w/ Asst is ‘Working with Recruiting Assistants or recruiting for census jobs’; Admin is ‘Working on administrative tasks’; Securing Partners is ‘Securing partners for the census’; Educ is ‘Educating and equipping partners with materials to promote the 2020 Census’; CRM is ‘Using the CRM’; Outreach is ‘Holding/attending outreach activities’
There are various ways to summarize the data. One possibility is to examine the frequency that each task was reported as the most (or least) time consuming. Another is to calculate the mean rating for each task, as done by Alwin & Krosnick (1985). In this study, we employed both methods.
To calculate the frequency of tasks rated as most time consuming, we used the values across the top row of Table 2. To calculate these values, we coded each of the items from Table 2 as equal to 1 if it was ranked as the most time-consuming task, or 0 otherwise. Then, we tallied the frequencies as if it were a multiple response question by summing the column totals for each item (see Table 3). Notice that recruiting for census jobs was ranked as the most time consuming 30 times in both Tables 2 and 3, but the information in Table 3 presents only the frequency that each task was ranked as the most time consuming.
We followed this same coding procedure to code tasks ranked as the least time consuming, but coded items equal to 1 if it was ranked number six, or 0 otherwise. To calculate the means for each item, we took a simple average of the within-range responses.
Table 3: Frequency Ranking (Tasks Most Time Consuming)
|
|
Frequency |
% of Responses |
% of (1293) Cases |
|
Securing Partners |
571 |
41.53 |
44.16 |
|
Using the CRM |
352 |
25.60 |
27.22 |
|
Educating Partners |
175 |
12.73 |
13.53 |
|
Outreach Activities |
126 |
9.16 |
9.74 |
|
Administrative Tasks |
121 |
8.80 |
9.36 |
|
Working with Recruiting Assistants |
30 |
2.18 |
2.32 |
|
Total |
1375 |
100.00 |
106.34 |
Note: The frequency total is greater than the sample total because respondents in the numeric entry condition were able to assign equivalency to job tasks. In this particular situation, some respondents ranked more than one job element as “1” for the most time consuming.
Time-on-task was measured using a “page timer” question that recorded the amount of time the respondent spent on the screen, from the time the page loaded to the time they clicked the “Next” button. The question appeared on its own screen, so the timer only recorded the amount of time spent on that question.
Challenges to Data Analysis
Before reviewing our results, we first discuss challenges analysts may encounter when using data from either design and how the data were handled in our analysis. These challenges arose, in part, because we did not require respondents to answer the question, and we did not set any validation requirements. The designs themselves are also different, as described above, with consequences for how data are recorded in each design. We noted two challenges in particular: 1) distinguishing non-response from response for the drag-and-drop option; and 2) interpreting equivalent rankings and/or rankings outside of the 1 to 6 range for the numeric entry option.
Distinguishing Non-Response from Response for the Drag-and-Drop Option
In the drag-and-drop design condition, there was no possibility for individual item missingness; either all of the items had values, or all of the items were missing. On a few occasions, respondents had missing data for this question, so we initially assumed they had skipped the question. When examining the data further, we noticed other instances. Some respondents appeared not to have moved any of the items, but their responses were recorded nonetheless. For these respondents, their final rankings were the same as the original order of the rankings. The distribution of these cases is reported in Table 4.
We found this situation puzzling because the same behavior (i.e., not moving any items) seemed to lead to missing values in some cases but not in others. We informally tested the drag-and-drop option to gain a better understanding of the behavior that might trigger Qualtrics to record respondents’ rankings if the final order was the same as the initial order. We attempted clicking in the answer field, partially moving an item, and fully moving an item into a different position before moving it back. It appeared that if a user does not click anywhere on the screen, or clicks in the answer field without moving an item, the answers are coded as missing. But if they partially move an item, or fully move the item before moving it back, the order was recorded. To summarize, it is difficult to separate true non-response for the drag-and-drop option because 1) individual item missingness is not possible, by design, and 2) if a respondent intended to keep the initial order of the rankings, their rankings may or may not have been recorded depending on whether they attempted to move or partially move an item.
When coding the variable used to show the response distribution (Table 4), we counted respondents who changed or moved an item from the initial order as “Changed order” (even if they only changed one item). We counted respondent who had a final ranking that corresponded with the original display order as “Didn’t change order (recorded).” We then counted respondents who had missing values for all of the items as “Didn’t change order (missing),” because by not moving or entering anything, they did not change the items from initial order.
Notably, some respondents were counted as “Didn’t change order (missing)” for the numeric entry option. However, for the numeric entry option, we have more confidence that the missing values are a result of the respondent not engaging with the question (for whatever reason), because they did not attempt to enter any numbers. As a result, it is more likely that these are “true” missing values.
Table 4: Respondents’ Order of Items Relative to the Original Order
|
|
Drag-and-drop |
Numeric Entry |
Total |
|
Changed order |
612 |
637 |
1249 |
|
Didn’t change order (recorded) |
17 |
6 |
23 |
|
Didn’t change order (missing) |
17 |
4 |
21 |
|
Total |
646 |
647 |
1293 |
Rummel (2020) described one approach to separate “skippers” from “keepers” by using a probability plot to identify respondents who answered the question unusually fast. Following this approach, we identified 18 respondents who used the drag-and-drop option who might be classified as skippers. If these respondents were comprised only (or even mostly) of respondents who didn’t change the initial order and had responses considered missing, this approach might help us distinguish true missingness. However, that was not the case with our data. The 18 respondents were a mix of those who changed an item position (n = 5), those who didn’t change the order but whose data were recorded anyway (n = 3), and those who didn’t change the order and had responses considered missing (n = 10). Notably, many of these “skippers” had responses considered missing, but 8 did not (5 changed the order of the items, and 3 kept the initial order but had recorded data). Additionally, there were 7 other respondents who used the drag-and-drop option but had missing response data that were not, by definition, “skippers.”
Although this approach might be useful for identifying “speeders,” it did not clarify in this study why keeping the initial order leads to missing data in some cases but not others.
Interpreting Equivalent Rankings or Rankings Outside of the 1–6 Range for the Numeric Entry Option
In the numeric entry design condition, we asked respondents to “enter a number from 1 (the most time consuming) to 6 (the least time consuming).” In analyzing the data, we noticed that several respondents who used the numeric entry option gave answers outside of the range, ranked multiple items the same, or apparently skipped some or all of the items. To better understand how often this happened, we created an indicator variable to determine whether or not respondents: 1) skipped any items, 2) gave each item a unique value, and 3) used values from 1-6. Table 5 shows the comparison of this variable.
For the numeric entry option, 16% respondents (105 of 647) either entered a number outside of 1-6, left one or more items blank, or indicated that one or more items were equivalent in the ranking. Of course, fewer respondents (only 17) did so for the drag-and-drop option because the design did not allow for those deviations. The 17 cases in Table 5 are respondents who appear to have skipped the question, although per our discussion, it is not possible to verify that.
Table 5: Respondents Who Skipped an Item, Gave the Same Rank to Multiple Items, or Used Out-of-Range Numbers
|
|
Drag-and-drop |
Numeric Entry |
Total |
|
Yes |
17 |
105 |
122 |
|
No |
629 |
542 |
1171 |
|
Total |
646 |
647 |
1293 |
Addressing Challenges in Analysis
Given the challenges of distinguishing non-responses and out-of-range answers, we handled “missing” and out-of-range answers differently in the analyses of response distributions and time-on-task. We compared ranking distributions through: 1) examining the frequency distributions of tasks ranked as the most time consuming, 2) examining the frequency distributions of tasks ranked as the least time consuming, and 3) comparing the mean ranking for each task.
For the first set of comparisons, we coded each of the items (see Table 2) as equal to 1 if it was ranked as the most time-consuming task, or 0 otherwise. As a result, anything that was not coded a “1” in the raw data was not included in the frequency distribution. The same is true for the second set of comparisons, except we coded an item as equal to 1 if it was ranked as the least time-consuming task, or 0 otherwise. In other words, answers that were not coded a “6” in the raw data were excluded. In the third set of comparisons, we excluded missing values and items that were ranked out of range before calculating the mean rankings for each item.
In our analysis of time-on-task, we were able to use the full sample because every case had a recorded time regardless of how they answered, but we excluded outliers (discussed in greater detail in our results). In the model reported in our results, we include the variable that indicates if a respondent changed the order of items (see Table 4), but we collapsed the two “did not change” categories because it was not possible to distinguish non-response from response.
Results
Distribution of Responses
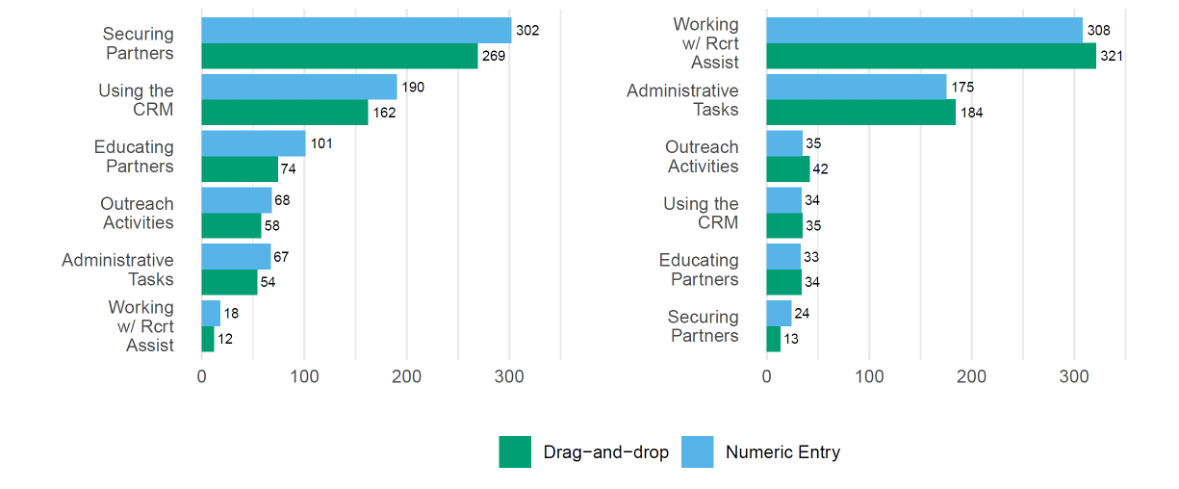
We compared the distribution of rankings by examining the frequency of respondents who said a task was the most, or least, time consuming. Figure 5 shows these distributions by design. The relative ordering of tasks ranked the most time consuming (the chart on the left), and the least time-consuming job tasks (on the right), do not vary by design condition. That is, “Securing Partners” was most frequently ranked as the most time consuming and “Working with Recruiting Assistants” was the least frequently ranked as such, regardless of whether the drag-and-drop or numeric entry option was used to rank the items. The results of a chi-squared test (?2 = 1.75, ? = .88) support this conclusion. Similar to this result, working with Recruiting Assistants was most frequently ranked as the least time consuming and securing partners was the least frequently ranked as such. Again, the results of a chi-squared test indicate these distributions are not dependent on the designs (?2 = 4.11, ? = .53).
|
Most time-consuming tasks |
Least time-consuming tasks |
 |
|
Figure 5. Frequency of respondents ranking tasks as the most time consuming (left) and least time consuming (right). Source: 2020 Partnership Specialists and Partnership Coordinators Survey
More respondents rated each item as taking the most time in the numeric entry than in the drag-and-drop (on the left). And, except for “Securing Partners,” there were more respondents who ranked items as taking the least amount of time in the drag-and-drop condition compared to the numeric entry. This is because respondents using numeric entry were able to assign the same ranking to multiple items, but if they ranked all of the items as the most time consuming (e.g., by entering a “1” for each item), they were not able to rank anything as the least time consuming (or anywhere in between) because items could only be ranked once.
We also calculated the average ranking for each task and compared the difference of the means between the designs using an independent two-sample t test. Table 6 shows these comparisons, ordered by tasks ranked as the most time consuming (top) to the least time consuming (bottom). Among these comparisons, there is only one statistically significant difference at the .05 level for administrative tasks. The difference is small, however, and in any case would not result in a different ordering of tasks based on question design. From a data-collection perspective, it is reassuring to have evidence that the relative ordering of items would have been the same whether we had chosen to use one or the other design.
Table 6: Mean Rankings, by Design (1 = Most Time Consuming; 6 = Least Time Consuming)
|
Task |
Drag-and-drop |
Numeric Entry |
Difference |
t |
p |
|
Securing Partners |
2.20 |
2.15 |
0.04 |
0.54 |
0.59 |
|
Using the CRM |
2.88 |
2.80 |
0.08 |
0.90 |
0.37 |
|
Educating Partners |
3.16 |
3.05 |
0.11 |
1.42 |
0.16 |
|
Outreach Activities |
3.36 |
3.33 |
0.04 |
0.47 |
0.64 |
|
Administrative Tasks |
4.31 |
4.12 |
0.19 |
2.07 |
0.04 |
|
Working with Recruiting Assistants |
5.09 |
4.95 |
0.13 |
1.85 |
0.06 |
Time-on-Task
Table 7 shows mean time-on-task for both conditions. During preliminary analyses, we noticed that the standard deviation exceeded the mean, so we removed extreme outliers (three times the standard deviation). When including outliers, the average time-on-task for the numeric entry design condition was 102.67 seconds (SD = 122.92, n = 647). In the drag-and-drop design condition, respondents took an average of 90.57 seconds (SD = 116.64). Table 7 shows the means and standard deviations by condition after removing those outliers. The observed difference narrows to 3 seconds, with respondents using numeric entry taking longer.
Table 7: Average Time-on-Task (in Seconds) by Condition, After Removing Outliers
|
Condition |
Mean |
SD |
n |
|
Drag-and-drop |
83.1 |
52.9 |
640 |
|
Numeric entry |
86.2 |
51.5 |
629 |
|
Total |
84.6 |
52.2 |
1269 |
To test for statistical significance, we conducted an ordinary least squares regression analysis using a log transformation of the time variable (Table 8). The test shows that the observed difference is not statistically significant. Consistent with other research, age is a significant correlate of time-on-task with older respondents taking longer (Bergstrom et al., 2013; Nichols et al., 2020). The “changed order” variable is also significant, with those who did not make changes taking less time. This is not surprising because it presumably takes less time to answer if the response items are already in order or the respondent skips the question altogether. This analysis did not include statistical outliers, but the results are unchanged whether including or excluding them.
Table 8: Time-on-Task by Ranking Design
|
|
Log of Time |
|
Numeric entry (Drag-and-drop) |
0.01 (0.01) |
|
Changed order (no) |
-0.39*** (0.04) |
|
35-44 (18-34) |
0.07** (0.02) |
|
45-64 (18-34) |
0.17*** (0.02) |
|
65+ (18-34) |
0.21*** (0.03) |
|
College degree (Less than Bachelor’s) |
-0.03 (0.02) |
|
Post graduate degree (Less than Bachelor’s) |
-0.02 (0.02) |
|
Constant |
1.77*** (0.03 |
|
R2 |
0.15 |
|
Adj. R2 |
0.15 |
|
Number Obs. |
1247 |
*** p < .001; ** p < .01; * p < .05. Note: Standard errors in parentheses.
We conducted additional analyses by including an interaction term for age by condition, and education by condition. There was no interaction of age by design, suggesting that age did not moderate time-on-task between conditions. However, we did find that the numeric entry option took slightly less time for participants with less than a four-year college degree compared to the drag-and-drop option. Our population was very highly educated though—the majority of respondents had at least some college experience, even if they didn’t have a degree. We think more research would be necessary to know if this finding would extend to a sample with a greater diversity of education. Since our sample is limited in this regard, we simply note the result but emphasize that pursuing it further is out-of-scope for our present purposes.
Conclusion
In this study, we compared two ranking question designs available on the Qualtrics survey platform—drag-and-drop and numeric entry. Using data gathered from a randomized experiment of 1,293 respondents for the 2020 Partnership Specialists and Partnership Coordinators Survey, we compared the distribution of rankings and time-on-task. In the present study, the distribution of rankings did not vary by the drag-and-drop and numeric entry designs. For researchers concerned that one or the other design may result in different rankings, this finding is reassuring. Time-on-task also did not vary by the design.
There are, however, notable differences in how responses were entered for the two designs and, as a result, we discuss differences in how the data are recorded. In particular, responses for all of the drag-and-drop items were recorded even if only one item was moved. Non-response is challenging to distinguish because sometimes a respondent only wants to move one item and is satisfied with that order. Non-response is challenging to distinguish because sometimes a respondent only wants to move one item and is satisfied with that order. Other times, however, a respondent may be unsure of how to rank the remaining items and would have skipped them or ranked them as equivalent. This behavior is apparent when we examined the frequency of respondents in the numeric entry design condition; 16% of respondents skipped individual items, ranked them the same, or ranked them out of range. The only deviation allowed in the drag-and-drop design was to skip the question altogether. The constraint of the drag-and-drop design created a dataset that is perhaps cleaner and easier to manage, but its advantage should be weighed against the likelihood that some of the responses are forced, including those that might otherwise have been considered missing. Furthermore, it is unclear to the user what behavior triggers Qualtrics to record responses if the respondent wants to keep the initial order. For example, a user might not know that they have to move, or partially move, an item to trigger a response. From a data analyst’s perspective, these design features make it impossible to distinguish true item non-responses.
These challenges with the drag-and-drop design leads us to favor the numeric entry design when using Qualtrics. Alternately, we acknowledge the value to users being able to visualize and confirm their final response order. Both Blasius (2012) and Karth (2011) preferred the drag-and-drop option over a numeric entry option for this reason. Notably, however, the design they tested (Figure 1) accurately tracked item missingness and thus avoided the challenges we’ve described in the platform we tested. However, their version required two columns and was clearly optimized for larger screens. As the use of mobile phones to complete web surveys has increased (Tourangeau et al., 2018), it is unclear if this design will continue to be practical.
As a compromise, we would like to see a numeric entry design that reorders response items as rankings are entered to mimic the visual advantages of the drag-and-drop design. We also would be interested in researching if such a design would alleviate potential problems that could arise from a mismatch, for instance, of assigning low numbers to tasks that are the most time consuming and high numbers to the least time-consuming tasks. That is, we would like to see a design that clarifies ranking for people who might ignore or misunderstand the instructions or believe that 6 indicates greater time commitment, whereas we had intended respondents to interpret a ranking of 1 as “the ‘number one’ most time-consuming task.”
Recommendations
Currently, we recommend the numeric entry option when using Qualtrics. Using the settings we tested, respondents were able to skip items, rank them the same, or rank out of range. In some cases, this behavior is desirable. In our case, it was useful to see that respondents rated multiple tasks equally as the most time consuming. If similar information would be useful for the data user, we recommend using the numeric entry format without response requirements or validation. If not, the drag-and-drop option might be helpful because those deviations are not allowed by design. This advantage, in our view, does not outweigh the challenges of distinguishing non-response. Furthermore, it is possible to implement these restrictions for the numeric entry option. Response validation settings can prompt users to use the numeric range and uniquely rank each item, and the setting also preserves the ability to distinguish non-response.
We want to emphasize that we did not implement these settings in our comparisons, and there may be unforeseen drawbacks to this approach. Although we suspect that such settings might restrict respondent behavior similarly to the drag-and-drop design—while more accurately tracking non-response—there is currently not enough evidence to support this. Further experimental research would be useful to help answer this question. We also don’t know how respondents might react to additional validation settings in one design versus the other. Given that it is more difficult to visualize the final response order using the numeric entry option, validation requirements might lead to greater frustration resulting from additional error messages. Further qualitative research would be useful on these questions as well.
Tips for Usability Practitioners
- For numeric entry ranking, expect respondents to rank multiple items the same, skip individual items, or use numbers outside of the intended range. Researchers may prefer this option depending on the project. If this is not the case, use the appropriate response requirement settings available in your survey programming software (i.e., force responses and/or add validation requirements).
- For drag-and-drop ranking, respondents might prefer the initial order on the screen and might choose to not move anything. Unmoved items can be recorded in unexpected ways. Generating a test dataset can be helpful to understand how these cases are recorded before the survey is fielded to a larger audience.
- It is often useful to know if a respondent skipped an item. Be aware that some designs might or might not allow respondents to skip items. We recommend testing to understand how the design in your survey software reports unranked items.
Acknowledgements
The authors would like to thank Joanne Pascale, Paul Beatty, Matthew Virgile, and Anna Sandoval Girón for providing feedback on this paper.
Disclaimer
This report is released to inform interested parties of research and to encourage discussion. The views expressed are those of the authors and not necessarily those of the United States Census Bureau. The disclosure review numbers for this paper are: CBDRB-FY21-CBSM002-025, CBDRB-FY22-CBSM001-002, and CBDRB-FY22-CBSM002-014.
References
Alwin, D. F., & Krosnick, J. A. (1985). The measurement of values in surveys: A comparison of ratings and rankings. Public Opinion Quarterly, 49(4), 535–552.
Bergstrom, J. C., Olmstead-Hawala, E. L., & Jans, M. E. (2013). Age-related differences in eye tracking and usability performance: Website usability for older adults. International Journal of Human-Computer Interaction, 29(8), 541–548.
Blasius, J. (2012). Comparing ranking techniques in web surveys. Field Methods 24(4), 382–98.
Dillman, D. A., Smyth, J., & Christian, L. M. (2014). Internet, phone, mail, and mixed-mode surveys: The tailored design method (4th ed.). Wiley.
Duffy, K. E., & Webber, R. E. (1974). On “relative” rating systems. Personnel Psychology, 27(2), 307–311.
Karth, S. T. (2011). A comparison of a traditional ranking-task and a drag-and-drop ranking task [Unpublished master’s thesis]. University of Dayton.
Krosnick, J. A., & Alwin, D. F. (1988). A test of the form-resistant correlation hypothesis: Ratings, rankings, and the measurement of values. Public Opinion Quarterly 52(4), 526–538.
Nichols, E., Olmstead-Hawala, E. L., Raim, A., & Wang, L. (2020). Attitudinal and behavioral differences between older and younger adults using mobile devices. In Q. Gao & J. Zhou. (Eds.), Human aspects of IT for the aged population: Technologies, design and user experience (Vol. 12207, pp. 325–337). Springer.
Rummel, B. (2020). About time: A practitioner’s guide to task completion time analysis. Journal of Usability Studies, 15(3), 124–134.
Smyth, J. D., Olson, K., & Burke, A. (2018). Comparing survey ranking question formats in mail surveys. International Journal of Market Research, 60(5), 502–516.
Tourangeau, R., Sun, H., Yan, T., Maitland, A., Rivero, G., & Williams, D. (2018). Web surveys by smartphones and tablets: Effects on data quality. Social Science Computer Review, 36(5), 542–556.
[:]