
[:en]
Abstract
Digital technologies have changed human behavior, especially the characteristics of products and their functionalities related to interface and interaction. Smartphone users had to accept touchscreen interfaces without sufficient evidence of the effectiveness of these digital interfaces over physical analog interfaces. Moreover, smartphone gaming industries have introduced mobile games with touch-based interfaces that may or may not be effective for game users. This study aims to find empirical evidence for the effectiveness between analog and digital interfaces for smartphone game controls through two usability tests: (a) a pilot study to compare the data values between direct and indirect input control with six participants and (b) a main study to investigate the effects of tap-only afford between digital and analog input control from the results of the pilot study. Both qualitative and quantitative research methods were used to analyze the usability test. A total of 81 participants were enrolled in the main study and divided into two large groups to compare one-handed and two-handed input controls. Nine participants in each group played smartphone games that were based on different input control tasks. This study found that direct touchscreen interaction was more effective for two-handed input control tasks and indirect physical input control was more effective for one-handed input control tasks.
Keywords
Smartphone Game, Gaming Interface Usability, User Experience
Introduction
Touchscreens in mobile technology have a great effect on the digital revolution in human-centered design as the analog interface shifts to the modern graphical era. Negroponte (1995) used the term “Being Digital” as a key point for rethinking the relationship between analog and digital technologies. His predictions of the importance of touchscreen interfaces resonates in this smartphone era. Although his concerns about being digital are not opposed to analog, he suggested that digital technology should revolutionize the relationship between hardware and software in the user experience.
During the transition from analog to digital platforms, there was no critical question as to whether the change in the analog to digital interfaces would provide users with more efficient interactions and experiences. Smartphone touchscreen games were transformed from video and PC platforms without considering the smartphone user interface and interaction. Game consoles are limited to playing games in terms of emulating the smartphone touchscreen game provider. This restricted functionality makes it difficult for smartphone users to play various dynamic games. Also, some smartphone games are limited to playing games by only finger-touch input control actions. Recognizing the need for analog control for smartphone games that require multiple input controls, third-party manufacturers have introduced game controllers for smartphone gamers to improve the touchscreen game experience. We found no empirical research that discusses the different values between different game controllers provided by third-party manufacturers, so in this study, the intent was to find a comfort level in comparing finger touch and game controllers for the touchscreen through a pilot study and a main study. As digital evolution is an ongoing process of developing new technologies and mobile contents, especially for the Internet of Things (IoT), researchers and developers should consider the pros and cons of the digital and analog interface regardless of accessibility and mobility before making a design decision whether the analog interface may work better than the digital interface in accuracy and comfort (Feki, Kawsar, Boussard, & Trappeniers, 2013).
Research Objectives
The primary purpose of this study is to investigate, empirically, the usability difference between the digital touchscreen and the analog physical controller for smartphone games. The objectives of this study are as follows: (a) to observe users’ behavior on input control between analog and digital interface design; (b) to investigate users’ responses in terms of accuracy, speed, and effectiveness between analog and digital interfaces; and (c) to compare perceptual ability between the touchscreen and the physical game controller. This study hypothesizes that tap-only affords for smartphone games is considered more effective than analog input control during gameplay. Users’ familiarity with the interface affect the satisfaction and experience with smartphone games (Saffer, 2008). This study seeks to find answers about users’ satisfaction and experiences with smartphone games that use a touchscreen or physical controller, relationships between familiarity and effectiveness of a touchscreen interface on smartphone games, and empirical evidence comparing the digital interface to the analog interface on smartphones with various types of physical game controllers for smartphones.
Related Works
The mobile game industry has introduced a variety of content and gaming methods. In 2009, 21,178 games and entertainment apps were available on the App Store (Brice, 2009). According to the App Store’s current distribution of application categories in 2016, the top level of the entire category includes 540,540 games and 146,304 entertainment apps. The results show that the mobile and touch-based smartphone gaming industry had grown more than 32 times from 2009 to 2016. Despite some empirical studies comparing the efficiency of touchscreen-based controls and physical input controls, the smartphone gaming industry has focused on gesture controls using touchscreen input control systems. Empirical studies have argued that user-centered design can improve product efficiency for better communication and interaction between users and devices (Darejeh & Singh, 2013; Norman, 1988; Rosli, 2015; Sethumadhavan, 2016; Tsagarakis & Caldwell, 2013).
Touchscreen and Gestural Interaction
Some early studies introduced the concept of a direct manipulation interface to address the effectiveness of hand gesture control guides. Hutchins, Hollan, and Norman (1985) defined it as a “continuous representation of the object of interest, physical actions or labeled button presses instead of complex syntax, and rapid incremental reversible operations whose impact on the object of interest is immediately visible” (p. 251). Shneiderman’s principles (1982) described a direct manipulation interface as a joy to use by making it easy to follow, which is a user-friendly notion that deals with the positive feelings of the original human-computer interaction. However, direct manipulation as it is used in today’s technology show that the graphical interface is not efficient under small or remote conditions on a touchscreen (Kwon, Javed, & Elmqvist, 2011). Icons with high attributes, high density, or limited space are not effective, and direct manipulation does not provide effective interaction on intangible object properties.
For more than 500,000 games in the App Store, game genres can be categorized as one-handed or two-handed input control. Gameplay tasks are controlled by drag-and-press holding as well as tapping. Touch-based interactions are typically considered to respond to touch with fingers on the touch-sensitive display. Saffer (2008) argued that touchscreens were ambiguous for user interaction due to the difficulty of finger-touch input control with a small graphical interface on a touchscreen. Moreover, users encounter difficulties with multi-tasking input control when interacting with complex touchscreen patterns between one-finger and two finger-touch based input control.
Figure 1 shows how the touchscreen response varies depending on the number of fingers and finger gestures. While the user interacts with input control tasks on the touchscreen, the interface is manipulated directly by finger gestures.
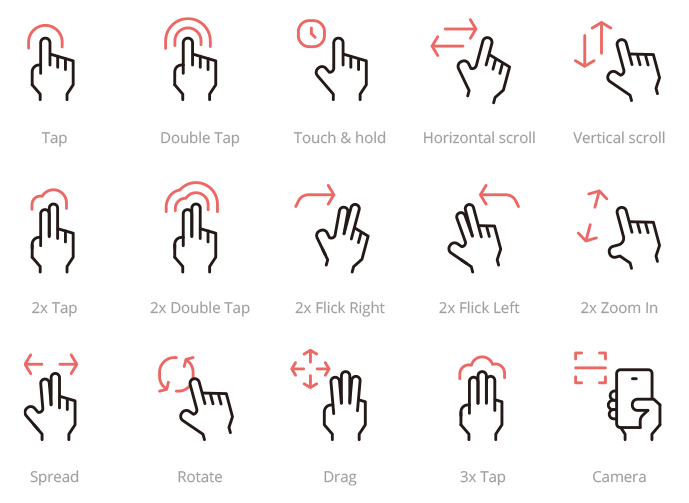
Figure 1. Touchscreen finger gestures. (Adapted from Vector Designed by Anuwat from https://pngtree.com/freepng/hand-gesture-icon-pack_3617864.html.)
A gesture-based interaction (GBI) on touchscreen devices consists of two interactions between a surface and a motion gesture. Wobbrock, Morris, and Wilson (2009) explained that users prefer a reliable perception of understanding the user interface to understanding gestures reflected by user behavior. Through empirical research, they demonstrated that the one-handed gesture interface is more effective and satisfying for touchscreen devices. Based on human-computer interaction (HCI), these findings naturally develop gesture interactions for user behavior.
Touchscreen tactile input controls are another important aspect of investigating the impact of touchscreen-based game design. Tactile interaction with tangible sensation in mobile touchscreen devices can be a potential solution to resolving game problems that lack the accuracy and effectiveness of the input control.
In a study by Hoggan, Brewster, and Johnston (2008), a lack of tactile feedback can cause mistakes and errors in touchscreen-based input controls. In finger-based text entry experiments with mobile devices comparing the physical keyboard, standard touchscreen, and tactile feedback, the results showed significant improvement in finger-based text entry when the task condition was added with tactile feedback to the touchscreen. Accuracy and efficiency were close to the effectiveness of a physical keyboard. Another study introduced improvements in the usability of mobile games with vibration technology. The adopted vibration significantly increased the value of effects by providing ease of use, usability, and cognitive concentration of gameplay regardless of the critical factors in the length of the vibration (Choe & Schumacher, 2014).
Touchscreen vs. Analog Input Control
Smartphone users expect touchscreen-based games to be based on intuitive input control interaction. Manufactured analog input controls are set to a fixed input control interface with size, button, and location. Analog input controls such as buttons, joysticks, and knobs are provided to game users to interact with the game. The limited space of a smartphone touchscreen requires different physical input control mechanisms. Baudisch and Chu (2009) investigated a pointing input task capability for very small devices. The interaction method featured a back-of-device approach to avoid interference between the finger and the touchscreen in which the device provided a separate pad, a touchscreen corresponding to the size of a finger, a larger touchscreen of usable size, and a back-of-device touch input control. The results found that pointing techniques on touchscreen devices can be problematic when interacting with contents on a small touchscreen. This finding raises questions about how mobile games can be more effective in touchscreen-based input control when the screen sizes are limited and smartphone games graphical information generate excessive traffic on the screen. Another consideration for touchscreen-based games is the performance of the input control system. Zaman, Natapov, and Teather (2010) evaluated level completion time and player deaths to measure the effectiveness of input controls in the same game between the iPhone and Nintendo DS Lite. Using the same game allowed a comparison between touchscreen-based virtual controls and physical controls. The results showed that the physical buttons on the Nintendo DS performed far better than the virtual buttons on the iPhone touchscreen even though participants performed better in game achievement after applying their familiarity with the game input control interface to the touchscreen. Oshita and Ishikawa (2012) obtained similar results in accuracy and responsiveness when comparing game consoles and touchscreen interfaces. The result has shown that the touchscreen interface has a better or similar effect than the gamepad interface, unlike Zaman et al.’s findings.
Control mechanisms for mobile games have examined immersive experiences such as tilting with mixed input control actions. Game developers need to consider immersive input controls from different perspectives, as mobile devices are suitable for screen-oriented input control. Cairns, Li, Wang, and Nordin (2014) measured the effect of immersive control in mobile games by comparing two different tasks: (a) steering in a mobile game and (b) comparing control mappings between tilting and touching. The results showed that using tilt input control had a higher level of immersion and a substantial effect. Motion interfaces that use device movements to control orientation were more efficient without the use of graphical user interfaces considering the interface size and location on the touchscreen. Another result found in this study was that the tilt control used in the racing game was significantly less immersive than the tilt gesture in directing control.
Methods
The purpose of this study was to investigate the effectiveness, efficiency, and accuracy level of a smartphone’s digital interface where all of the smartphone games were controlled with a finger touch and hand gesture interface. The usability test was divided into two stages: a pilot study and a main study. The pilot study was conducted with two small groups to compare the user comfort level in smartphone gameplay using either finger-touch control or a game controller. Based on the findings from the pilot study, the main study was developed with larger user groups.
Pilot Study
The purpose of the pilot study was to compare the user comfort level in smartphone gameplay using either finger-touch control or a game controller. The usability test compared the user interface between the digital (touchscreen) and the analog controller for smartphone games to assess the participants’ satisfaction level, error rate, and accuracy.
Conditions and Materials
The pilot study consisted of three different types of games. These games were smartphone game environment-friendly in terms of being touchscreen-based driven. The games included the following: Game A was PAC-MAN, which is a casual game with movement control only; Game B was Meganoid, which is an arcade game with movement and jumping controls; Game C was AirAttack, which is an action game with movement and shooting controls. Evaluation of input usability, actions, and control movements was accomplished by comparing the usage of the touchscreen and the game controller. The usability test consisted of two groups (three participants per each group) as a small-scale experiment. Each group played the three mobile games with both finger touch and an external game controller on the smartphone. The Group A participants performed a task with finger-touch control on the graphical interface of the smartphone touchscreen, and then the participants performed another task with a game controller. The Group B participants proceeded in reverse order from Group A. The participants’ behaviors were observed when controlling the input system with finger touch and a game controller. To collect errors or mistakes of control during the usability test, video and audio (without identifying the participant) was captured, field notes were taken, and computer activity data was collected (i.e., game control activity). The game controller MOGA mobile gaming system for Android 2.3+ was selected for testing because it set a top sales record on the Amazon market with over 1,000 consumer reviews.
Procedure of the Usability Test
With the approval of the Iowa State University and the University of Nevada Las Vegas Internal Review Board (IRB), the principal investigator (PI) implemented the usability test with six participants. Each participant spent approximately 60 minutes performing usability tasks and completing the exit interview. Prior to the usability test, participants had a pre-exercise for a few minutes to become familiar with game rules and conditions. The maximum value of the gameplay in the usability test was up to five minutes, and the achieved game level was collected at the end of the game. All test activities from each participant were recorded as voice and video during the test. The movements of the participant’s hands and fingers were recorded during the game. Participants were not identified in the video (i.e., the video did not include faces, but captured only hands and fingers). The participants performed a range of tasks in the smartphone games, and they were allowed to skip any task they did not wish to perform or that made them feel uncomfortable. Each participant completed the open-ended survey and exit interview at the end of the usability test.
Pilot Study Results
The usability test was conducted with a total of six participants for the pilot study. The demographics of participants consisted of two males and four females with an age range between 24–29. Also, they were daily smartphone users. Table 1 illustrates the data collected for each participant: the time length of gameplay and achieved game level. Game C, which simulates an air battle that attacks an enemy, does not provide a game level, so the data value is the variation in time length. Each data value was transformed into a graph to compare controller effectiveness for the groups, games, and game controls.
Table 1. Results of the Usability Test in the Pilot Study
|
Participant |
Game |
Finger Touch |
Game Controller |
|||
|
Time (mins) |
Game Level |
Time (mins) |
Game Level |
|||
|
Group A: using finger-touch control first |
P1. Female
|
A. Casual |
5:00 |
4 |
1:32 |
1 |
|
B. Arcade |
1:34 |
3 |
2:27 |
8 |
||
|
C. Action |
5:00 |
N/A |
5:00 |
N/A |
||
|
P2. Male
|
A. Casual |
4:35 |
3 |
1:45 |
2 |
|
|
B. Arcade |
1:51 |
6 |
3:13 |
9 |
||
|
C. Action |
5:00 |
N/A |
5:00 |
N/A |
||
|
P3. Female |
A. Casual |
4:27 |
3 |
3:35 |
3 |
|
|
B. Arcade |
1:33 |
3 |
2:48 |
8 |
||
|
C. Action |
3:40 |
N/A |
2:54 |
N/A |
||
|
Group B: using the game controller first |
P4. Female
|
A. Casual |
5:00 |
4 |
4:32 |
3 |
|
B. Arcade |
2:36 |
9 |
3:19 |
9 |
||
|
C. Action |
5:00 |
N/A |
5:00 |
N/A |
||
|
P5. Female
|
A. Casual |
5:00 |
2 |
2:43 |
1 |
|
|
B. Arcade |
2:02 |
4 |
2:53 |
6 |
||
|
C. Action |
5:00 |
N/A |
5:00 |
N/A |
||
|
P6. Male |
A. Casual |
4:19 |
3 |
2:18 |
2 |
|
|
B. Arcade |
2:48 |
4 |
2:26 |
8 |
||
|
C. Action |
5:00 |
N/A |
5:00 |
N/A |
||
Figure 2 compares the length of time between each participant and the type of game controller used. Data values were similar among the participants. We found that there was no significant difference between groups. All participants performed effectively in the Game A and Game C groups that used finger-touch input control first, but their performance was not effective in Game B based on the much shorter time length in gameplay. Even though most participants played Game B in less time than other games, their performance was more effective using the game controller than by the finger-touch control. This result supports that two input control actions (movement and jumping) are more effective using a game controller as opposed to a single input control action which appears to be easier with finger touch than a game controller.
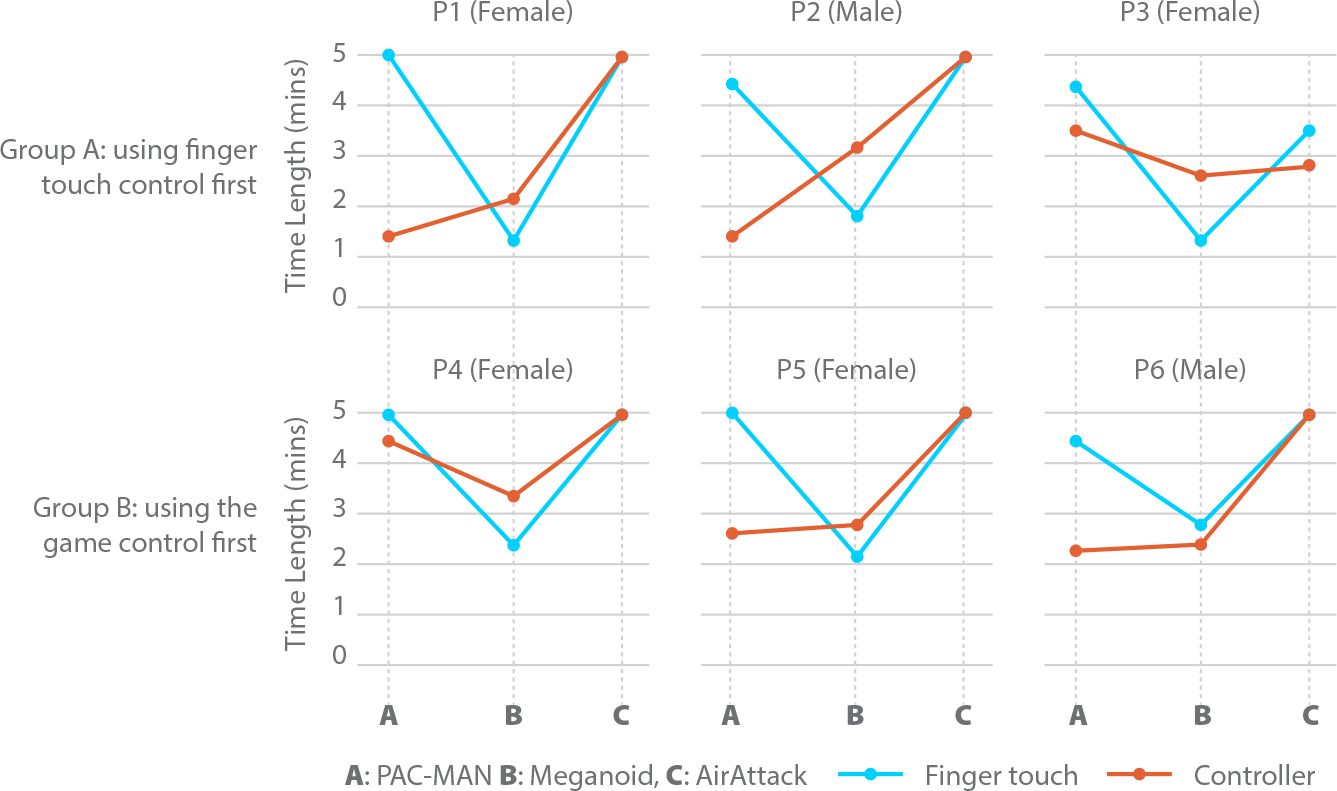
Figure 2. Analysis of the time length comparison.
Because Game B showed a significantly less effective time length in comparing the results of other games, we analyzed the value of achievement with the game level. Game B consists of 1 to 10 game levels, and it requires two input tasks control (movement and jumping) with both hands simultaneously during the gameplay. Although participants finished the game earlier than other games, all participants except P4 achieved game levels more effectively with the game controller (see Figure 3). Taking into account the familiarity with the game control and considering the challenges, the shorter time lengths as compared with other games did not reflect the effectiveness of the input control in participants’ performance. This finding also underpins Saffer’s theory (2008) in the literature review that users are confronted with a complex of perception when they encounter the graphical interface with two-finger-touch input control on the touchscreen. Therefore, the evaluation of the data value interprets the effectiveness of one-finger-touch input control as directed movement and orientation while a game controller is more effective with two-handed input control for different actions and conditions.
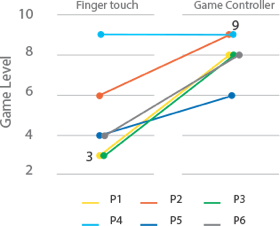
Figure 3. Analysis of the game level comparison for Game B.
In the open-ended survey, we investigated users’ level of satisfaction for finger-touch input and game controller input. The survey consisted of five questions related to effectiveness and comfort levels during the usability test. Participants answered each question in a range between 1 (most difficult) to 5 (most comfortable). The statistical mean value shows that more than 80% of participants were satisfied with the game interface on the touchscreen (see Figure 4). Most participants were satisfied with a game controller for input control tasks such as direct movement and control action, especially with Game B as multi-control actions were required. However, this result was in contrast to the data values of time length and game level. Although all of the participants gameplay was more effective with finger-touch input controls, they were more satisfied with a game controller. The reason may be a preference toward the game controller for visual clearance and holding a device.
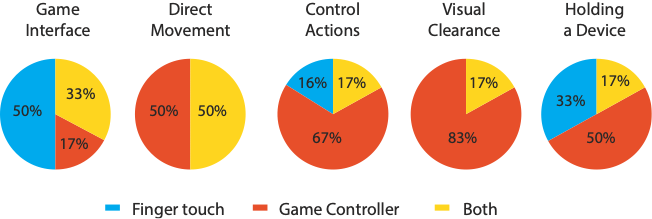
Figure 4. Analysis of open-ended survey: effectiveness and comfort level between finger touch and game controller.
Summary of Findings from the Usability Test for the Pilot Study
According to the results of the pilot study, participants were more comfortable with finger-touch controls on the touchscreen for Games A and C. For Game C, all participants completed the game in 5 minutes using both the finger touch or the game controller. Four participants answered that Game C was the most comfortable to play longer with finger touch on the touchscreen. The game controller was more effective in Game B, which required two different input control tasks. This finding proves that finger touch was more effective for one-handed single-finger control gestures that continue to stick/tap/swipe on the touchscreen. However, when the game required multi-task input control actions, the game controller was much easier to use when performing input control tasks (see Figure 5). Even though most participants’ responses were positive with finger-touch input control on the touchscreen, their preferences were not positive only for finger touch.

Figure 5. Snapshots of finger touch and hand gestures during the usability test.
Main Study of Touchscreen Usability
Using the results from the pilot study, the usability test was extended to a larger group focusing on the touchscreen with distinctive input control conditions. Because users were more satisfied with finger touch for a single input control directly onto the touchscreen and a game controller was more effective for multi-input controls, we hypothesized that smartphone users would more effectively perform multi-input control actions with a physical input controller. The main study was to investigate the satisfaction and comfort levels of smartphone users in action games where game players control shooting and movement. With a demonstration of finger gestures for one and two hands on a touchscreen interface by Saffer (2008) and Zaman et al. (2010), the usability test compared two different screen input control tasks between finger touch and a physical game controller when interacting with the game interface on the touchscreen.
Conditions of Research Method
Based on the related work in the literature called “Direct Manipulation Interfaces” (Hutchins et al., 1985), the usability test was comprised of nine different conditions for collecting data values to compare input control differences between finger touch and a physical controller attached to the touchscreen. In contrast with the nature of a one-handed input control for a smartphone touchscreen, there are many smartphone games requiring two-handed controls. Therefore, two different shooting games were chosen to compare comfort levels and effectiveness of user experience between one-handed and two-handed input controls. Two groups were divided into one-handed input control (Groups A–D) and two-handed input controls (Groups E–H). However, Groups E and E-1 were designed with different conditions in the same input control method to compare participants’ familiarity of performance. Participants in Group E-1 were given 15 minutes of pre-exercise to compare with Group E as to how the condition differs and influences the effectiveness and satisfaction with the game control. We selected Group E due to the nature of the finger gesture for touchscreen while other groups were given manipulated control rules and conditions. Group A, B, E, E-1, and F conducted gameplay with finger touch directly controlling the graphical interface on the touchscreen. The other four groups (Group C, D, G, and H) implemented gameplay with physical game controllers: a built-in stylus (Samsung Galaxy Note S-Pen) and a joypad controller (Smart TACT) for replacing the finger touch graphical interfaces on the touchscreen (see Figure 6). With the Smart TACT joypad control attached on the touchscreen, game users can control moving directions with 360-degree angles using their thumb on the static interface. Each group was evaluated by the statistical significance of different values for game achievement between finger touch and the game controller. For the evaluation of errors and mistakes in interface functionality, this study also observed user behavior such as finger and hand gestures, mumbling, and emotional expressions when interacting with the input control interface during gameplay.
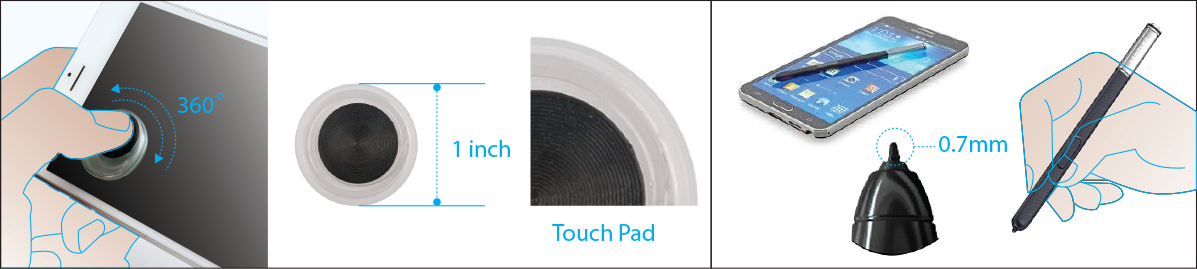
Figure 6. Analog input control: The Smart TACT joypad control is on the left and the Samsung S-Pen is on the right.
Game Information and Instruction
For investigating the effectiveness of gameplay input control between finger touch and a game controller, we chose two different casual shooting games for the usability test: iFighter 1945 and Tank Hero, both are available in App stores. Both games provide input control interfaces in two different conditions with touchscreen and touchpad mode. The game iFighter 1945 is an air battle simulation game where a player flies an aircraft with one hand. The game sets automatic targeting for shooting enemies, and it provides a button on the bottom-right side of the screen for shooting a bomb when the player needs to escape from heavy attacks. Game achievement is based on the participant’s scores and time length of gameplay. Tank Hero is another simulated battle game where the user controls movement and shooting with both hands. A player achieves the next game level by earning points from shooting targets and the level up is up to 40 steps. A player may also establish a game strategy for completing each level through different arrangements in the battle environment. The graphical interface on the input control of the touchpad mode is has two buttons: movement control on the bottom left and shooting on the bottom right. The game also provides input control without a graphical interface on the touchscreen. The player can control the action with a dragging finger gesture for movement and tapping onto the target for shooting.
Implementation of Usability Test
With a revised IRB for the main study approved to have human participants, we conducted the usability test to collect both quantitative and qualitative data. A total of 81 participants consisting of 44 females and 37 males were used. Also, more than 50 participants were in the age group of 18–23 years old. A total of 78 participants used a computer daily, but only 28 of the participants played a smartphone game daily. Eight participants did not have experience with smartphone games at all, but they had experienced either console video games or PC games. As a consideration for the quality-in-use of interactive computer usages (Bevan, 1995), the usability test consisted of measuring effectiveness, efficiency, and satisfaction of the game control during the smartphone gameplay. A total of nine groups were used to test the different conditions. Participants were randomly grouped by the confirmation of the meeting schedule for the usability test regardless of user preference or familiarity. Nine participants per each group implemented given tasks, and each group played games with different input control conditions (see Figure 7). Except for Group E-1, each participant spent approximately 30 minutes. Group E-1 required a pre-exercise for 15 minutes before the actual task.
- Groups A–D played iFighter1945 with a one-handed input control.
- Groups E–H played Tank Hero with a two-handed multi-input control.
- Groups A, E, and E-1 used finger touch without a graphical interface on the touchscreen.
- Groups B and F used finger touch on the graphical interface on the touchscreen.
- Groups C and G used a touch pen without a graphical interface on the touchscreen.
- Groups D and H used physical input controllers attached to the graphical interface of the touchscreen.
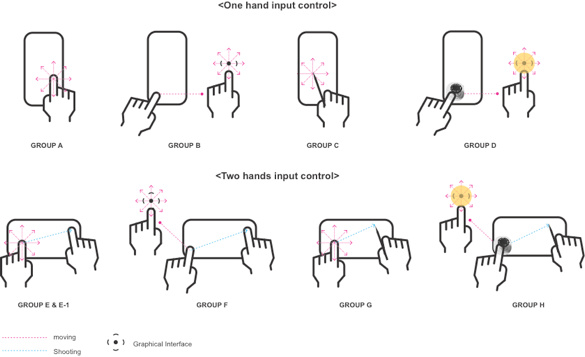
Figure 7. Conditions for the input control task: Group A (finger-touch input control), Group B (finger-touch input control at the graphical interface), Group C (touch-pen input control), Group D (joypad input control at the graphical interface), Groups E and E-1 (finger-touch input control with two hands), Group F (finger-touch input control at the graphical interface with left hand), Group G (finger-touch input control with left hand and touch-pen input control with right hand), Group H (joypad input control at the graphical interface with left hand and touch-pen input control with right hand).
In accordance with the evaluation method and user satisfaction theory demonstrated by Choe and Schumacher (2014), we adopted their contexts to find perceived usefulness, ease of use, enjoyment, and cognitive concentration through the survey questionnaires. In terms of different tasks and input control conditions on each game, the exit survey was divided into two separate questionnaires. For groups A–D, questions were related to the single-input control in movement. Survey questions in groups E–H were about the multi-input control in movement and shooting. Summarized written and spoken statements were collected to evaluate satisfaction and comfort levels during smartphone gameplay.
Methods of Evaluation and Analysis
Collected data was analyzed with users’ satisfaction based on three considerations: comfort level of the input control interface, the effectiveness of the dynamic interaction, and accuracy of the responsive interaction with given input control tasks. The evaluation method for the result of the usability test analyzed the collected game scores and time length (Darejeh & Singh, 2013; Natapov & Mackenzie, 2010; Ryu, 2010). Hornbæk (2006) also investigated 73 studies to determine evaluation methods in user experience (UX) and user interface (UI) that varied with subjects beyond quantitative values. Therefore, we considered an evaluation method with user behavior such as finger/hand gestures and reactions to game tasks for comparing independent variables with quantitative values. Among the 180 research papers reviewed by Hornbæk (2006), most studies adopted the ANOVA test to analyze the statistical significance of different values between independent variables of gameplay achievement level. Game scores collected from usability tests and each participant’s questionnaire responses were measured using the SPSS statistical program, which provides descriptive statistics through the t-test and the one-way ANOVA test.
Results
The data was collected as automatically generated game scores at the end of gameplay. The total score in Groups A–D was calculated by item scores (silver and gold tokens), kill scores, and bombs. Gold and silver tokens were acquired by any target damaged or killed. The score of the bomb is based on the number of uses. A full score of 15,000 points means that participants saved all three bombs during gameplay, and 5,000 points were subtracted for each use. The total score in Groups E–H was calculated by four measurements: game level, accuracy rating, health rating, and kill rating. Scores from the accuracy rating and health rating were valuable data to measure the gameplay achievement because participants could vary the game strategies. Time length in Groups A–D does not reflect the game achievement in terms of earning points from the item scores, but for Groups E–H, time length was used as a measure of level difficulty. In the evaluation of the usability test, descriptive data values were measured for each group to find the mean and median values. Statistical significance of different values between each group were analyzed to determine which groups were more satisfactory and effective in using input controls at given conditions.
Groups A–D for One-Handed Single Input Control
Figure 8 describes the results of the mean value of the time length and game score in Groups A–D. A majority of participants in Groups A–D ended the gameplay around two minutes. In comparison with the mean value, participants in Groups C and D played the game longer, and they earned a higher score. Based on different input control conditions given to each group, touch-based input control via the stylus pen (Group C) and the joypad (Group D) on the touchscreen was easier for participants. The result determines that gameplay with the direct finger-touch on the touchscreen was not efficient for most users in Groups A and B. However, the result performed by the one-way ANOVA test appeared that there was no significant differences between groups for the total score, F(3, 32) = 1.92, p = .146, and no significant differences between groups for time, F(3, 32) = 1.51, p = .230. This finding supports the assumption that the total score and time length varies the degrees of gameplay achievement of participants within groups.
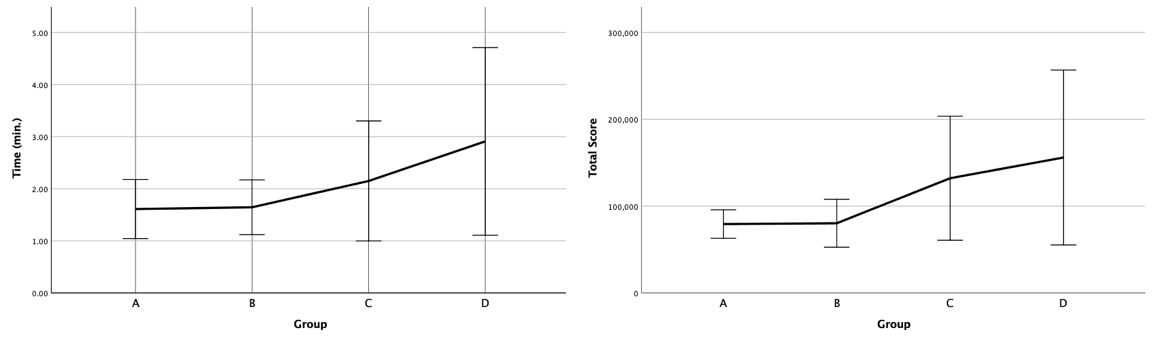
Figure 8. Mean value of time length and game score in Groups A–D.
At the end of the usability test, we conducted the exit survey with participants. Question 1 (Q1) and Question 2 (Q2) relates to finding satisfactory levels of input control in short (Q1) and long (Q2) distance/direction changes. Question 3 (Q3) is about direct control while users were interacting with a touchscreen, and Question 4 (Q4) directs effectiveness of one-handed input control while users were holding a smartphone device with the other hand during gameplay. The comfort level rating was evaluated between 1 (most difficult) and 5 (easiest). Figure 9 illustrates comparisons between groups. The results show that participants were more comfortable with one-handed control using an input controller (Groups C and D) directly on the touchscreen rather than direct finger touch control (Groups A and B) in the same gameplay environment.
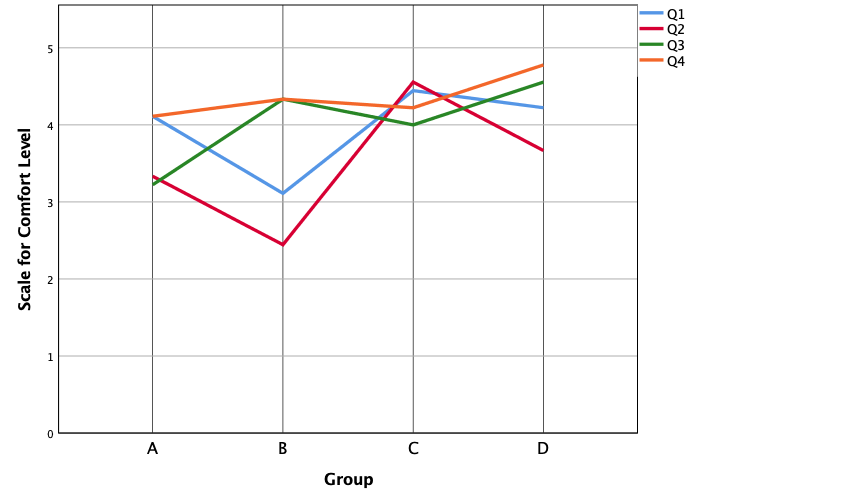
Figure 9. Results of mean values of survey responses for comfort levels in Groups A–D. The scale for comfort level was arranged on the Y axis of the graph: 1 (most difficult), 2 (difficult), 3 (average), 4 (easy), and 5 (easiest).
The one-way ANOVA test was performed to determine statistical differences between groups. We found that there was a significant difference for Q2, F(3, 32) = 6.76, p < .05 (Table 2). Scheffe’s test was conducted to confirm where the differences were statistically significant between groups. The results from multiple comparisons showed a significant difference between Group B and Group C (p < .05).
Table 2. Satisfactory Level Means and Mean Differences Between Groups
|
Dependent Variables |
Sum of squares |
df |
Mean square |
F |
Sig. |
|
|
Q1 |
Between Groups |
9.417 |
3 |
3.139 |
2.83 |
.054 |
|
Q2 |
Between Groups |
20.556 |
3 |
6.852 |
6.76 |
.001 |
|
Q3 |
Between Groups |
9.194 |
3 |
3.065 |
2.60 |
.070 |
|
Q4 |
Between Groups |
2.306 |
3 |
.769 |
1.03 |
.395 |
Groups E–H for Two-Handed Multi-Input Control
According to the collected data that was based on the total scores and the game achievement levels between groups, the analysis method for evaluating the usability test focused on the comparison between groups along with other earned points. This method was used to investigate the significant impact of user experiences on different input control conditions. The one-way ANOVA test was conducted to compare descriptive statistics of the probability value between groups in terms of independent variables. Table 3 shows descriptive statistic values of the total score in Groups E–H. The measured time length of gameplay was excluded for the comparison in terms of the nature of the game rules without time limits for each game level during gameplay. The total score was accumulated with accuracy, health, kill rates, and game levels during gameplay. Although the values appear similar between groups, except for Group E-1, Group H was the most ineffective in terms of the achieved level, the total score, and the accuracy rating.
However, a higher-ranking ratio cannot be defined as a satisfactory level for the validity of usability because the measurement criteria of the data values are different for dependent variables. Instead, the mean value was the average measuring tool for comparing independent variables. The result from the one-way ANOVA test (total score by groups) appeared to exhibit that there was a significant difference between groups, F(4, 40) = 13.56, p < .001. We then conducted the Scheffe’s test to find where the differences occurred between groups. The results showed there were significant differences between Group E and Group E-1 (p < .001) and between Group E-1 and Groups F, G, and H (p < .001).
Table 3. Descriptive Statistics of Total Score in Groups E–H
|
Group |
Mean |
Std. deviation |
Std. error |
95% confidence interval for mean |
|
|
Lower |
Upper |
||||
|
Group E |
7346.44 |
6674.66 |
2224.89 |
2215.84 |
12477.04 |
|
Group E-1 |
25547.56 |
13825.79 |
4608.60 |
14920.11 |
36175.00 |
|
Group F |
6184.44 |
2665.97 |
888.66 |
4135.20 |
8233.69 |
|
Group G |
6228.67 |
4573.58 |
1524.53 |
2713.11 |
9744.23 |
|
Group H |
3517.67 |
1130.00 |
376.67 |
2649.07 |
4386.26 |
Given the same condition of the gameplay with Group E, participants in Group E-1 significantly achieved better gameplay performance than other groups in terms of accumulated total score and level (Table 4). Mean difference of game level between Group E-1 and the rest of the groups appeared with a significant difference, F(4, 40) = 22.97, p < .001. Moreover, higher mean values of the total score identify a major improvement of their game skills through the 15 minutes of pre-exercise. This finding provides evidence for a theory of “familiarity of perception” by Zaman et al. (2010) that studies support for effectively performing and recognizing the complex functions of finger-touch input controls once they are familiar with a graphical interface and game rules on the touchscreen.
Table 4. Multiple Comparisons of Total Score and Level by Scheffe’s Test
|
Dependent variables |
(I) Group |
(J) Group |
Mean difference (I-J) |
Std. error |
Sig. |
95% confidence interval for mean |
|
|
Lower |
Upper |
||||||
|
Total score |
E-1 |
E |
18201.11 |
3431.912 |
.000 |
7120.82 |
29281.41 |
|
F |
19363.11 |
3431.912 |
.000 |
8282.82 |
30443.41 |
||
|
G |
19318.89 |
3431.912 |
.000 |
8238.59 |
30399.18 |
||
|
H |
22029.89 |
3431.912 |
.000 |
10949.59 |
33110.18 |
||
|
Level |
E-1 |
E |
8.778 |
1.265 |
.000 |
4.69 |
12.86 |
|
F |
9.111 |
1.265 |
.000 |
5.03 |
13.20 |
||
|
G |
9.444 |
1.265 |
.000 |
5.36 |
13.53 |
||
|
H |
10.556 |
1.265 |
.000 |
6.47 |
14.64 |
||
Table 5 illustrates the evaluation of accuracy rating mean values with Group F appearing differently between male and female participants. Mean value of the male participants in Group F was higher than the entire mean value (1224 > 914.44) even though the mean value within Group F was lower than the entire group mean value (742.67 < 914.44). This rate was also second-ranked in the accuracy rate among the males. This result indicates male participants were comfortable with control fingers for both shooting and movement while female participants were similar to the outcomes from other groups. We discuss the gender comparisons later in this paper.
Table 5. Accuracy Rating in Group F
|
Group |
N |
Mean |
Std. deviation |
Std. error |
95% confidence interval for mean |
Min. |
Max. |
|
|
Lower |
Upper |
|||||||
|
Total (Groups E-H) |
45 |
914.44 |
666.29 |
99.32 |
714.27 |
1114.62 |
135 |
3065 |
|
Group F |
9 |
742.67 |
474.98 |
158.33 |
377.56 |
1107.77 |
166 |
1611 |
|
Male in Group F |
2 |
1224.00 |
547.30 |
387.00 |
-3693.08 |
6141.30 |
837 |
1611 |
|
Female in Group F |
7 |
605.14 |
389.36 |
147.16 |
245.05 |
965.24 |
166 |
1296 |
Analysis of Responses from the Survey Questionnaires
With the completion of the usability test, each participant responded to the survey questionnaires. A total of six questions were related to users’ experience in the given input control tasks. Regardless of the game level or score achieved, participants rated their comfort level between 1 (most difficult) and 5 (easiest).
- Q1: Overall, how easy was it to change directions?
- Q2: Overall, how easy was it to change movements?
- Q3: Overall, how easy was it to see contents on the screen while you are controlling interfaces?
- Q4: Overall, how easy was it to aim for the target in shooting?
- Overall, how easy was it to control both movements and shooting at the same time?
- Overall, how comfortable was it to hold a smartphone during gameplay?
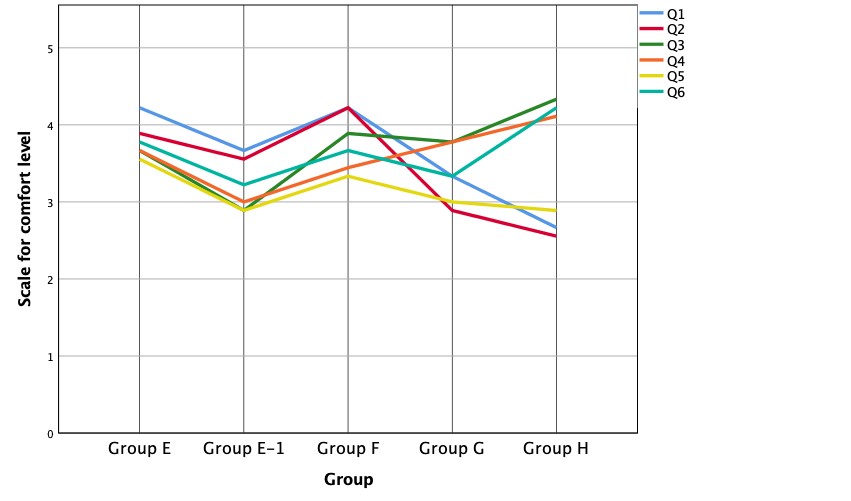
Figure 10. Results of mean values of survey responses for comfort levels in Groups E–H. The scale for comfort level was arranged on the Y axis of the graph: 1 (most difficult), 2 (difficult), 3 (average), 4 (easy), 5 (easiest).
Figure 10 illustrates comfort level from the responses of the six (6) survey questionnaires. According to the comparison with the mean values of each question between group means (Table 6), Groups E and F appeared to have a mean value higher (3.80) than the average mean value (3.52). Group H was split by different responses of the comfort level through all questions: lower than 3 (average) in Questions 1, 2, and 5, and higher than 4 (easy) in Questions 3, 4, and 6.
Table 6. Comparisons of Group Mean Value in Survey Questions
|
Group |
N |
Q1 |
Q2 |
Q3 |
Q4 |
Q5 |
Q6 |
Sum |
Total |
|
Group E |
9 |
4.22 |
3.89 |
3.67 |
3.67 |
3.56 |
3.78 |
22.79 |
3.80 |
|
Group E-1 |
9 |
3.67 |
3.56 |
2.89 |
3.00 |
2.89 |
3.22 |
19.23 |
3.21 |
|
Group F |
9 |
4.22 |
4.22 |
3.89 |
3.44 |
3.33 |
3.67 |
22.77 |
3.80 |
|
Group G |
9 |
3.33 |
2.89 |
3.78 |
3.78 |
3.00 |
3.33 |
20.11 |
3.35 |
|
Group H |
9 |
2.67 |
2.56 |
4.33 |
4.11 |
2.89 |
4.22 |
20.78 |
3.46 |
|
Total |
45 |
3.62 |
3.42 |
3.71 |
3.60 |
3.13 |
3.64 |
21.14 |
3.52 |
The one-way ANOVA test was applied to find significant effects between groups. We found that there were significant differences between groups: Q1, F(4, 40) = 3.28, p = < .05 and Q2, F(4, 40) = 4.32, p < .05. This result requires the Scheffe’s tests to confirm where the differences occurred between groups through Q1 and Q2. Question 1 was related to the efficiency of the input control when rotating 360 degrees and changing the direction. There were significant differences between group means, as determined by the Scheffe’s tests, between Group E and Group H (p < .05) and between Group F and Group H (p < .05). This result indicates that participants in Group E and Group F were more comfortable with finger-touch input control rather than a physical input controller on the touchscreen (Table 7).
Table 7. Q1: Efficiency of Input Control in Groups E–H
|
Group |
N |
Mean |
Std. deviation |
Std. error |
95% confidence interval for mean |
|
|
Lower |
Upper |
|||||
|
Group E |
9 |
4.22 |
.97 |
.32 |
3.48 |
4.97 |
|
Group E-1 |
9 |
3.67 |
1.23 |
.41 |
2.73 |
4.61 |
|
Group F |
9 |
4.22 |
1.10 |
.36 |
3.38 |
5.06 |
|
Group G |
9 |
3.33 |
1.32 |
.44 |
2.32 |
4.35 |
|
Group H |
9 |
2.67 |
.70 |
.24 |
2.12 |
3.21 |
|
Total |
45 |
3.62 |
1.20 |
.18 |
3.26 |
3.98 |
Question 2 was about the efficiency of control movement over long and short distances. The input control action of the movement was adjusted by dragging an object with a finger directly on the touchscreen (Groups E, E-1, and G), controlling the graphical interface with finger touch (Group F), and controlling a joypad attached on the touchscreen (Group H). The result shows that participants in Group F were more comfortable with controlling the movement of the game object through finger touch directly on the graphical interface (Table 8). There were significant differences between group means as determined by the Scheffe’s tests between Group F and Group H (p < .05).
Table 8. Q2: Efficiency of Control Movement in Groups E–H
|
Group |
N |
Mean |
Std. deviation |
Std. error |
95% confidence interval for mean |
|
|
Lower |
Upper |
|||||
|
Group E |
9 |
3.89 |
1.05 |
.35 |
3.08 |
4.70 |
|
Group E-1 |
9 |
3.56 |
1.13 |
.38 |
2.69 |
4.42 |
|
Group F |
9 |
4.22 |
.68 |
.22 |
3.71 |
4.73 |
|
Group G |
9 |
2.89 |
1.27 |
.42 |
1.91 |
3.86 |
|
Group H |
9 |
2.56 |
.73 |
.24 |
2.00 |
3.11 |
|
Total |
45 |
3.42 |
1.14 |
.17 |
3.08 |
3.76 |
Question 3 was related to participants’ level of satisfaction with the visibility of contents on the smartphone screen during gameplay. Both Groups F and H were most satisfied with the visibility of the contents on the screen while participants were focusing on the gameplay. This finding suggests that using the graphical interface to simulate the game with frequent actions on excessive traffic would make game users satisfied with screen visibility. This means that the finger gestures of both hands can be ineffective due to the visual impairment caused by finger movements on a small touchscreen. Question 4 was to evaluate the accuracy of the shooting behavior from the given input control tasks. The shooting action is controlled by screen touch directly with either finger or stylus pen. According to the mean values, Groups G and H were most satisfied with the accuracy of the shooting control. By using the stylus pen (S-pen), the participants in both groups were able to aim at the target precisely and quickly on the touchscreen. In contrast to this finding, finger touch seems to be ineffective in action games when aiming at the target requires a speedy and accurate control action. Question 5 was related to the effect of multi-input control tasks (movement and simultaneous shooting). The results showed similar mean values between groups; however, Group E was more satisfied with multi-input control during gameplay. This result explains that participants were more comfortable with input control tasks by direct finger-touch rather than mixing or using a physical input controller. However, there was an unpredicted finding in Group G where all five female participants played the game with only the stylus pen even though the task required the use of both hands for gameplay (Figure 11). They started the game with both hands based on the input control task guidelines, but they switched their gameplay to one-handed input for both shooting and moving objects by using the stylus pen only. Participants responded in open-ended questions that they perceived using the stylus pen was much faster and easier to control gameplay, even if the game scores and achievement levels did not show an increase in effectiveness.
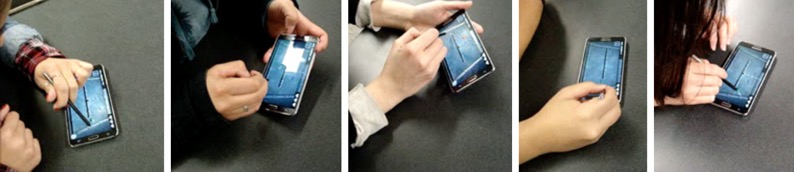
Figure 11. Input control gestures among female participants in Group G.
Question 6 was to evaluate the comfort level of holding a smartphone during gameplay. The results showed mean values (lower bound 3.26 and upper bound 4.02) at the 95% confidence interval between groups; however, Group H (mean value = 4.22) felt more comfortable with holding a device during gameplay. Participants in Group E-1 responded in open-ended questions that they felt more discomfort even though they achieved better game levels. As participants progressed through game levels, enemy attacks were heavier and faster. We also observed unexpected finger gestures in Group E and E-1. According to the conditions of gameplay for two-handed input control tasks (left hand for movement and right hand for shooting) with only finger gestures, we expected that the participants in these two groups would play the game with two-handed input controls while they were holding a smartphone. However, participants created different input control actions with one- or two-handed input control. Similar to this phenomenon, we already claimed that female participants in Group G controlled both movement and shooting by using an S-pen with one hand. Three participants played the game with one hand to control both shooting and moving (see Table 9: E, P3; E, P8; and E-1, P2) and four participants played the game without holding a smartphone for one-handed or two-handed input control (see Table 9: E, P1; E-1, P1; E-1, P2; and E-1, P3). We also found that participants in Group E-1 met the game achievement better than Group E as they were using index fingers instead of thumbs for finger-touch input control without a graphical interface on the touchscreen. In the open-ended questions, these participants responded that they could control the gameplay better with comfort and focus more on their performance. This result was also reflected by the accuracy and comfort level results.
Table 9. Finger Gestures in Groups E and E-1
|
Finger Gesture |
 |
 |
 |
 |
 |
 |
|
Participant (Group, Participant order) |
E, P1 |
E, P3 |
E, P8 |
E-1, P1 |
E-1, P2 |
E-1, P3 |
|
Level |
5 |
6 |
10 |
19 |
10 |
12 |
|
Score |
4133 |
7141 |
15972 |
35470 |
16913 |
20988 |
|
Accuracy |
464 |
672 |
970 |
2835 |
912 |
1025 |
|
Q6 Rate |
3 |
2 |
3 |
1 |
2 |
3 |
Summary of User Behaviors and Exit Interview
User behaviors and finger gestures were observed during the usability test. There were common behaviors among participants, but distinctive behaviors and finger gestures were analyzed to see how their experiences influence game achievement and satisfaction level. The analysis of the user experience through interactive input control tasks is as follows.
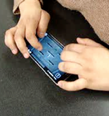
Participants in Group A held the smartphone device with one hand and controlled the movement and bombing with the other hand. All users in this group used an index finger regardless of whether they were left- or right-hand users. However, Groups E and E-1 showed three different behaviors (see Figure 12); some participants used their thumbs to control movement and shooting while other participants used both thumbs and index fingers. Three participants played the game with both index fingers for movement and shooting in order to control the input task for faster response during a game. With this method of gameplay, they felt more comfortable with shooting and moving input control tasks without a graphical interface on the touchscreen.
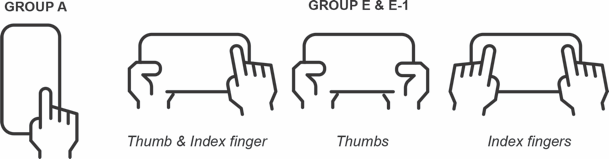
Figure 12. Finger gesture and input control behavior between Groups A, E, and E-1.
Figure 13 shows the rest of the groups in which participants used the graphical interface and analog controller. Using a static interface for movement control in Group B and Group D, all participants used their left thumbs. Participants in Groups G and H appeared to be the most uncomfortable in controlling both movement and shooting. In the open-ended question, they responded that the perception of two different input control tasks was not easy in terms of holding a smartphone and controlling multi-input control tasks on the touchscreen. This user experience reflects a discomfort with the nature of the smartphone gaming environment when the game requires multi-input control tasks with both hands.
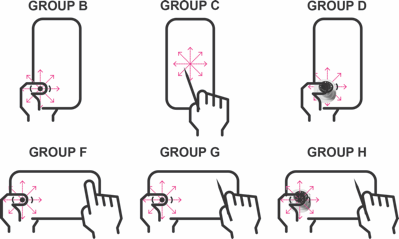
Figure 13. Input control with finger-touch and analog controller.
Through their experience in the usability test, most participants considered that it would be necessary to adopt physical controllers in future smartphones. They considered that adding input control buttons on a smartphone would be more effective for not only playing smartphone games but also using other apps. Most participants in Groups C, D, and H also expressed that either built-in or attachable joypads would be a user-friendly way to control the accuracy of multitasking in smartphone games. In comparison with video/PC or console games, all participants did not find playing the game for longer periods to be comfortable or enjoyable to play because of the density of fingers and hands gestures in a limited space and high demands of input control accuracy during gameplay. In terms of overall satisfaction level, Groups A–D with one-handed control were more satisfied than Groups E–H with two-handed control. This finding deduces that smartphone games would be more efficient and effective on the single-input control tasks.
Discussion about the Effectiveness in Gender Comparisons
The results of the mean values measured in gender comparisons showed a significant impact of the user experience in this study. In the measurement of collected data, this study found that (a) the dependent variables of time length and total game score in Groups A–D (Table 10), and (b) the dependent variables of total game score, level, and accuracy rating in Groups E–H influenced gameplay achievement differently between genders (Table 11). There were significant gender effects between Groups A-D: t(34) = -3.08, p < .05 showing that male participants earned higher scores than female participants; and t(34) = -2.10, p < .05 showing that male participants played the game longer than female participants.
Table 10. Gender Comparison with Dependent Variables in Groups A-D
|
Dependent variables |
Group |
N |
Mean |
Std. deviation |
Std. error |
t |
df |
p |
|
Total Score
|
Female |
18 |
72158.33 |
28325.15 |
6676.30 |
-3.08 |
34.00 |
0.004 |
|
Male |
18 |
151666.67 |
105633.08 |
24897.96 |
||||
|
Time |
Female |
18 |
1.57 |
0.67 |
0.16 |
-2.10 |
34.00 |
0.043 |
|
Male |
18 |
2.58 |
1.93 |
0.45 |
There were significant effects between genders within Groups E–H: t(43) = -3.28, p < .01 showing that male participants achieved higher levels than female participants; t(43) = -2.90, p < .05 showing that male participants earned higher total scores than female participants; and t(43) = -2.80, p < .05 showing that male participants earned higher accuracy rates than female participants.
Table 11. Gender Comparison with Dependent Variables in Groups E–H
|
Dependent variables |
Group |
N |
Mean |
Std. deviation |
Std. error |
t |
df |
p |
|
Level
|
Female |
26 |
5.00 |
3.298 |
0.65 |
-3.28 |
43.00 |
0.002 |
|
Male |
19 |
9.16 |
5.210 |
1.20 |
||||
|
Total Score |
Female |
26 |
6128.27 |
6780.35 |
1329.74 |
-2.90 |
43.00 |
0.006 |
|
Male |
19 |
14741.47 |
12974.22 |
2976.50 |
||||
|
Accuracy rating |
Female |
26 |
693.00 |
538.12 |
105.54 |
-2.80 |
43.00 |
0.008 |
|
Male |
19 |
1217.47 |
717.80 |
164.67 |
There were also significant effects between genders within groups in Group D, t(7) = -6.70, p < .001 showing that male participants earned higher scores than female participants; and t(7) = -3.22, p < .05 showing that male participants played the game longer than female participants. Mean values between genders shows a significant difference where male participants played the game much longer and obtained higher game scores than female participants in Group D (Table 12). This finding suggests that a joypad input control on the graphical interface would be more effective for male users, and female users would play the game better with a stylus touch pen on the touchscreen. This result also explains that the male subjects were more familiar with a physical game controller because of their prior experience with video and console games.
Table 12. Significant Effect with Gender Comparison in Group D
|
Dependent Variables |
Group |
N |
Mean |
Std. deviation |
Std. error |
t |
df |
p |
|
Total Score
|
Female |
6 |
74750.00 |
29975.26 |
12237.35 |
-6.70 |
7.00 |
< .001 |
|
Male |
3 |
318483.33 |
83762.50 |
48360.30 |
||||
|
Time |
Female |
6 |
1.70 |
0.77 |
0.31 |
-3.22 |
7.00 |
0.015 |
|
Male |
3 |
5.32 |
2.71 |
1.57 |
Summaries of the Findings
We surmised, based on the results and findings of the usability test in the pilot study, that finger-touch input control directly on the touchscreen was more effective than multi-input control by using a game controller for smartphone gameplay. However, this study found that participants’ results (quantitative and qualitative) were not absolutely positive with smartphone games requiring multi-tasking game rules in finger-touch input controls. Instead, participants considered smartphone games to be suitable for dynamic single input control action rather than multi-input control tasks at the graphical interface. Moreover, the usability test proved that there is no significant difference in comparison to the result of dependent values in terms of different independent variables between direct finger-touch input control and a game controller (Groups A–D). Therefore, emulation game controllers are not suitable to replace the finger-touch input controls on the smartphone screen.
In contrast to the pilot study results, the main study found that a physical game controller was the most effective on gameplay when users interacted with one-handed input control on the touchscreen. In the measurement of game scores and time length, the results appeared that participants performed gameplay more effectively and efficiently by using the input controls. Both the stylus pen and the joypad were user-friendly in terms of finger-touch input control. However, the results of the two-handed input control test were less effective than the one-handed input control. Participants achieved the game levels and scored better with the two-handed, finger-touch input control directly on the touchscreen, but the result in measurement through the one-way ANOVA test showed there was no significant difference between groups except Group E-1. With 15 minutes pre-exercise of gameplay in Group E-1, participants’ familiarity of performance improved their perception of the game rules and strategies so that the results showed a significantly different impact for the dependent values in comparison with the other groups. We could not find any significant differences between each participant with or without smartphone game experiences. However, we found the result was different from input control conditions and 15 minutes of pre-exercises; Group E-1 especially showed higher achievement of gameplay regardless of prior experiences.
This study also investigated other findings through observation and the exit interviews. We found that two-handed input control consisted of three different types of finger gestures and orientations: a thumb and an index finger control, two thumbs control, and two index fingers control. Participants in the one-handed, finger-touch input control used either the left or right index finger during gameplay. Although the results of the usability test showed that (a) finger-touch input control with two hands was more effective than using an input controller on the touchscreen, (b) most participants reported a positive gameplay experience with the controller, and (c) the touchscreen enhanced the visibility of the game contents on the screen during gameplay. Therefore, the findings of the main study suggest that finger-touch input control with a single physical controller would be effective for smartphone users to create interactive input control methods with either one or two hands. These findings would suggest significant recommendations to game developers and the smartphone industry.
Conclusion
In conclusion, the empirical results of the usability test provided answers to the following research questions:
- If smartphone users are satisfied with the use of the digital touchscreen interface, would they have a positive experience with smartphone games on the touchscreen?
- If smartphone users are more familiar with the digital interface, does it mean that the touchscreen is the best solution for all apps?
- Is there any empirical evidence comparing the digital interface to the analog interface on smartphones since various types of physical game controllers for smartphones have been introduced to the game market?
First, this study recommends that a physical input controller is more effective with one-handed touch input control for the single task of changing directions and movements. This finding indicates that the stylus pen and joypad are comfortable graphical input control interfaces that allow users to reach game achievement efficiently. Second, the empirical usability study argues that finger touch-based input control by two hands is more effective for dynamic interaction with multi-tasking such as movement and shooting in arcade games. This result indicates that direct input control on the touchscreen shows a greater satisfaction with gameplay than using a physical game controller. However, game achievement based on game scores and levels reached is not significantly different between finger-touch input control and a physical game controller. Third, the measurement results of accuracy levels show that finger touch-based input control is more accurate once users become familiar with finger gesture-based input control. However, one-handed finger gesture-based input control was not effective when compared with a physical game controller. Therefore, the hypothesis of this study is not true that experienced smartphone users are absolutely positive about smartphone games on a touchscreen. With all findings in the usability test, this study argues that smartphone game developers should consider input control methods in the smartphone gaming environment rather than focusing on only finger-touch screen control.
Recommendations
Empirical findings from this study suggest that smartphone games should consider touchscreen input controls with both finger gestures and physical game controllers. In considering types of smartphone games, a one-handed analog controller would be more effective for the games that require control of direction and movement of the speed, accuracy, and completion time. Two-handed input control with finger gestures directly interacting with a touchscreen would be more effective for the type of strategy games that requires users to oversee multi-tasking input control such as simultaneous input control actions with shooting and changing directions. For future studies, we predict that the smartphone game industry will introduce new game design interfaces with gestural-based interaction on various types of touchscreen games. Even though G-sensor (moveable two hands-gestural touchless input control) has provided dynamic smartphone game experiences, the nature of the input control is still limited to game design and contents. Therefore, we advocate that investigation through empirical usability tests for developing input control theories and methods in the smartphone game environment has a significant impact for researchers and developers. Continuing implications from finding the effectiveness of game control interfaces will affect not only user experience in the game design industry, but also graphic user interface in product design.
Tips for Usability Practitioners
With potential to have over 100 participants in the pilot and main studies, we reviewed the plan for the testing procedure several times to receive Institutional Review Board (IRB) approval. We suggest to usability practitioners some tips to consider when planning to use a large group for a user test where each participant spends longer than 30 minutes.
- Expand the type of independent variables even though the initial plan does not include the measured values.
- Understand any risk of user testing for the participants based on the IRB guidelines.
- Provide sufficient information to participants for their understanding of the purpose of user testing and time-consuming exit interviews in order to collect accurate data and information.
- Make participants comfortable with video recording and observation before the usability test occurs.
Acknowledgements
We thank all the volunteers who participated in the usability test. Their sincere contribution was significantly important to achieving the research objectives, and we are pleased to share the research outcomes with them. As this study was for a doctorate dissertation, we thank the thesis committee and other staff members for their continuous help and support.
References
Baudisch, P., & Chu, G. (2009). Back-of-device interaction allows creating very small touch devices. Proceedings of the SIGCHI Conference on Human Factors in Computing Systems (1923–1932). Boston, MA, USA: ACM.
Bevan, N. (1995). Measuring usability as quality of use. Software Quality Journal, 4(2), 115–130.
Brice, K. (2009, September 30). Games make up 20% of app store content. Retrieved October 2016 from https://www.gamesindustry.biz/articles/games-make-up-20-percent-of-app-store-content
Cairns, P., Li, J., Wang, W., & Nordin, A. (2014). The influence of controllers on immersion in mobile games. Proceedings of the SIGCHI Conference on Human Factors in Computing Systems (371–380). Toronto, Ontario, Canada: ACM.
Choe, P., & Schumacher, D. (2014). Influence of different types of vibrations on technical acceptance of a mobile game aiming for hedonic satisfaction. International Journal of Human-Computer Interaction, 31(1), 33–43.
Darejeh, A., & Singh, D. (2013). A review on user interface design principles to increase software usability for users with less computer literacy. Journal of Computer Science, 9(11), 1443–1450.
Feki, M. A., Kawsar, F., Boussard, M., & Trappeniers, L. (2013). The Internet of Things: The next technological revolution. Computer, 46(2), 24–25.
Hoggan, E., Brewster, S., & Johnston, J. (2008). Investigating the effectiveness of tactile feedback for mobile touchscreens. Proceedings of the SIGCHI Conference on Human Factors in Computing Systems (1573–1582). Florence, Italy: ACM.
Hornbæk, K. (2006). Current practice in measuring usability: Challenges to usability studies and research. International Journal of Human – Computer Studies, 64(2), 79–102.
Hutchins, E., Hollan, J., & Norman, D. (1985). Direct Manipulation Interfaces. Human–Computer Interaction, 1(4), 311–338.
Kwon, B., Javed, W., Elmqvist, N., & Yi, J. (2011). Direct manipulation through surrogate objects. Proceedings of the SIGCHI Conference on Human Factors in Computing Systems (627-636). Vancouver, British Columbia, Canada: ACM.
Natapov, D., & Mackenzie, I. (2010). Gameplay evaluation of the trackball controller. Proceedings of the International Academic Conference on the Future of Game Design and Technology (167–174). Vancouver, British Columbia, Canada: ACM.
Negroponte, N. (1995). Being digital (1st Ed.). New York, NY: Knopf.
Norman, D. (1988). The psychology of everyday things. New York, NY: Basic Books.
Oshita, M., & Ishikawa, H. (2012). Gamepad vs. touchscreen: A comparison of action selection interfaces in computer games. Proceedings of the Workshop at SIGGRAPH Asia (27–31). Singapore: ACM.
Rosli, D. I. (2015). Cognitive awareness prototype development on user interface design. TOJET: Turkish Online Journal of Educational Technology, 14(2), 32–40.
Ryu, T. (2010). Maum: Exploring immersive gameplay with emerging user interface devices (Master’s thesis). Available from USC Libraries, http://digitallibrary.usc.edu/cdm/ref/collection/p15799coll127/id/331031 (Legacy record ID: usctheses-m3040).
Saffer, D. (2008). Designing Gestural Interfaces: Touchscreens and Interactive Devices. Sebastopol, CA, USA: O’Reilly Media, Inc.
Sethumadhavan, A. (2016). Five user interface design tenets. Ergonomics in Design: The Quarterly of Human Factors Applications, 24(2), 31.
Shneiderman, B. (1982). The future of interactive systems and the emergence of direct manipulation. Behaviour & Information Technology, 1(3), 237–256.
Teather, R., & Mackenzie, I. (2014). Comparing order of control for tilt and touch games. Proceedings of the 2014 Conference on Interactive Entertainment (1–10). Newcastle, NSW, Australia: ACM.
Tsagarakis, N., & Caldwell, D. (2013). Improving mouse-based computer interaction in users with weak upper limb motion control using a haptic assistive system. Human-Machine Systems, IEEE Transactions on, 43(2), 177-187.
Wobbrock, J., Morris, M., & Wilson, A. (2009). User-defined gestures for surface computing. Proceedings of the SIGCHI Conference on Human Factors in Computing Systems (1083–1092). Boston, MA, USA: ACM.
Zaman, L., Natapov, D., & Teather, R. (2010). Touchscreens vs. traditional controllers in handheld gaming. Proceedings of the International Academic Conference on the Future of Game Design and Technology (183–190). Vancouver, British Columbia, Canada: ACM.
[:]