
Abstract
Evidence gap maps (EGMs) are a visual tool for presenting the state of evidence in particular thematic areas relevant to international development, with the aim of providing easy access to the best available evidence and highlighting gaps in knowledge. There is little evidence to indicate how people use and interact with them. Usability testing of the existing EGMs was conducted to determine (a) how the EGMs are being used and (b) what is the value of EGMs as an evidence tool.
The research method we used was a qualitative problem-discovery usability study. Eight participants representing clinicians, researcher, and program managers were asked to complete five tasks using EGMs. This was followed by semi-structured interviews that were recorded and analyzed thematically. Findings show that participants could easily understand the maps, methodological strengths and weaknesses of the available sources, and the areas of evidence gaps. However, participants experienced difficulties in understanding the concept of strength of evidence and methodological quality of the reviews. The usability testing helped to identify changes necessary to make the EGMs more accessible to a wide range of audiences.
Keywords
Evidence Gap Maps, Usability testing, vision, cataract gap maps, UX, User Experience, Accessibility, Interaction Design
Introduction
An evidence gap map (EGM) is a tool to visually present evidence on the effects of interventions in a particular thematic area, with the aim of providing easy access to the current knowledge and highlighting gaps in existing research (Snilstveit, Vojtkova, Bhavsar, & Gaarder, 2013). The main target audiences of the EGMs include policymakers, practitioners, program managers, and researchers. The aim is to provide them with the most up-to-date evidence to inform program investments and best practice and to identify where there is an urgent need for more studies.
The approach was initially developed by the International Initiative for Impact Evaluation (3ie) and has been applied to a number of international development areas including water, sanitation and hygiene, education, and social inclusion (International Initiative for Impact Evaluation, 2015; Snilstveit et al., 2013). The primary goal of EGMs is to improve access to evidence for policy-makers and practitioners in low- and middle-income countries (LMICs) and to include evidence relevant to these contexts. EGMs adopt systematic methods to identify and describe available research using an interactive graphical tool. The graphics are structured around a matrix, with relevant interventions listed on the y-axis and outcomes presented along the x-axis. Studies are systematically screened for relevance and all sources are appraised using a standardized critical appraisal tool (Snilstveit et al., 2013; Virendrakumar, Jolley, Gordon, Bascaran, & Schmidt, 2016). All included studies, typically impact evaluations and/or systematic reviews, are then plotted in the map cells corresponding to the specific interventions and outcomes they address. The cells are linked to summary pages and show methodological quality of the review using a traffic light system.
From 2013 to 2016, we used the EGM approach and developed five EGMs presenting evidence on interventions to address different conditions causing visual impairment, including cataract, refractive errors, diabetic retinopathy, glaucoma, and trachoma. The five EGMs presented evidence from published systematic reviews and included between 15 and 52 sources per map. We worked closely with the Cochrane Eyes and Vision Group to develop all EGMs. Our maps were displayed as a matrix, where areas of interventions were indicated along the x-axis, and the strength of evidence was shown along the y-axis (Figure 1). Visually, each review was represented by a single bubble that linked to the review summary page. To enable users to visually identify the quality of each review, green, orange, and red colors were used to represent high, medium, and low levels of confidence in review conclusions. Information on the methods used to develop the gap maps is available elsewhere (i.e., Virendrakumar et al., 2016).
All eye health EGMs are made publicly available through our website (https://research.sightsavers.org/), and our website also provides a number of hyperlinks to other relevant websites. We have been promoting the EGMs through professional conferences targeting eye care specialists as well as broader evidence-focused scientific fora. The number of Internet–based searches and accesses to EGMs can be tracked, but very little is known about the usability/utility and usefulness of these EGMs by policy-makers and clinicians. Therefore, to address this knowledge gap, we conducted a usability testing of the Cataract EGM in 2017.
We tested the usability of the Cataract EGM, largely for two reasons. First, this is the first and most comprehensive EGM in terms of the number of available systematic reviews, which includes 52 published sources. Secondly, untreated cataracts are the leading cause of blindness and the second leading cause of visual impairment globally (World Health Organization, 2019), and the evidence on the effectiveness of interventions to address this significant health problem is of critical importance, particularly for LMICs. We used the Cataract EGM as an example, but the findings from the usability testing are applicable to the other eye health EGMs.
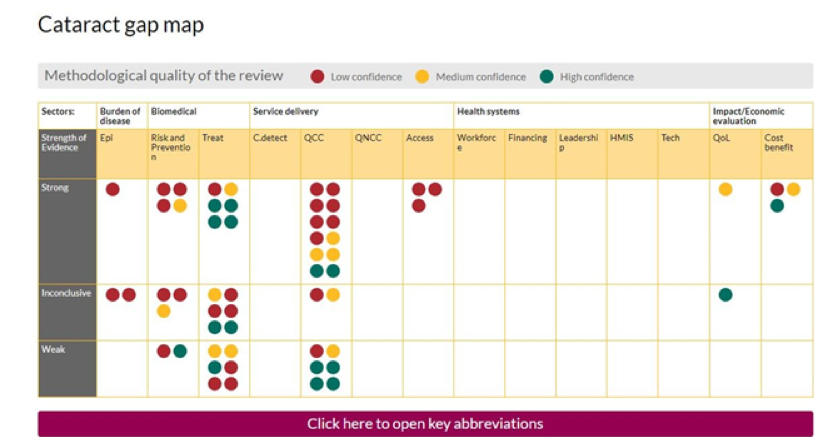
Figure 1. Cataract evidence gap map.
Aim
We aimed to test the usability of the Cataract EGM to determine whether this EGM (a) clearly displays the methodological quality and strength of evidence of sources included, (b) clearly highlights gaps in knowledge and/or research, and (c) is useful for its intended target audience.
We focused on four research questions:
- How easy is it to understand where the strength of evidence and methodological quality of the review lie?
- How easy is it to identify gaps in research?
- Can users operate and access the tool with ease?
- What are the users’ experiences of the usefulness of the EGM tool?
Methods
We followed a pre-defined protocol that documented the usability testing plan, including what was tested, by whom, what scenarios were used, how the testing was conducted, and which metrics were used to capture the results (Usability.gov, 2017).
Study Design
Our research employed a qualitative problem-discovery usability study, which involved evaluating a product with the objective to identify and eliminate any usability problems (Lewis, 2012; Usability Body of Knowledge, 2019).
Participants
According to Jakob Nielsen, with five users, you usually get close to the usability testing’s maximum benefit-cost ratio; however, some tests should be bigger and some smaller depending on what/how you are testing (2012). In this case, we contacted a total of 10 participants from different professional backgrounds (or different user groups) and from different countries, rather than one homogeneous user group. In other words, instead of approaching just clinicians, we contacted six clinicians, two researchers, one policy-maker, and one program manager. Four out of 10 participants were based in high income countries, but all had extensive experience of working in LMICs. Participants were contacted via email, informing them of and asking them to take part in the study. At this point, each participant was asked to take part in a desk-based review only to avoid respondent bias. By using this approach, we could observe the usability of the EGMs without any prior preparation. After that, we asked participants to complete a number of tasks, and we observed and recorded their interactions with the EGM.
It is unrealistic to expect discovery of all (or even most) usability problems in a single small-sample usability test, especially when the participants make up a heterogenous rather than homogeneous group (Lewis, 2014). It is possible, however, to use the cumulative binomial probability formula to estimate levels of discovery for a given sample size as a function of the probability of occurrence of the problem in the population represented by the sample of participants and tasks (Lewis, 2012, Table 11; Lewis, 2014, Table 2), where “discovery” means the problem occurs at least once. When n = 10, the expected magnitude of discovery for problems that will affect at least half of the population (p = 0.50) approaches 100%. For lower values of p, the expected magnitudes of discovery are smaller, but still non-zero (e.g., p = 0.25: expected 94% discovery; p = 0.15: expected 80% discovery; p = 0.10: expected 65% discovery; p = 0.05: expected 40% discovery; p = 0.01: expected 10% discovery).
Materials and Procedure
We conducted the usability testing remotely using GoToMeeting software, which allowed participants to share their screens with the exercise observers. Where possible we asked participants to activate their webcams to ensure a clear view of each participant.
We asked participants to complete five tasks, including the following:
- Task 1 (user starts in Google): You are interested in finding out where there are gaps in cataract research. Where would you go to find this information?
- Task 2 (user starts on the evidence gap map home page): Can you identify three areas where there are gaps in cataract research; that is, where there is no evidence available?
- Task 3 (user starts on the evidence gap map home page): Can you find a piece of cataract research that is both strong (in terms of conclusions) and high quality (in terms of methodology)?
- Task 4 (user starts on the evidence gap map home page): Can you find a weak Quality of Clinical Care cataracts study and review the original source paper?
- Task 5 (user starts on the evidence gap map home page): What general conclusions can you make with regards to the gaps in Cataracts evidence?
We asked the participants to carry out the tasks and to speak aloud to explain the actions they were taking.
We recorded all usability testing activities, and we also made notes on observations to identify any usability issues and any challenges with completing the tasks.
At the end of the usability testing, we sent an electronic questionnaire where we asked for demographic information, occupation, whether they used the EGM before and how, and their thoughts on how we can improve the gap maps. This also allowed us to determine whether the participants were broadly satisfied with the product and whether they would recommend it to their peers and colleagues.
Results
The following sections provides details on participants’ characteristics, including how many completed the usability testing and the questionnaire. Based on the usability testing, we identified a few issues that can be rectified including understanding the strength of evidence, navigation, abbreviations, source link, and website header. Overall, all participants found this tool useful and, therefore, we should publicize the tool better.
Participants
Nine out of ten participants successfully completed the usability testing, as one participant had poor internet connection and only eight completed the questionnaire (see Table 1).
Table 1. Characteristics of Included Participants
|
Participant number |
Occupation |
Used gap maps before? |
Gender |
Location |
Questionnaire |
|
1 |
Clinician |
Yes |
Male |
Ethiopia |
Completed |
|
2 |
Clinician |
No |
Female |
USA |
Completed |
|
3 |
Clinician |
– |
Male |
Tanzania |
Not completed |
|
4 |
Clinician |
Yes |
Female |
Australia |
Completed |
|
5 |
Clinician |
No |
Male |
UK |
Completed |
|
6 |
Clinician |
Yes |
Male |
India |
Completed |
|
7 |
Policy maker |
No |
Male |
UK |
Completed |
|
8 |
Academic researcher |
Yes |
Female |
Australia |
Completed |
|
9 |
Academic researcher |
Yes |
Female |
India |
Completed |
|
10 |
Program manager |
– |
Male |
Cameroon |
Not completed |
Seven out of eight participants stated their age on the survey questions, with three out of seven being in the age group 35–44 years, another two being aged 55–64 years, and one each in the age groups 25–34 and 45–54 years. Five of the eight participants had used EGMs before.
Amongst those who had used EGMs previously, the cataract gap map was the most commonly accessed (Figure 1). The sources of information about eye health EGMs were from word of mouth, the Sightsavers’ website, and international conferences. All participants said that they would recommend our EGMs to their colleagues or peers, and the preferred way of communication would be a link sent by email.
Research Questions
The following sections present the results of this study and how the results relate to each research question.
Research Question 1: How easy is it to understand where the strength of evidence and methodological quality of the review lie?
During the usability testing, we asked the participants to identify a piece of research that is strong (in terms of conclusion) and high quality (methodology), and we saw that they struggled to understand the concepts and how to interpret the task. For example, one participant thought that a weak study was represented by a red bubble confusing the concepts of strength of evidence and methodological quality. In addition, when we asked participants “how do you think we can improve the gap maps?” a couple of participants mentioned that we need to clearly explain what the “strength” of evidence in the matrix refers to.
In response to this task, one participant had accessed the link “How to use evidence gap maps” before executing the task. This specific page helps users of the EGM to understand the meaning of strength of evidence and methodological quality, and therefore to complete the task successfully. One way to address this problem is to add frequently asked questions to highlight common questions and important information, including the following: what is the difference between low confidence and high confidence reviews? and what is the difference between weak and strong strength of evidence? However, to make this page more accessible and to encourage users to use these tabs more effectively, our communication team suggested to transform the content into an educational video (with a transcript for accessibility). To help emphasize how we represent the different methodological quality of the reviews, our communications team recommended including a letter abbreviation for the color codes: L for Low, M for Medium, and H for High. Another recommendation was to change the shape of the bubbles, for example, use a red triangle for low, orange circle for medium, and green square for high.
Research Question 2: How easy is it to identify gaps in research?
All participants could easily identify gaps in evidence highlighted in the EGM, and all clearly identified where a good amount of evidence was available and which thematic areas required more research. In response to the lack of research in certain thematic areas, six participants mentioned the availability of other types of studies such as randomized controlled trials that could fill some of the existing gaps in the EGM. However, during this task we clarified that the objective of our EGMs was to include high quality evidence that synthesizes evidence from primary studies (including randomized controlled trials), rather than including standalone primary studies.
Research Question 3: Can users operate and access the tool with ease?
Navigation. During the usability testing we noticed that participants kept losing their information trail from the cursor moving around the screen. This showed us that they struggled to understand how to access and assess the gap map. We believe that this was because they could not differentiate between strength of evidence (strong, inconclusive, and weak) and methodological quality (high, medium, low). A feasible and cost-effective option to address this issue may be to include the strength of evidence and methodological quality into the pop-up box when a user hovers over the colored bubbles. Furthermore, three participants mentioned during the usability testing that it may be useful to add the publication date of when the review was conducted for relevance and change the label “click here for more information” to something simpler such as “view research paper” (Figure 2). A couple of participants also pointed out that for regular users it may be useful to indicate the newly added studies that can be addressed by adding an icon (e.g., star) next to these.
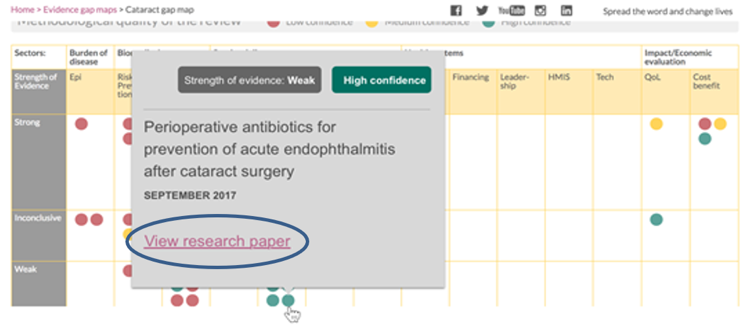
Figure 2. Redesign pop-up box.
Abbreviations. There are a range of abbreviations on EGMs due to limited word space (Figure 1). For example, epi is used to substitute for epidemiology, QCC is used for quality of clinical care, and so on. We noticed that some participants struggled to understand the meaning of these abbreviations and as a consequence they could not identify a study that fell under the category with an abbreviated name. In response to the “how do you think we can improve the gap maps?” survey question, one participant wrote the need to make the abbreviations clearer.
Despite the availability of a key at the bottom of the gap map, out of the 10 participants only one participant noticed it during the testing. On the other hand, the researchers mentioned that there was no need to access the abbreviations list as they knew what they meant. Taking into account that the majority of participants had issues with the abbreviations, it may be useful to remove these and use the full header titles instead (Figure 3).
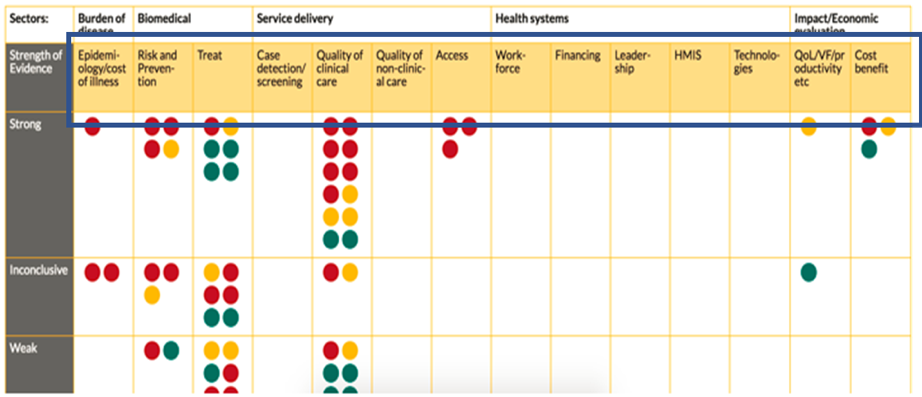
Figure 3. Expanded acronyms.
Source link to original paper. To help us understand if users could easily access the original paper, we asked them to identify a weak quality of clinical care (QCC) cataract study and review the original paper. To complete the task, participants had to identify and click on the Source link once they had accessed a systematic review summary (Figure 4). We observed that they constantly missed the publication source link; one participant even searched for the original source through their preferred academic service using the authors’ names. From this exercise, it is clear that we need to enhance the Source link to increase visibility (Figure 5).
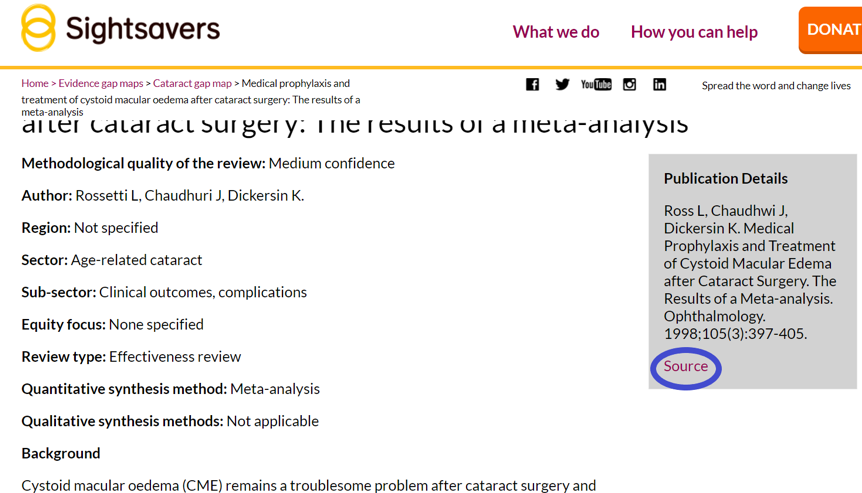
Figure 4. Source link currently on the EGMs.
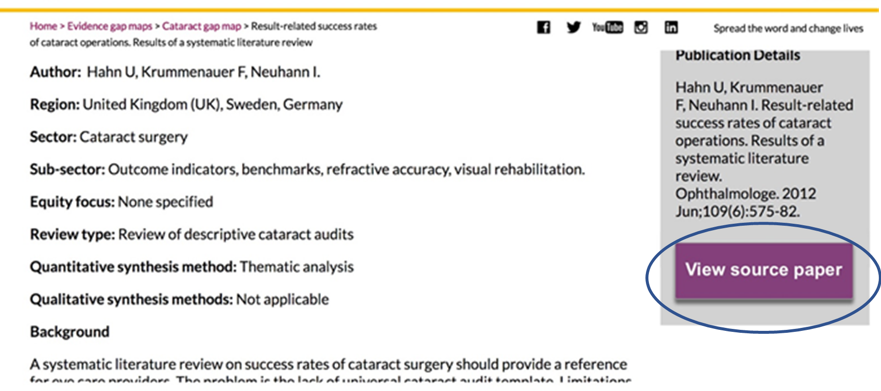
Figure 5. Source button to increase visibility.
Website header. During the testing we saw that the website sticky header encroached on the EGM, reducing its ease of use. It also made it harder to reference the top rows of the map while participants scrolled up and down to check information. This means that users could not read the methodological quality legend and the top label row of the map. One way to overcome this issue is to have a non-sticky header, and also the width of the header should probably be reduced.
Research Question 4: What are the users’ experiences of the usefulness of the EGM tool?
Overall, participants mentioned during the usability testing and on the questionnaire that the EGMs are a useful tool. This tool offers a one stop shop of high-quality evidence to a range of different users, and they would strongly recommend it to colleagues and peers.
“I think you have done a nice job in presenting a huge amount of information on the map, and the summaries I have used are well done in terms of accessible language. I think it is great you are getting a broad range of user-experiences to inform next steps – along with closing the evidence gaps, I think strengthening capacity to engage with the available evidence would be great.” – Participant 4
Alongside the positive comments on the usefulness of the EGM, two participants mentioned that more efforts are needed to promote the eye health EGMs.
“Publicize them better – They’re known among eye-health INGOs, but not so much across the private and government sectors.” – Participant 5
There is a clear need for a better in-house communications plan in order to increase the number of users through enhancing existing tactics (presentations at relevant events, distribution of handouts, and USBs at conferences) and developing new tactics (blogs about the maps in relevant media, promotional posts on social media, and emails to staff).
Summary Research Question: What else did we learn from the usability testing?
Two participants told us that they would like to be alerted to updates on the gap maps, and they recommended to include a subscription to updates button on the EGM landing page (Figure 6). This made us realize that we should also give the opportunity for users to alert us if we are missing a relevant review on the EGM (Figure 7).
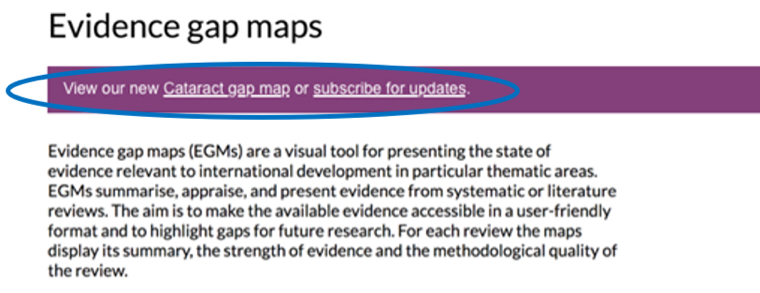
Figure 6. Addition of update links on the EGMs landing page.
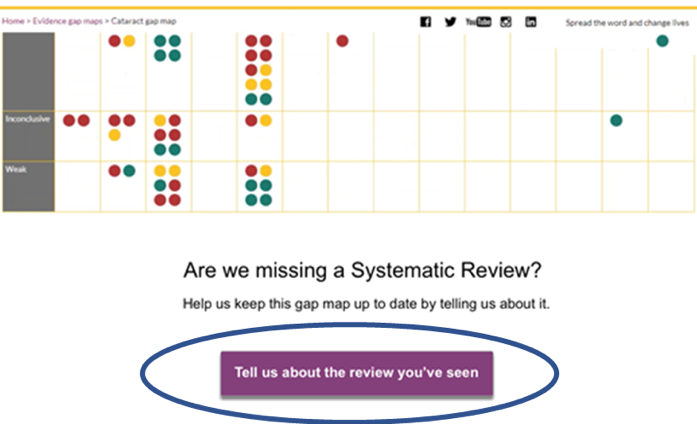
Figure 7. Addition to the webpage for users to provide feedback.
Based on the survey feedback, all users mentioned that their preferred method of sharing the EGM is via email; therefore, it may be useful to include a “Share this gap map” link/button to the EGM to allow the user to send an email directly from the EGM page (Figure 8).
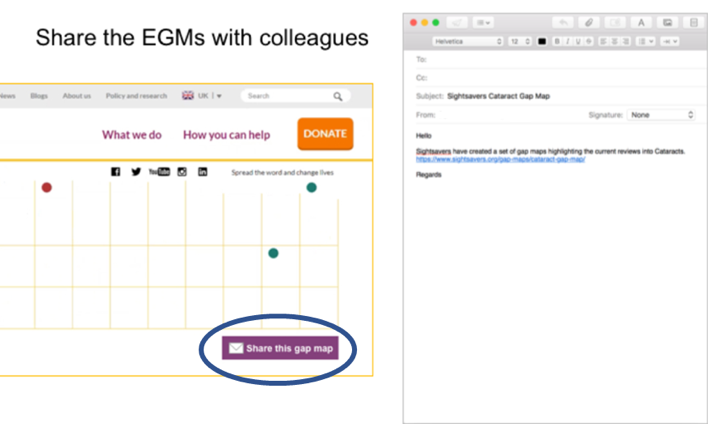
Figure 8. Addition of Share this gap map link.
Discussion
Rigorous and relevant research evidence is essential for planning cost-effective and scalable approaches to deal with major global health problems, such as visual impairment, that affects an estimated 233 million people, including over 32 million who are blind (Bastawrous & Henning, 2012; Bourne et al., 2013). Around 65% of blindness and 76% of moderate and severe visual impairments can be avoided through timely access to prevention or treatment, but access to such interventions in many LMICs continues to be limited (Bastawrous & Henning, 2012; Bourne et al., 2013). In addition, evidence to support policies and programs, that could improve population access to eye health services in resource constrained countries is either scarce or not easily available to policy-makers and practitioners in these settings. Providing interventions without acknowledging the best available evidence of what works and what does not, risks wasting opportunities and potentially doing harm (Chalmers, 2005). In addition, without a comprehensive overview of existing evidence, current research efforts may not be focusing on the most pressing priorities or areas with the most obvious evidence gaps.
To address this, we developed EGMs as a tool to help different stakeholders in LMICs access the best available evidence and to identify gaps in research. Over the years, EGMs have grown in popularity. For example, a recent map of existing maps identified 55 completed and 18 ongoing EGMs (Phillips et al., 2017). To date, we produced five EGMs for eye health (https://www.sightsavers.org/gap-maps/). However, despite the growing demand for and availability of EGMs, there is little research on how policy-makers and practitioners use and interact with them. This present study was designed to address this gap.
In this paper, we described experiences of users and present areas on the EGM that need improving. Overall, all participants found this tool useful and a one-stop shop of high-quality evidence in the eye health field. However, they also reported issues in differentiating between strength of evidence and methodological quality of the reviews that, as we saw during the usability testing, had an impact on how they navigated the EGM. Other areas of improvement include abbreviations, navigation, landing page presentation, additional functions for updates and communication, and promotion of EGMs. On the other hand, participants were able to quickly understand and gain value from the EGMs. All participants identified gaps in knowledge and understood the need to fill in those gaps. Throughout this paper, we presented ideas for redesign to overcome some of the issues uncovered by the testing.
This study has several limitations. Three of the nine participants who completed our study were Sightsavers staff and were aware of the EGMs, which may have biased their responses. We sent the consent form and information sheet to participants on the day before the testing, which included study details; this may have also biased users’ response. Despite the information provided and prompting the participants, they did not activate their camera to allow us to observe their body language. Conclusions were made based on screen recordings and how participants moved the mouse within the EGMs. We observed that participants may have felt under pressure to execute the tasks effectively in a timely manner due to the nature of this exercise. This may also have led to participants being afraid of doing or giving the wrong response, or rushing through the tasks as they knew they were being observed. We purposely selected participants for this study, with the majority of participants being clinicians.
Although we included very few participants and participants who were already quite familiar with our EGM, we observed difficulties in navigating the platform which made the usability test worthwhile. Nevertheless, as with any usability testing, there are an unknown number of remaining issues with EGM, some of which might be caused by our proposed changes. Therefore, it is important to conduct a re-test after implementing changes to the platform.
The EGMs should be interpreted with caution, for example, gaps in research means that systematic reviews were not conducted for those particular thematic areas. These gaps may be due to the availability of other types of studies (e.g., randomized controlled trials), and therefore, researchers may not find the need to produce systematic reviews in these areas. Other reasons may include lack of human or financial resources.
Findings from the usability testing on the cataract EGM should be applicable to all our EGMs namely, glaucoma, refractive error, diabetic retinopathy, and trachoma as these all share the same platform as the cataract EGM. The next steps will involve making changes on the platform based on findings from the usability testing and other design team suggestions. We also intend to include a person with visual impairment to be part of the development group to ensure accessibility. Thereafter, we plan to conduct a re-test to ensure that major usability issues are covered.
Our EGMs are slightly different when compared to other institution’s EGMs. Therefore, only some of the findings from this study may be generalizable to other organizations’ EGMs. Examples may include improving the content on the pop-up box when you hover over a bubble and visually present newly added studies. Other organizations looking to conduct usability testing on their EGMs will be able to gain value from our methods and limitations. In addition, findings from this study should also provide guidance on how to construct an EGM for those institutions looking to produce these for different fields.
Tips for User Experience Practitioners
The following tips can benefit practitioners using similar usability techniques when developing or using EGMs:
- The usability testing should not only consider usability, but also utility.
- Ensure that the tool is understandable to a wide range of users from different locations, including those who do not speak English.
- Because users do not always see or look for abbreviation keys, avoid using abbreviations in EGMs unless there is no choice.
- Easy access to source papers cited in EGMs is a very important function, so make sure that these controls are highly salient.
Acknowledgements
We would like to show our appreciation to all participants who took the time to contribute to this study.
References
Bastawrous, A. & Henning, B. D. (2012). The global inverse care law: a distorted map of blindness. Br J Ophthalmol, 96(10), 1357-8.
Bourne, R. R., Stevens, G. A., White R. A., Smith, J. L., Flaxman, S. R. & Price, H. (2013). Causes of vision loss worldwide, 1990-2010: a systematic analysis. Lancet Glob Health, 1(6), 339-49.
Chalmers, I. (2005). If evidence-informed policy works in practice does it matter that it doesn’t work in theory?, Evidence & Policy 1(2), 227-242
Lewis, J. R. (2012). Usability testing. Handbook of Human Factors and Ergonomics, Edition: 4th, Chapter: Usability Testing, Publisher: John Wiley and Sons, Editors: G. Salvendy, pp.1267-1312
Lewis, J. R. (2014). Usability: Lessons Learned . . . and Yet to Be Learned. Intl. Journal of Human–Computer Interaction, 30, 663–684.
Nielsen, J. (2012). How many test users in a usability study? From https://www.nngroup.com/articles/how-many-test-users/
Phillips, D., Coffey, C., Tsoli, S., Stevenson, J., Waddington, Eyers J., White, H. & Snilstveit, B. (2017). A map of evidence maps relating to sustainable development in low- and middle-income countries evidence gap map report. CEDIL pre-inception paper: London
Snilstveit, B., Vojtkova, M., Bhavsar, A. & Gaarder, Marie. (2013). Evidence gap maps—a tool for promoting evidence-informed policy and prioritizing future research. World Bank Group, Policy Research working paper no. WPS 6725.
International Initiative for Impact Evaluation. (2015). Evidence Gap Maps. Retrieved October 2017 from www.3ieimpact.org/evaluation/evidence-gap-maps/
Usability.gov. (2017). What & why of usability: User experience basics. Retrieved 19 Jun 2017 from https://www.usability.gov/what-and-why/index.html
Usability Body of Knowledge. (2019). Formative evaluation. Retrieved 11 Mar 2019 from https://www.usabilitybok.org/formative-evaluation
Virendrakumar, B., Jolley, B., Gordon, I., Bascaran, C. & Schmidt, E. (2016). Availability of evidence on cataract in low and middle income settings: a review of reviews using evidence gap maps approach. Br J Ophthalmol, 100(11), 1455-60.
World Health Organization. (2019). Blindness and Vision Impairment. Retrieved 26 Feb 2019 from https://www.who.int/news-room/fact-sheets/detail/blindness-and-visual-impairment