
Abstract
The System Usability Scale (SUS), created by Brooke (1996), is a widely used measure to assess subjective usability. However, few digital tools have been created to help collect the required data and compute SUS scores, which rely upon a formula that is complex. The aim of the project was to develop an open-source iOS app to help experimenters easily collect data, automatically compute SUS scores, and conveniently export study data. To ensure the free SUSapp is itself usable for both experimenters and participants, human factors iterative design and development methods were used, and the final version of the iPhone app was assessed using ISO 9241-11’s suggested measurements of efficiency, effectiveness, and satisfaction. Based on the results of this assessment, we can conclude that the app is usable, with 100% of the participants successfully using the application to rate a series of products, and a SUS score of 91. This supports the viability of using the SUSapp as an alternative to traditional methods of collecting SUS data. Further, use of the SUSapp will eliminate transcription and scoring errors that are often encountered when using other forms of the SUS.
Keywords
System Usability Scale, SUS, usability, mobile applications, open source
Introduction
The System Usability Scale (SUS), developed by Brooke (1996), is a widely used tool to measure subjective usability. The modified instrument (Bangor, Kortum, & Miller, 2008), shown in Figure 1, contains 10 questions. It is one of the most widely used instruments in the assessment of subjective usability with over 1,200 citations in the usability literature (Brooke, 2013). In practice, many human factors practitioners and researchers have administered the SUS survey either via paper or utilized web-based services, such as SurveyMonkey or Qualtrics. All of these methods are suitable from a psychometric standpoint, as research has indicated that paper and electronic forms of surveys are roughly equivalent (Davidov & Depner, 2011; Dodou & de Winter, 2014). While web-based services can be more convenient than paper, because they offer data visualization and cloud storage features, practitioners must still export data files and calculate SUS scores.
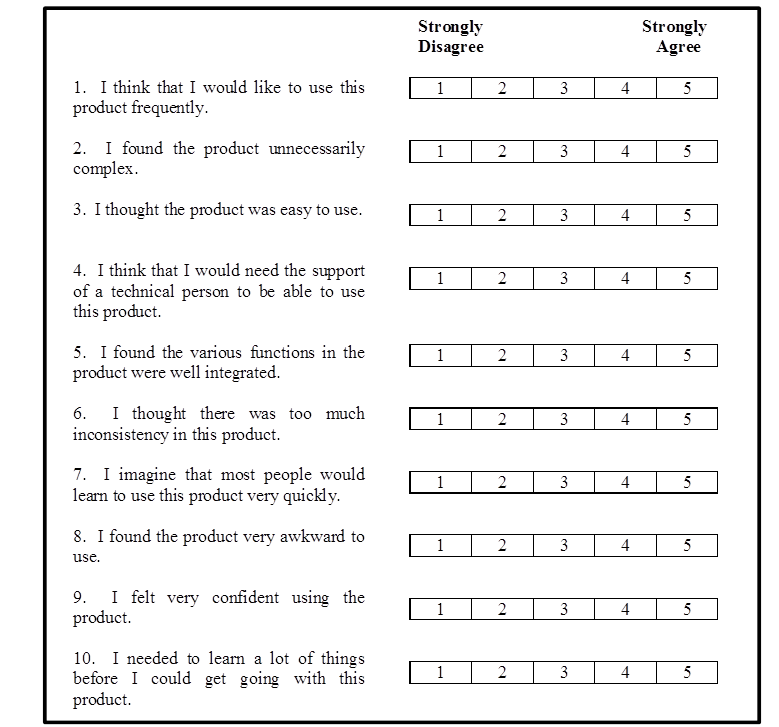
Figure 1. The System Usability Scale (Brooke, 1996), in its modified form (Bangor, Kortum, & Miller, 2008).
As discussed below, the calculation of SUS scores has proven to be one of the difficulties associated with using the instrument. Although there are excellent calculation spreadsheets available (e.g., Sauro, 2018; Tullis & Albert, 2018), many experimenters still calculate the scores themselves, either by hand or by using their own custom spreadsheet.
The SUS is scored using the following formula:
((Q1-1)+(Q3-1)+( Q5-1)+(Q7-1)+(Q9-1)+(5-Q2)+(5-Q4)+(5-Q6)+(5-Q8)+(5-Q10)) x 2.5
Although not mathematically difficult, the number of terms, the scaling factor, and the alternating question scoring format makes the SUS scoring formula complex to use in practice, and so the scoring calculations are often incorrect. Sauro and Lewis indicated that between 3% and 28% of SUS scores are calculated incorrectly, most likely due to the alternating form of the questions (2011).
Administering the system usability scale in the field can also be cumbersome. If the experimenter is utilizing one of the web-based data collection tools (e.g., SurveyMonkey or Qualtrics), then a laptop is most often used (Morgan, 2019) and must be secured. If the experimenter is using paper, then that paper must be managed. More importantly, regardless of which collection method is used, the survey must be set up so participants can complete it, and data must be transcribed and/or scored, which can lead to additional errors or data loss.
Because smartphone use is so common, with over 80% percent of people in the United States having a smartphone (Comscore, 2017), it was decided to collect data on this platform because it would be familiar to most experimenters and participants.
In previous work on developing a phone-based System Usability Scale assessment tool (de Castro & Macías, 2016) an Android application was developed. The researchers focused their evaluation primarily on the administrator as the user. In the research described here, we have developed an iOS application (so that there would be an application for this platform, versus Android in the case of de Castro & Macías), and the evaluation efforts were focused exclusively on the study participant as the user. With that in mind, the goal of this project was two-fold. The first goal was to develop an open-source, freely available iOS application that allows practitioners and researchers to collect SUS survey results, automatically compute scores, and export data in a streamlined process via a mobile platform. The second goal was to ensure that the application itself is usable for practitioners, researchers, and most importantly, study participants. Simply put, the usability assessment tool needs to be usable too, so we wanted to identify any major usability problems and fix them before sharing the app with others.
The Application
The application, SUSapp, was developed using React Native. React Native is an open-source software project created by Facebook to allow simple creation of cross-platform (i.e., iOS and Android) applications. React Native is used under the MIT License, which allows users to use and modify the software without restriction. A user-centered design process was utilized in the creation of the SUSapp. Specifically, we used human factors methods for design and development, such as iterative design and development with integrated usability and HF assessments throughout the design cycle. This in turn helped ensure that the app would fulfil users’ needs and would be as easy to use as possible. In particular, we wanted to create a tool that would allow experimenters to quickly and easily collect and score SUS data in the field, and we wanted to make that experience as usable as possible for the participants who would be taking the SUS on this new mobile platform.
Based on discussions with practitioners during the development process, the SUSapp tool focuses on the primary goals of collecting data, computing SUS scores, and then sending that data to the experimenter. It provides summary SUS score data to the experimenter after each participant and sends that data to the experimenter on demand. More sophisticated data exploration and analysis features were purposely excluded from the tool, as there are excellent software tools that are better suited to that set of tasks.
The tool allows experimenters to manage multiple studies simultaneously on the platform, so that several studies, or products within a single study, can be easily managed (Figure 2A). Based on feedback during the initial trails, it also supports the substitution of the product name into the field that says “product” (Figure 2B). This allows users to more easily map their rating task to the product they are using and has been shown to have no impact on the reliability or validity of the instrument (Sauro, 2011). For example, when testing the usability of a new printer, the word “system” in the questions could be replaced by the word “printer” (e.g. “I found the printer unnecessarily complex”).
The data collection screen presents a single question at a time (Figure 2C) and utilizes the modified SUS question 8, where “cumbersome” has been replaced with “awkward” in order to maximize understandability by the participants (Bangor, Kortum, & Miller, 2008; Finstad, 2006). Single screen presentation for each question was used to ensure maximum clarity of reading, ease of touch operation, and minimization of missed questions. This stands in contrast to the work of de Castro and Macías (2016) who presented 5 questions per page.
The original version of the SUS (Brooke, 1996), with alternating positive and negative questions, was utilized for the application. There is mounting evidence that these alternating scales, while helping to protect against acquiescence bias (Schriesheim & Hill, 1981) and extreme response bias (Cronbach, 1950), can be difficult for a subset of the population to interpret (Kam & Fan, 2018). For instance, Sauro and Lewis (2011) have shown that an all positive version of the SUS is highly correlated with the original version. As more evidence of this equivalence is published, it is likely that the SUSapp will allow for either the original or positive version to be administered.
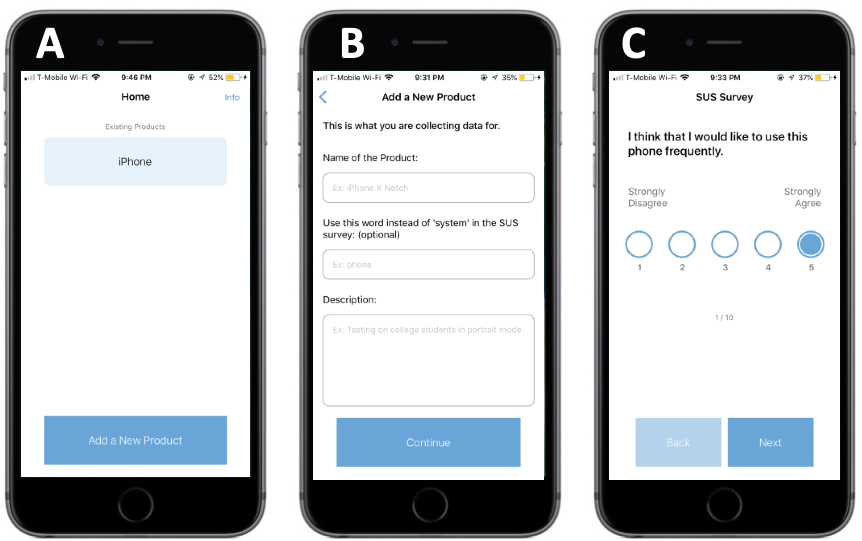
Figure 2. Screenshots for the SUSapp tool: (A) the tool can manage multiple products or tests, (B) the word “product” can be changed to the name of the system being tested, and (C) each question/statement is presented on its own screen for ease of reading, as larger font size can be used. This also makes it easier for users to step through the questions and helps ensure all questions are answered.
Upon completion of the survey, the participant is prompted to return the device to the experimenter (Figure 3D). The experimenter can then see the computed SUS score for that participant and is provided with an opportunity to enter any notes associated with that particular session that might be pertinent (Figure 3E). After saving that participant’s data, the experimenter can view the summary statistics for all participants in the study and then continue with additional participants or email the entire data set for further analysis (3F). Raw scores, as well as, full computed SUS scores for each subject, and average SUS scores for each study are pre-calculated in the saved and sent CSV data file. The data are also stored locally on the mobile platform. This close control of the data ensures that the experimenter is not dependent on network connections for data preservation, and that no data is stored in the cloud, which could represent a security risk (Yu & Wen, 2010) or HIPPA violation (Wang, Wang, Ren, & Lou, 2010). This approach is in contrast to the app developed by de Castro & Macías (2016), whose system relies on internet connections to collect and store the data. Local data control also means that once a user has downloaded the application, they are no longer dependent on the app developer for anything (e.g., maintenance of the back-end servers) in order to be able to collect or access their data.
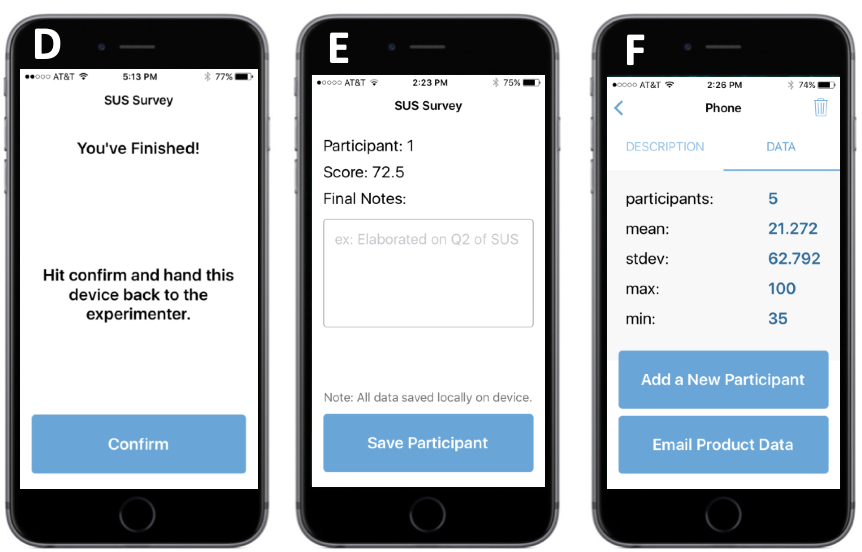
Figure 3. Screenshots for the SUSapp tool after the participant has completed the survey: (D) the tool instructs the participant to return the device to the experimenter, (E) the experimenter can add any notes regarding the experiment or session, and (F) the experimenter can see summary statistics for all participants on the test and can continue the study or have the data emailed to any address.
Usability Assessment of the SUSapp
The following sections provide details on how the SUSapp was assessed. The assessment was performed to ensure that the application was sufficiently easy to use for participants who would be rating products, services, and systems using the app.
Methods
Following the SUSapp’s development, a summative usability assessment was performed to determine if the application could be easily used by participants in a typical usability study.
Study Design
The study design was a between-subjects design with one condition: All participants used the SUSapp to evaluate a number of products. Participants evaluated numerous products using the SUSapp for the sole purpose of gaining experience using the application. The scores associated with each product were not considered data or used in the analysis because the usability of the SUSapp itself was the focus of this study. Participants rated the usability of the SUSapp using the SUS presented on SurveyMonkey, in case the usability of the application was exceptionally bad. To clarify further, we were not assessing the usability of the products participants were using, but rather, participants rated these products using SUSapp only so they could have a basis for rating the usability of the SUSapp itself.
As specified in ISO 9241-11 (ISO, 1998), usability was assessed using the measures of efficiency, effectiveness, and satisfaction, that is, the dependent variables. Efficiency is defined as the amount of time it took a participant to complete a task. The number of seconds it took for a participant to complete the SUS on SUSapp was measured, starting from when the participant selected “Start” after reading the instructions to when they hit “Confirm” after finishing the survey.
Effectiveness is defined as being able to complete a specified task. This was measured by noting whether or not a participant was able to successfully finish taking the SUS survey on the app.
Satisfaction measured the participant’s subjective impression of whether the SUSapp was usable. This was measured using the System Usability Scale (Brooke, 1996) on SurveyMonkey (we did not depend on the SUSapp for this part of the study in case the app had usability problems). The SUS yields a single score on a 100-point scale. SUS scores can be interpreted as being similar to a 100-point academic grading scale, for example, 90–100 on the SUS is comparable to an A letter grade, 80–89 is like a B, and so on (Bangor, Miller, & Kortum, 2009).
Participants
Participants were 35 Rice University undergraduates who were recruited from the university’s human subject pool. All students volunteered as participants in exchange for partial course credit; if students did not want to participate in research, they completed an alternative assignment. Of these participants, three were excluded from data analysis due to either experimenter error or equipment failure.
Twenty-six participants were female and six were male. The mean age was 19.2 years, with a range of 18 to 22 years and a standard deviation of 1.3 years. Most of the participants were Asian (53%). The others were Caucasian (22%), Hispanic (22%), and African American (3%).
The mean self-reported score for phone and tablet application experience on a scale of 1 (being a novice) to 10 (being an expert) was 6.7 (s = 1.6). The mean self-reported score for overall computer expertise on a scale of 1 (being a novice) to 10 (being an expert) was 6.1 (s = 1.6). When asked to indicate how often they use phone or tablet applications on a scale of 1 to 5, participants self-reported a mean of 4.8, where 1 is never and 5 is frequently.
While all participants were highly educated and had experience with phone or tablet applications, they are nevertheless a sample of potential future SUSapp users. In addition, this sample size was sufficient for identifying major problems with the SUSapp design (Faulkner, 2003; Macefield, 2009). If any problems were identified, the goal was to address them before release of the SUSapp on the Apple app store.
Materials
Three everyday objects were randomly presented to participants: a generic can opener, an analog alarm clock, and a temporal artery thermometer. Subjective usability evaluations of the three products were made using the SUSapp, which was installed and accessed on a mobile device (iPhone 6S). The usability of these products was not the focus of the study, so we did not assess the usability of the tasks performed with these products. Rather, participants rated the products as a means to gain experience using the SUSapp, and so that we could assess their performance while completing the SUS on the SUSapp, that is, collect efficiency and effectiveness measures. At the end of the study, participants completed the SUS with respect to their use of the SUSapp earlier in the session. Subjective usability assessments of the SUSapp were administered using SurveyMonkey on a laptop (MacBook Pro 2013). We did not use the SUSapp to evaluate itself; in case the usability of the app was so poor that it might have impacted the ratings.
Procedure
Prior to the start of the study, participants were given an Institutional Review Board (IRB) approved consent form to sign. After the consent form was signed, the experiment commenced. In order to minimize experimental bias in the form of demand characteristics, where users provide the answers they think the experimenter wants to hear (Holleran, 1991), participants were only informed that they would be taking part in a study on the usability of everyday objects. They were told that they would be using and rating three different products, but no mention was made to the participant that the true goal of the experiment was to evaluate the usability of the SUSapp (not the products) until the end of the experiment.
Participants were given a specific task to accomplish with each of the following products:
- Can Opener: Use the can-opener to open the provided can.
- Alarm Clock: Set an alarm for 9:00 a.m.
- Temporal Artery Thermometer: Take your own temperature.
Following each task, participants were asked to assess the usability of the product they had just used by using the SUS survey on the SUSapp. When participants were using the SUSapp, efficiency and effectiveness measures were collected. After all of the three tasks were completed, participants were asked to assess the usability of SUSapp by taking the SUS survey on SurveyMonkey. This allowed us to assess overall usability of the SUS app while mitigating the impact of potential demand characteristics. Finally, participants were asked to fill out a background and demographics survey. They also had the option of providing open-ended feedback about SUSapp.
Results
The following sections discuss the results of this study. These results suggest that the SUSapp is very easy for participants to use when they rate the usability of products, services, or systems.
Efficiency
The mean time it took to complete the SUS as administered on SUSapp was 36 seconds, with a standard deviation of 10 seconds and a range of 16 to 86 seconds. This is a reasonable amount of time to complete a 10-item survey and is significantly less time than the average survey completion times of 300 seconds reported for 10 question surveys in a large study of internet-based survey administrations (Chudoba, 2019).
Effectiveness
Mean completion rate of the SUS when administered via the SUSapp was 100%.
Some confusion was noted about the handoff screen, which immediately follows completion of the SUS survey. The hand off screen prompts users to hand the device back to the researcher (see Figure 3D). It was observed that participants were unsure if they were supposed to hit the confirm button or if the experimenter was supposed to perform that action. Either action is valid, and so this minor confusion did not contribute to any failures in completion of the SUS survey by the participants.
Satisfaction
For satisfaction, as measured by the System Usability Scale (SUS), the mean was 90.8 (out of 100), with a standard deviation of 7.3 and a range of 72.5 to 100. This score corresponds to an “A” on the University Grading Scale developed and validated by Bangor, Kortum, and Miller (2009) to help interpret SUS scores. The SUS score of 90.8 also corresponds to an adjective rating between “excellent” and “best imaginable” on the adjective rating scale, which also can be used to make sense of SUS scores (Bangor et al., 2009). These results suggest that the SUSapp is perceived as highly usable.
Discussion and Conclusions
Through the examination of efficiency, effectiveness, and satisfaction measures, the data have shown that participants are able to use the SUSapp to complete the SUS on an iPhone in a reasonable amount of time. In addition, participants are satisfied with the usability of the app. For these reasons, one can conclude that the SUSapp is a usable application.
There are a few limitations to this study. First, this study was focused on the assessment of usability from the viewpoint of the participant, who must take the survey, because this is of paramount concern for the administration of usability assessments. While every attempt was made to ensure the usability of the SUSapp for the researcher, future assessment will need to examine the usability of setting up the app by the experimenter. While we did consider SUS administrators as users when designing the application, future work should more deeply assess the application from experimenter’s perspective in order to identify problems that might arise from that use case. The study was also limited because the participants of this study consisted of healthy, well-educated, young undergraduate students. In the field, this may often not be the case. Nonetheless, undergraduates are prospective SUSapp users. This issue can be addressed in future research to further improve the SUSapp. We also encourage researchers and practitioners to help us continue to improve the application by reporting any issues through GitHub (https://github.com/jeffreyxiong/sus-app/).
Overall, we believe that the SUSapp is a viable alternative for administering the SUS in the field and laboratory. The mobile platform presentation and calculation of final SUS scores provides a distinct advantage over existing options. Because the SUSapp utilizes a ubiquitous mobile platform and eliminates scoring errors, we believe that it might have the potential to improve the efficiency and workflow of usability practitioners as they collect usability data.
Tips for Usability Practitioners
The following tips can help you determine if the SUSapp is appropriate for your study:
- Use the SUSapp as a convenient platform for gathering SUS data in the field and laboratory; the SUSapp is free and can be administered on a ubiquitous mobile platform.
- Use the SUSapp to eliminate transcription errors that are often encountered when using the paper form of the SUS. When the SUSapp is used, the data input by the participant is compiled into a single spreadsheet for each study.
- Use the SUSapp to eliminate scoring errors on the SUS that can occur with paper and web-based survey tools, as scores are automatically calculated within the final datasheet.
Acknowledgements
We would like to thank Ian Robertson for helping with the testing of the SUSapp and for suggesting improvements throughout the development process. We would also like to thank John Brooke for making the SUS freely available to the usability community.
References
Bangor, A., Kortum, P. T., & Miller, J. T. (2008). An empirical evaluation of the system usability scale. International Journal of Human–Computer Interaction, 24(6), 574–594.
Bangor, A., Kortum, P., & Miller, J. (2009). Determining what individual SUS scores mean: Adding an adjective rating scale. Journal of Usability Studies, 4(3), 114–123.
Brooke, J. (1996). SUS: A ‘quick and dirty’ usability scale. In P. Jordan, B. Thomas, & B. Weerdmeester (Eds.), Usability evaluation in industry (pp. 189–194). Taylor & Francis.
Brooke, J. (2013). SUS: A retrospective. Journal of Usability Studies, 8(2), 29–40.
Chudoba, B. (2019). How much time are respondents willing to spend on your survey? Retrieved from https://www.surveymonkey.com/curiosity/survey_completion_times/
Comscore (2017). U.S. Smartphone Penetration Surpassed 80 Percent in 2016. Retrieved from https://www.comscore.com/Insights/Blog/US-Smartphone-Penetration-Surpassed-80-Percent-in-2016
Cronbach, L. J. (1950). Further evidence on response sets and test design. Educational and Psychological Measurement, 10(1), 3–31.
Davidov, E., & Depner, F. (2011). Testing for measurement equivalence of human values across online and paper-and-pencil surveys. Quality & Quantity, 45(2), 375–390.
de Castro, A., & Macías, J. A. (2016). SUSApp: A mobile app for measuring and comparing questionnaire-based usability assessments. In Proceedings of the XVII International Conference on Human Computer Interaction (19–26). ACM.
Dodou, D., & de Winter, J. C. (2014). Social desirability is the same in offline, online, and paper surveys: A meta-analysis. Computers in Human Behavior, 36, 487–495.
Faulkner, L. (2003). Beyond the five-user assumption: Benefits of increased sample sizes in usability testing. Behavior Research Methods, Instruments, & Computers, 35(3), 379–383.
Finstad, K. (2006). The system usability scale and non-native English speakers. Journal of Usability Studies, 1(4), 185–188.
Holleran, P. A. (1991). A methodological note on pitfalls in usability testing. Behaviour & Information Technology, 10(5), 345–357.
International Standards Organization (1998). ISO 9241-11: Ergonomic requirements for office work with visual display terminals (VDTs) – Part 11 Guidance on usability
Kam, C. C. S., & Fan, X. (2018). Investigating response heterogeneity in the context of positively and negatively worded items by using factor mixture modeling. Organizational Research Methods, 23(2), 322–341. doi: 1094428118790371.
Macefield, R. (2009). How to specify the participant group size for usability studies: A practitioner’s guide. Journal of Usability Studies, 5(1), 34–45.
Morgan, K. (2019). Are people completing surveys on mobile devices? Retrieved from https://www.surveymonkey.com/curiosity/are-people-completing-surveys-on-mobile-devices/
Sauro, J. (2011). A Practical Guide to The System Usability Scale. Measuring Usability LLC.
Sauro, J. (2018) SUS calculator. Available at https://measuringu.com/product/suscalc/
Sauro, J., & Lewis, J. R. (2011). When designing usability questionnaires, does it hurt to be positive? In Proceedings of the SIGCHI Conference on Human Factors in Computing Systems (pp. 2215–2224). ACM.
Schriesheim, C. A., & Hill, K. D. (1981). Controlling acquiescence response bias by item reversals: The effect on questionnaire validity. Educational and Psychological Measurement, 41(4), 1101–1114.
Tullis, T., & Albert, B. (2018). Measuring the user experience: A companion website to the book. Calculating a System Usability Scale (SUS) Score. Available at http://measuringux.com.
Wang, C., Wang, Q., Ren, K., & Lou, W. (2010). Privacy-preserving public auditing for data storage security in cloud computing. In Proceedings IEEE Infocom 2010 (pp. 1–9). IEEE.
Yu, X., & Wen, Q. (2010). A view about cloud data security from data life cycle. In 2010 International Conference Computational Intelligence and Software Engineering (CiSE) (pp. 1–4). IEEE.