
See commentary related to this article.
Abstract
Using secondary literature, this article helps practitioners to specify the participant group size for a usability study. It is also designed to help practitioners understand and articulate the basis, risks, and implications associated with any specification. It is designed to be accessible to the typical practitioner and covers those study scenarios that are common in commercial contexts.
Practitioner’s Take Away
The following were the main findings in this article:
- For a wide variety of reasons, specification of the participant group size for a usability study remains a matter of opinion and debate.
- The goal for usability practitioners is to help negotiate a group size that is optimal, or at least beneficial, for the wider project in which the study is taking place. This means that practitioners should be able to articulate the basis, risks, and implications associated with any specification.
- When utilizing research literature in this area, practitioners should carefully consider how well the specific studies underpinning the particular research relates to the study under consideration. Similarly, they should pay careful attention to any caveats in the advice being offered.
- There is no “one size fits all” solution to the challenge here. However, for studies related to problem discovery a group size of 3-20 participants is typically valid, with 5-10 participants being a sensible baseline range. In these scenarios, the group size should typically be increased along with the study’s complexity and the criticality of its context. In scenarios concerned with discovering severe (“show stopping”) problems in early conceptual prototypes a group size of five participants is typically valid. For comparative studies where statically significant findings are being sought, a group size of 8-25 participants is typically valid, with 10-12 participants being a sensible baseline range.
- In many scenarios, it can be beneficial to split study groups into chunks of participants within a punctuated study, whereby the results data is incrementally analyzed after each chunk. One benefit of this tactic is that a study can be terminated early if its objectives have already been met, thereby saving project resources. For example, a comparative study may be terminated early because it has already produced the statistically significant findings being sought. Another benefit of this tactic is that it promotes the iterative design processes that are fundamental to a UCD philosophy. For example, in a study of an early conceptual prototype, one chunk of participants revealed a show stopping problem. After the interface design was revised, the study continued.
Introduction
Specifying the participant group size for a usability study is the source of recurrent and hot debate amongst study teams and related stakeholders. In commercial environments this debate is typically driven by the tension that exists whereby increasing the group size increases the study’s reliability but simultaneously increases its cost and duration.
In these contexts, the goal for usability practitioners is to specify a group size that is optimal for the wider project in which the study takes place. This means being able to inform other project stakeholders of the basis, risks, and implications associated with any specification.
A significant body of research literature exists that ostensibly might aid practitioners in achieving this goal; however, it seems to this author that there are two significant issues with this literature.
First, much of this literature involves discussion of quite advanced statistical methods. Further, much of it discusses the relative merits of different statistical methods and thinking in its ability to better determine optimal group sizes (e.g., Caulton, 2001; Lewis, 2001; Turner, Lewis, & Nielson, 2006). Unfortunately, whilst this literate emanates from within our own discipline and is also vital to underpinning much of our work, it is simply impenetrable to many practitioners. This is mainly because this literature generally emanates from usability researchers operating in (quasi) academic environments, and who have extensive grounding in research methods and statistics. By contrast, most usability studies are conducted by usability practitionersoperating in commercial environments and who typically have a more limited grounding in research methods and statistics.
Second, this literature focuses almost exclusively on problem discovery in interfaces. However, problem discovery is not always the (primary) objective in usability studies. For example, we often run studies to compare two or more interfaces, typically referred to as A-B or multivariate testing, with the intent of pragmatically implementing the interface found to have the best overall usability. In these scenarios, problem discovery may be only a byproduct; indeed, we may even be indifferent to how many problems each interface contains or the nature of these problems.
The result is that all too often practitioners accept popular advice on this matter without being (fully) aware of where and how this advice should be applied, and that it is subject to a range of qualifications, even though these may be clearly stated in the literature.
Discussion
The Broad Issues
When specifying the participant group size for a usability study it is important that we understand the broad issues related to this challenge.
Tensions in commercial contexts
In most commercial contexts there is an inescapable tension in study design between the desire for (more) reliable findings and the budget and time required for a study. Further, commercial practitioners must simply accept that we do not operate in an ideal world and that most study designs will be ultimately constrained by organizational or project realities.
Given this, our goal is not to be parochial advocates fighting for studies that have maximum reliability, whatever the cost. Rather, it should be to work with other stakeholders to reach a study design that is realistic and optimal for the project as a whole, or at least has some benefit to the wider project. This is challenging, not least because authority figures in our discipline have widely differing views as to the degree to which study reliability can (or should) be compromised for the “wider good” and the useful limits of this compromise.
For example, Nielsen (1993) argues that “for usability engineering purposes, one often needs to draw important conclusions on the basis of fairly unreliable data, and one should certainly do so since some data is better than no data” (p. 166). However, others (e.g., Woolrych & Cockton, 2001) may question the wisdom of this advice; they may argue that it is invalid to draw any conclusions from a study that lacks reliability.
Application of research literature
There are different types of usability studies and, similarly, studies take place in a wide variety of contexts. This means that we must be careful when applying any particular research based advice. Similarly, we must be aware that any numeric values presented in this advice are generally means subject to a margin of error and confidence level.
For example, the popular “headline” advice in Nielsen (2000) is that a usability study with five participants will discover over 80% of the problems with an interface, but this does not mean that any one particular study will achieve this figure. To explain, this advice is based on a study by Virzi (1992) and Nielsen (1993). In this study 100 groups of five participants were used to discover problems with an interface. The study did indeed find that the mean percentage of problems discovered across all 100 groups was about 85%. However, this figure has 95% confidence level and a margin of error of ±18.5%. This means that for any one particular group of five there is a 95% chance that the percentage of problems discovered will be in the range of 66.5%-100% and, indeed, some groups of five did identify (virtually) all of the problems; however, one group of five discovered only 55% of the problems.
Similarly, it is understandable that some usability practitioners perceive statistics to be more positivist in nature than is actually the case. In reality, statistics are not free from opinion and often rely on questionable assumptions (e.g., Grosvenor, 1999; Woolrych & Cockton, 2001). Therefore, different statistical methods and associated thinking can easily lead to different conclusions being drawn from the same set of research data.
In summary, usability practitioners should not simply accept and generally apply “headline” figures for participant groups sizes quoted in research articles without question or inquisition.
Studies Related to Problem Discovery
Many commercial usability studies are concerned with problem discovery in interfaces and here practitioners need to keep in mind two important and interrelated facts.
First, unlike widgets and people, it is not always easy to objectively define and/or identify a problem. This is primarily because, as pointed out by Caulton (2001), problems are a function of the interaction and do not necessarily constitute a static feature of the interface. So a feature of the system may constitute a problem for one user but not another and, similarly, it may constitute a problem for a user on one day but not the next. Problems also arise from rich and complex interrelationships between features so it is not always easy to “pin them down.” In summary, problems with interfaces are often fuzzy and subjective in nature. Indeed, these properties of problems are one reason why there is so much controversy as to what statistical methods and thinking best applies to these studies.
Second, an important goal of these studies is typically to rank the severity of problems. Put another way, simple enumeration of problems (and analysis on that basis) would not typically be a useful exercise within these studies. Yet such ranking is an issue that is not well addressed in current research literature (although it is often mentioned e.g., Faulkner, 2003). A possible reason for this is that ranking problems is complex and highly subjective matter. There may even be disagreement within a study team as to what mechanism and heuristics should be used to rank problems. Similarly, practitioners often disagree as to whether a feature of the system constitutes a problem at all.
Problem discovery level and context criticality
Table 1 is an abstract from Faulkner (2003) showing how, based on a large number of studies, various participant group sizes (“No. Users” column) probably influences the problem discovery level that a study will achieve. If we accept this advice we can simply specify the group size according to the probable mean and/or minimum level of problem discovery we are seeking.
Table 1. Abstract from Faulkner (2003)
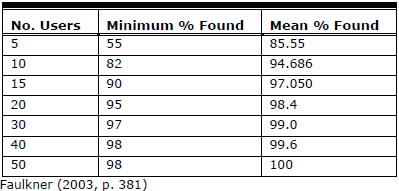
This leaves the challenge of how to determine what problem discovery level is appropriate for a particular study. There are some factors to aid us in meeting this challenge; we can easily argue that high(er) problem detection levels are desirable in the following contexts:
- work in highly secure environments e.g., the military
- work involving safety critical applications e.g., air traffic control and the emergency services
- where the socio-economic or political stakes are high e.g., with governmental applications
- work with enterprise critical applications where the financial stakes are high e.g., on-line banking and major e-commerce systems
- when a previous study, using a small(er) participant group size, has yielded suspect or inconclusive results
- In conjunction with these factors, we should also carefully consider the implications of undiscovered problems remaining in the interface after the study, and what opportunities there will be to fix these later in the system development lifecycle (SDLC).
- To summarize here, the optimal group size depends greatly on what problem discovery level we are seeking and, in turn, this should be driven by the study’s context.
Complexity of the study
Another key reason why we must be careful not to over generalize advice concerning study group sizes relates to the complexity of a study. For example, Hudson (2001) and Spool and Schroeder (2001) have criticized the advice in Nielsen (2000) that five participants is optimal for these studies because this advice is underpinned by relatively simple studies utilizing quite closed/specific tasks. By contract, Spool and Schroeder (2001) conducted more complex studies, utilizing very open tasks, and found that five participants would probably discover only 35% of the problems in an interface. Similarly, Caulton (2001) and Woolrych and Cockton (2001) attacked Nielsen’s advice on the basis that he had grossly underestimated the impact of variation across individual participants within a particular study.
Taking this into account, it is argued here that the optimal group size should be influenced by the study’s complexity, with larger numbers of participants being required for more complex studies.
This leads us to the challenge of assessing a study’s complexity and, again, there are factors to aid us here. It is easy to argue that a study’s complexity typically increases along with increases in the following factors:
- scope of the system(s) being used
- complexity of the system(s) being used
- (potential) pervasiveness of the system
- scope, complexity, and openness of the tasks(s) being performed
- number and complexity of the metrics being used
- degree of diversity across the facilitators being used
- (potential) degree of diversity across the target user group
- degree of diversity across the study participants
- degree of potential for contaminating experimental effects in the study
- degree to which the study participants reflect the target user group, particularly in terms of what relevant knowledge they will bring to the interactions
Another key factor here is the nature and volume of any training that the target user group would be given on the system, and which must then be reflected in the study design. Studies requiring such training are common with many non-pervasive systems (e.g., call centre applications or accounting systems) and this has the potential to increase a study’s complexity because any variation in the training input can easily become a contaminating experimental effect. On the other hand, if the training input is consistent and well reflects the training actually used for the target users, we can argue that this decreases complexity because the study participants should well reflect the target users in terms of what relevant knowledge they will bring to the interactions.
These factors can also be used as criteria to help determine the relevance of particular research literature i.e., it is preferable that practitioners are informed by literature underpinned by studies that have similar (levels of) complexity to that they are designing.
To summarize here, there is no “one size fits all” figure for the optimal group size for usability studies related to problem discovery. Rather, this should be influenced by the study’s context and complexity. Further, practitioners should accept these studies will inevitably involve a degree of subjectivity and that any numeric values that result are indicative. Similarly, they should view these studies as being formative and diagnostic exercises rather than (quasi) experiments designed to give objective answers. Indeed, it could be argued that the considerable volume of research literature that seeks to apply statistical methods to this type of study is not as important as some might think; particularly given that this literature has (understandable) little to offer as to how statistical methods might account for problem of differing severity.
However, there is the following advice from the research community that is useful to consider here:
- At the low end of the range, Virzi (1992) argued that the optimal group size in terms of commercial cost-benefits may be as low as three participants. At the high end, Perfetti and Landesman (2002) argued that 20 participants are appropriate for many commercial studies.
- As already pointed out in this article, the popular advice from Nielsen and Landauer (1993) and Nielsen (2000) is that five participants will probably discover 80% of the problems and, although this advice has been criticized because it was underpinned by relatively simple studies, it remains valid because, even if this criticism is accepted, there are plenty of commercial usability studies that are also relatively simple in nature.
- Research by Faulkner (2003) found that a group size of 10 participants will probably reveal a minimum of 82% of the problems. This is an attractive minimum figure but we should keep in mind that this research was also underpinned by relatively simple studies.
- The research by Turner et al. (2006) imply that a group size of seven participants may be optimal, even where the study is quite complex in nature.
Studies related to problem discovery in early conceptual prototypes
Usability practitioners often need to study novel interface design concepts. These range from new types of control to whole new interface paradigms. Most of these studies involve an early conceptual prototype and are worthy of special consideration here for the following reasons:
These studies are typically interested primarily in discovering severe usability problems (“show stoppers”) at an early stage so that we do not waste resources refining design concepts that are ultimately unviable.
Because the conceptual prototypes are produced early in the SDLC, they are more likely to contain errors than would be the case with more mature prototypes or working systems. These may be technical errors (bugs) or articulator errors (the way in which a concept works).
Interfaces exploiting novel design concepts typically present significantly greater usability challenges for users than is the case for more conventional interface designs. This is because the novelty, by its very nature, limits the usefulness of any existing (tacit) knowledge that the user has of operating interfaces (e.g., Macefield, 2005, 2007; Raskin, 1994; Sasse, 1993, 1997).
Given this, it is easy to argue that these prototypes are likely to contain more (severe) usability problems than systems exploiting more conventional interface design concepts. In turn, it is easy to argue that this significantly increases the likelihood that fewer study participants will be required to discover these problems. Therefore, we can argue that with studies involving early conceptual prototypes, the degree of novelty is inversely proportional to the number of participants that are likely to be required.
Another factor that drives the optimal group size for this type of study towards the lower end of the range is that early conceptual prototypes are typically quite low fidelity and very limited in scope. This is primarily to mitigate the risk of expending resources on developing unviable design concepts. As a consequence, these prototypes are typically capable of supporting only simple/constrained tasks. As such, it is easy to argue that these studies are often relatively simple in nature and, therefore, it is easy to argue that the advice from e.g., Nielsen (2000) to use small study group sizes is particularly relevant here (because Nielsen’s advice is underpinned by relatively simple studies).
To summaries here, it is easy to argue that for most studies related to problem discovery a group size of 3-20 participants is valid, with 5-10 participants being a sensible baseline range, and that the group size should be increased along with the study’s complexity and the criticality of its context. In the case of studies related to problem discovery in early conceptual prototypes, there are typically factors that drive the optimal group size towards the lower end of this range.
Comparative Studies
Usability practitioners often run studies to compare the usability of two or more interfaces. A typical example of this in commercial contexts is where we have an existing interface (A) and are proposing some changes to improve its performance. Therefore we produce a new interface design (B) and run a study to compare the usability of A and B.
In contrast to studies relating to problem discovery, these studies are primarily summative because they utilize metrics, such as task completion rates and time on task, that are ostensibly numeric, highly objective, easy to define, and easy to measure. In turn, this makes the results of such studies well suited to analysis with established statistical methods. Similarly, these studies are often definitive exercises with their finding representing “moments of truth” that form a basis of important commercial decisions e.g., deciding whether or not to implement a new interface design for an e-commerce system.
Of course, this means that we want to be reasonably confident that any such study is reliable. In turn, this often means that we want the study to produce (at least some) findings that are statistically significant. Further, leading organizations are increasing their reliance on statistically significant data within their business decision making processes (e.g., McKean, 1999; Pyzdek, 2003).
To explain how we might design studies to meet this challenge it is necessary to first consider this type of study in statistical terms.
Although comparative usability studies rarely satisfy the criteria for a true scientific experiment they are essentially a hypothesis test. So, using the above example, we hypothesize that interface B will perform better than interface A, and run a study to find evidence of thiseffect. Suppose then that the results of our study indicate this effect to be present because the mean time on task and completion rates are better for the participants using interface B.
However, before we can draw any conclusions from this study we must be reasonably sure that it is safe to reject the null hypothesis. This term means that there is actually no effect to be found and that any difference between the study groups occurred purely by chance and because the study participants are only a sample of the wider population who will use the system. So, with this example, before we conclude that interface B is better than interface A, we must be reasonably sure that the participants using interface B did not just happen to be better at operating our system than those using interface A (e.g., because they just happened to be more intelligent).
In keeping with early discussions of statistical concepts in this article, we can never be 100% sure that it is safe to reject the null hypothesis for any study that uses sampling (which is virtually all studies). Rather, statistical analysis of study data provides a probability that the null hypothesis can safely be rejected, where the level of this probability is expressed in terms of a significance level or p-value that the observed results are due to chance. (This is a similar concept to that of confidence level.) Further, for findings to be considered statistically significant, this significance level needs to be <=10% (p=<0.1) and preferably <=5% (p=<0.05).
The significance level of the findings is determined by the following two factors:
- The observed effect size, which has two elements: the difference between the mean of the results for each group and the degree of variation across the results (often expressed in term of the standard deviation). As the observed effect size increases so does the significance level.
- The sample size, which is the number of participants in each study group. Again, as the sample size increases so does the significance level.
Of course, we cannot know the effect size until the study has actually been run. This means that the only factor we can change in a study design is the sample size—hence we return to the challenge of how to specify the group size for these studies.
One approach is to run an open-ended study whereby we increment the number of participants in a group until one of the following three conditions arises:
- The resulting data move into the range of statistical significance.
- It can reasonably be concluded that increasing the number of participants will never produce a statistically significant effect i.e., there is no effect to be found. So, with our example here, we would conclude that there is no significant performance difference across the two interfaces.
- Continuing with the study is no longer a viable option, typically due to budget or time constraints.
In academic contexts this approach is widespread; however, it is unviable in many commercial scenarios because the study needs to be time-boxed and budgeted within a wider project plan.
This leads us to the problem of how we specify a fixed group size for a study when we are seeking statistically significant findings. One approach is to specify a very large group size that is highly likely to produce some statistically significant findings if there is any effect to be found. With this approach, it may be possible to reclaim some of the study time and costs by terminating it early if and when the findings move into the range of significance. However, in many commercial environments time and budget constraints mean that such grandiose studies are not a viable proposition.
Therefore, the typical challenge here is to specify a group size that has a reasonable likelihood of producing statistically significant findings whilst minimizing the amount of time and cost that is “wasted” generating redundant data. To help us meet this challenge it is first necessary to consider some additional statistical concepts.
Hypothesis tests can fail due to the following two types of errors:
- A type I error occurs when the null hypothesis is rejected when it is in fact true i.e., the test produces a false positive.
- A type II error occurs when the null hypothesis is retained when in fact it should be rejected i.e., the effect is present but has not been detected by the test.
Of course, a type 2 error is a terrible outcome for the study team because an important effect may have been missed. This is why we should calculate the power of the statistical test proposed within the study design. This power is the probability that it will avoid a type 2 error and it is influenced by the following factors:
- the effect size
- the sample size
- the significance level
Power analysis can be performed after a test has been performed using the actual study data, when this is known as post hoc power testing. Perhaps more usefully, it can also be performed before the test using results data from pilot studies or previous studies that are similar in nature, when this known as priori power testing. In this case, it can be used to predict both the minimum sample size required to produce statistical significant findings and the minimum effect size that is likely to be detected by a test using a given sample size.
Fortunately for usability practitioners, researchers in our discipline have already performed power analyses on many (sets of) studies in order to advise us as to what sample sizes for comparative studies are likely to produce (at least some) statistically significant findings. The following are prime examples of such research:
- Based on extensive primary research conducted by Landauer (1988), Nielsen and Landauer (1993) found that statistically significant findings are unlikely to be produced by a study group of less than eight participants, and it is this research that underpins the advice in the common industry format for usability test reports (CIF v2.02, 2002) to use a minimum group size (segment) of eight participants. This research also showed that a study utilizing 25 participants per group was quite likely to produce statistically significant findings.
- Within this range, Spyridakis and Fisher (1992) found that a study group size of 10-12 participants will often produce statistically significant findings.
- This figure of 10-12 participants is in broad accordance with the advice of Rubin (1994) and Faulkner (2003).
To summaries here, specification of the study group size when statistically significant findings are being sought is also an arbitrary process. The decision here will be influenced primarily by how likely we want it to be that the study’s findings will be statistically significant. In turn, this will again be influenced by the wider context for the study. However, we do have some useful advice from the research community that a study utilizing 8-25 participants per group is a sensible range to consider and that 10-12 participants is probably a good baseline range.
In addition to this, it is important that usability practitioners understand the difference between findings that are statistically significant and those that are meaningful. Findings that are not meaningful sometime occur with studies utilizing larger sample sizes, whereby the effect size is relatively small although it may still be statistically significant. To use our example here, suppose our two interface designs were compared using a study with two groups of 100 participants, and it was found that the task completion rate for interfaces A and B was identical whilst the time on task was 2% less for the new interface (B), and that this finding was statistically significant. Despite its statistical significance this finding would not typically be meaningful because the performance increase is too small to be of any interest or importance.
(A useful summary of the statistical concept discussion in this section can be found in Trochim, 2006.)
Punctuated Studies
For all of the types of usability studies discussed so far in this article, we can sometimes gain benefits by studying the participants in (predetermined) chunks punctuated by time slots for incrementally analyzing the data from each chunk. For example, suppose a study is concerned with problem discovery in a new interface design and we have specified a group size of 12 participants. We could break this group into three chunks of four participants and execute the study according to the following plan:
- Day 1: Testing with chunk one participants.
- Day 2: Analysis and discussion of chunk one results.
- Day 3: Testing with chunk two participants.
- Day 4: Analysis and discussion of chunk two results.
- Day 5: Testing with chunk three participants.
- Day 6: Analysis and discussion of chunk three results.
Suppose also that analysis of findings from chunk one reveals a severe problem with a new interface design. We could terminate the study at this point and possibly rectify the problem before continuing with the following chunks so that the interface design is evolved during its own study.
This tactic can lead to considerable cost and time savings but, perhaps more importantly, it is easy to see how with formative studies it promotes the idea of iterative design processes that are fundamental to a user-centered design (UCD) philosophy.
We can also gain benefits by designing punctuated studies with asymmetric chunks. This can be particularly useful in the case of comparative studies where we are seeking statistically significant findings. We could begin with a chunk of 10 participants (which may well meet our objectives) followed by three further chunks of five participants, which could be incrementally utilized if required.
In summary, although the logistics of punctuated studies are a little more complex and can potentially consume a little more resources than unpunctuated studies, punctuated studies have the potential to both significantly reduce the resources required for a study and promote a UCD approach. (It is worth noting here that usability agencies may be resistant to such designs because their businesses are easier to manage if studies have a fixed cost and duration.)
Summary
This article argues that specification of the participant group size for a usability study remains a matter for debate and should be influenced by the unique features and context of each particular study. Within these caveats, the advice presented in this article is summarized in Figure 1. This figure shows typical ranges of group size for the two common types of usability study discussed in this article. The solid areas may be considered as baseline ranges applicable to typical scenarios. The figure also shows how common drivers may influence the group size specification for these types of study.
Figure 1. Advice summary
Acknowledgements
I thank the following usability practitioners for their excellent feedback and suggestions when authoring this article:
- Alan Trow-Poole, User-experience and Information Architect, The Icon Studio, U.K.
- Lucy Carruthers, Senior Usability Consultant, Foviance, U.K.
- Chris Rouke, Managing Director, UserVision, U.K.
- The editor in chief and reviewers of this article at JUS
Commentary
See commentary related to this article.
References
Caulton, D.A. (2001). Relaxing the homogeneity assumption in usability testing. Behaviour & Information Technology, 20, 1-7.
CIF v2.02 (2002). Common industry format for usability test reports. Retrieved June 8, 2002 from: http://zing.ncsl.nist.gov/iusr/overview.html
Faulkner, L. (2003). Beyond the five-user assumption: Benefits of increased sample sizes in usability testing. Behavior Research Methods, Instruments and Computers, 35(3), 379-383.
Grosvenor, L. (1999). Software usability: challenging the myths and assumptions in an emerging field. Unpublished master’s thesis, University of Texas, Austin.
Hudson, W. (2001, May/June). How many users does it take to change a website? SIGCHI Bulletin. Retrieved October 18, 2009 from http://www.syntagm.co.uk/design/articles/howmany.htm
Macefield, R. C. P. (2005). Conceptual models and usability. In Ghaoui, C. (Ed), Encyclopedia of Human Computer Interaction (pp. 112-119). Texas: Idea Group Inc.
McKean, J. (1999). Information masters: Secrets of the customer race. Chichester, England: John Wiley & Sons Ltd.
Nielsen (2000, March). Why you only need to test with 5 users. Retrieved February 22, 2009 from www.useit.com/alertbox/20000319.html
Nielsen, J., & Landauer, T. K. (1993). A mathematical model of the finding of usability problems. In Proceedings of: ACM INTERCHI’93 Conference (pp. 206-213). Amsterdam, the Netherlands: ACM.
Perfetti, C., & Landesman, L. (2001, June). Eight is not enough. Retrieved March 3, 2009 from http://www.uie.com/articles/eight_is_not_enough
Pyzdek, T. (2003). The six sigma handbook, 2nd ed. New York: McGraw-Hill.
Raskin, J. (1994, September). Intuitive equals familiar. Communications of the ACM, 37 (9), 17.
Rubin, J. (1994). Handbook of usability testing: How to plan, design and conduct effective tests. New York: John Wiley & Sons.
Sasse, M. A. (1992). User’s mental models of computer systems. In Rogers, Y., Rutherford, A., & Bibby, P. (Eds.), Models in the mind: theory, perspective, and application (pp. 226-227). London: Academic Press.
Sasse, M. A. (1997). Eliciting and describing users’ models of computer systems. PhD Thesis. Birmingham University, UK.
Spool, J., & Schroeder, W. (2001). Testing web sites: Five users is nowhere near enough In CHI 2001 Extended Abstracts, (pp. 285-286). New York: ACM Press.
Spyridakis, J. H., & Fisher, J. R. (1992). Usability testing in technical communication: The application of true experimental designs (pp. 469-72), Technical Communication, (part 4).
Trochim, W. (2006). Statistical Power. Retrieved October 19, 2009 from www.socialresearchmethods.net/kb/power.php
Turner, C. W., Lewis J. R., & Nielsen, J. (2006). Determining usability test sample size. In Karwowski, W. & Raton, B., (Eds.), International Encyclopedia of ergonomics and human factors, Second Edition, Vol. 3.
Virzi, R. A. (1992). Refining the test phase of usability evaluation: How many subjects is enough? Human Factors, 34, 457-468.
Woolrych, A., & Cockton, G. (2001). Why and when five test users aren’t enough. In J. Vanderdonckt, A. Blandford, & A. Derycke (Eds.) In Proceedings of IHM-HCI 2001 Conference: Vol. 2, (pp. 105- 108). Toulouse, France: Cépadèus.