
Abstract
If, as UX professionals, we measure the user experience of a product with a questionnaire, then scale reliability is important. If the scales of the questionnaire show low reliability, we cannot guarantee stable measurements and should not base important design decisions on such data. There are several methods available to estimate the reliability of a scale. But nearly all UX questionnaires use Cronbach’s Alpha as an indicator for scale reliability, even though this coefficient is not so easy to interpret. Several general methodical concerns and problems regarding the interpretation of Alpha are known. But these concerns are mainly discussed in highly technical publications concerning measurement theory and seem to be widely unknown by UX practitioners. In this paper, I show that there are some UX specific issues to use Cronbach’s Alpha as a measure for scale reliability. I discuss five problematic points concerning the usage of Alpha that can easily cause misinterpretations of data in practical applications and validation studies of UX questionnaires. This paper should help UX practitioners to better interpret the Alpha values published in papers describing the application and construction of UX questionnaires.
Keywords
questionnaire, user experience, reliability, Cronbach Alpha
Introduction
If, as UX professionals, we base decisions on some numerical measure or test, then the reliability of this measure is quite important. If we measure the intended quality twice, we expect to get (with some small random fluctuations) nearly the same result. If this is not the case, that is, if the results of two independent measurements differ heavily, we cannot trust the measurement method, and it is not wise to base any important decisions on the results.
This idea is captured in the concept of reliability. A test score is reliable if a repeated measurement under the same conditions yields the same result (Lienert, 1989). Thus, if we measure user experience (in the following abbreviated as UX) of a product two times with an identical target group, then we expect nearly the same scores for the scales of the questionnaire.
Thus, if we select a UX questionnaire to evaluate a product, we are of course interested in the reliability of the scales. On the other hand, developers of new UX questionnaires are interested to report results concerning the reliability of their scales in an easy to consume form. A quite common method to report scale reliability is the Alpha coefficient (Cronbach, 1951), which is easy to compute and easy to communicate.
However, there are some methodological issues that often cause misinterpretations of Alpha. These issues are typically discussed in highly technical methodological papers. As several authors (for example, Cortina, 1993) have stated, these concerns have not reached researchers in psychology or other social sciences, where Alpha is used as a standard method to report reliability. I summarize the most important general concerns towards Alpha in this paper. In addition, I show that in the case of UX questionnaires there are some special issues with the interpretation of Alpha.
How Is Reliability of a Scale Defined?
So how can the intuitive concept of reliability be formalized? There is a definition in classical test theory that is generally accepted. The basic assumption underlying this definition is that a measured score of a scale “O” (average of all items in the scale) results from the true score in the population under the influence of some random sampling or response errors, that is, O = T + E, where “O” is the observed scale score, “T” the true scale score in the population, and “E” some random variable representing measurement errors.
The reliability of a scale score (in my case the scale in a UX questionnaire) is then defined as the product moment correlation between “X” and the score of a parallel scale “Y.” A parallel scale is a scale that produces the same “true” score and the same variance of the observed scores (this represents the idea of a repeated measurement with the same scale).
This is a quite intuitive formulization of reliability. But, practically, there is a problem. There are, in practice, no parallel scales available. Thus, reliability cannot be calculated directly based on this definition. In addition, reliability in the sense of the definition above cannot be calculated based on one single application of a test scale.
But it is possible to use the test results to estimate a lower bound for the scale reliability (Sijtsma, 2009). Cronbach’s Alpha coefficient α (Cronbach, 1951) is such a lower bound for the reliability, that is, Rel(O) >= α.
The standardized Cronbach α coefficient is defined as the following:
![\[ a=\frac{n*\bar{r}}{(1+(n-1)*\bar{r})} \]](http://uxpajournal.org/wp-content/ql-cache/quicklatex.com-10da97b6cf9c3e82753d22146c40f160_l3.png "Rendered by QuickLaTeX.com")
Where  is the mean correlation of all n items from the scale. Theoretically α ranges from -∞ to 1, but with the exception of unrealistic cases where the mean correlation between all items of a scale is negative, the value will be between 0 and 1.
There is also an unstandardized variant of the coefficient, which is calculated based on the covariance matrix of the items. However, in this paper I concentrate on the standardized coefficient because this is the variant used in nearly all publications on UX questionnaires. Please note that both variants can differ for a concrete data set. The two variants are identical only under quite restrictive assumptions concerning the data (Falk & Savalei, 2011).
Standardized Cronbach’s α can be easily computed. It does not require two data collections, as for example reliability concepts based on the paradigm of retest-reliability (e.g., Horst, 1966). This and the simple idea behind the coefficient made it quite popular as a measure reported by questionnaire developers and researchers in many fields. In applications of a questionnaire the value is reported to show that a scale showed a “sufficient reliability” or “internal consistency” for the product under investigation and can thus be interpreted.
However, it is not so easy to interpret the α coefficient correctly, and there is also a remarkable number of misconceptions about the meaning of α that can be found in research papers. Even the inventor of the Alpha coefficient himself was not so happy about the usage of his coefficient in psychological practice in a paper (Cronbach, 2004) published more than 50 years after his first publication concerning Alpha (Cronbach, 1951).
In addition, UX questionnaires differ from traditional psychological questionnaires in the sense that they do not measure attributes of a subject (like intelligence, extroversion, etc.), but the opinion of users concerning the UX of products. Thus, in UX research the scale reliability may vary between different application areas or products, that is, it is not a property of the scale alone. These differences cause some additional concerns about the usage of α as a valid way to measure the reliability of a UX scale.
These concerns about the usage of the α coefficient are discussed in this paper. This should help UX practitioners and researchers avoid misinterpretations of the coefficient.
General Concerns with α?
In this section, I describe the known general issues concerning interpretation and usage of the α coefficient.
One point, that is in my opinion not really an issue (I mention it here for completeness), is that there are other methods to estimate the reliability of a scale that give, from a theoretical point of view, a better estimation than Alpha. As mentioned above, Cronbach’s Alpha is only a lower bound for reliability. Other coefficients, for example the Lambda Coefficients of Guttman (1945), allow a slightly better estimation. For example, for the λ2-Coefficient (which is also a lower bound for reliability), λ2 > α is the result.
However, these other methods are computationally much harder to calculate and in practice the differences are neglectable. I have done a re-analysis of 10 larger data sets concerning the User Experience Questionnaire (UEQ; Laugwitz et al., 2008), and the differences between α and were for all 6 scales of the UEQ always less than 0.04 (and in most cases both coefficients provided identical values). So, this is more a theoretical concern, but seems to have no real practical implications.
α Depends on the Number of Items in a Scale
Assume there is a scale with n items and the mean correlation between these items is 0.2. For n = 5, the α value is 0.56; for n = 10, this goes up to 0.71; and for n = 20, it is measured at quite a high α value of 0.83.
Thus, with a fixed mean correlation, α increases with the number of items. This is not problematic or wrong because the reliability of the scale will be intuitively better the more items it contains. The influence of random response errors on the mean or sum of the items decreases with an increasing number of items and thus reliability will increase. Alpha can also be used to decide if items can be dropped to shorten a scale without going below a certain level of reliability (Lewis & Sauro, 2017).
But on the other hand, it also shows that considering α alone is not sufficient to judge if a scale in a questionnaire is well-designed. A scale with α = 0.83 looks impressive if considered just for this value. But if this result is from 20 items with a mean correlation of 0.2, this does not really speak for a high quality of the scale. Thus, α should always be interpreted considering the number of items in a scale. This is especially important if different scales are compared concerning their α values. The α value can be always increased by adding items, but this also increases the effort of the participants to answer the items in a scale.
A detailed look at the correlation matrix of all items in a scale gives much better insights concerning scale quality than α alone.
α Is Not an Indicator for Scale Consistency
The interpretation of α as an indicator of unidimensionality or internal scale consistency (all items of a scale measure the same construct) is surprisingly common. But it can be easily shown that this interpretation is misleading.
If α is low, obviously the mean correlation between the items of a scale is low, and this is of course an indicator that the items do not measure the same construct. But the opposite is not true. A high level of α does not mean that a scale is unidimensional or even consistent.
Example: Assume a scale with 10 items and the following correlation matrix.
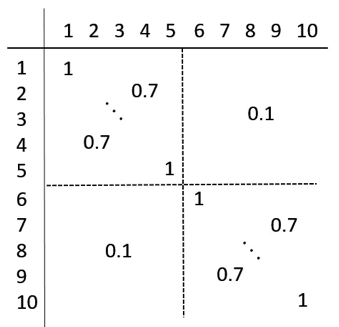
Figure 1. Correlation of the items of a hypothetical questionnaire.
Thus, there are two groups of items {1, …, 5} and {6, …, 10}. The items correlate highly inside their corresponding group and show only a minor correlation to items of the other group.
Clearly this is a two-dimensional structure, with items 1 to 5 and items 6 to 10 measuring different aspects. So intuitively this scale is not internally consistent and of course not unidimensional. But the mean correlation of all 10 items is 0.4, and the value of the α-coefficient is 0.87. Therefore, this example clearly shows that the interpretation of a high α as an indicator for unidimensionality or scale consistency is not valid.
Of course, this is not a problem of the Alpha coefficient itself (Alpha measures reliability, which is simply a different concept than scale consistency), but a quite common error in interpreting Alpha. Again, a look at the single correlations gives a much better picture here and condensing these correlations into a single coefficient hides important information.
What Is a Good Value of α?
As with any other statistic there is the obvious question of what a concrete value of α means. Is a value of 0.6 an indication of sufficient reliability or not? Some “cookbook” like suggestions are repeated over and over again in papers. For example, George and Mallery (2003), who are often cited, provide the following rules of thumb: α > 0.9 (Excellent), > 0.8 (Good), > 0.7 (Acceptable), > 0.6 (Questionable), > 0.5 (Poor), and < 0.5 (Unacceptable).
Many papers cite Nunnally (1978) in the sense that an α higher than 0.7 is an indicator for sufficient scale reliability (see Lance et al., 2006 for an overview of this quite common misinterpretation). However, the original argumentation in Nunnally (1978) is in fact much more elaborate. Nunnally (1978) clearly pointed out that the required level of α depends on how critical the decisions are that are drawn based on the test result, that is, he does not argue in the direction of a general acceptable cut point of 0.7 (for details, see Lance et al., 2006).
The general problem with all these suggested heuristics is that there is no clear methodological foundation for these recommendations. Thus, any statement like “α should exceed x” is just some convention. As Cortina (1993) stated, “One reason for the misuse of α in applied psychology is that there seems to be no real metric for judging the adequacy of the statistic” (p. 101).
What is acceptable depends on the decisions that are based on the scale values. If a test decides if a participant is allowed to enter certain type of studies, can be hired for a job, or if some decision about a medical treatment is based on the test results, then of course a high level of α is required. Or as Cortina (1993) pointed out, “those who make decisions about the adequacy of a scale on the basis of nothing more than the level of α are missing the point of empirically estimating reliability” (p. 101).
In UX we typically do not interpret the answers of single users concerning the UX of an application; only the mean of a scale over several respondents is interpreted. Thus, α is not so important, and we may be able to accept moderate or even low levels of α. I will come back to this point later.
UX Specific Problems with α
In this section, I describe some issues with the usage of α that are specific for UX questionnaires. Such UX questionnaires clearly differ from classical psychological questionnaires with respect to two points:
- In typical psychological questionnaires, the results of the questionnaire are used to measure some properties of a person, for example, intelligence, personality, interests, and so on. Thus, the measurement of properties of a single person is what is of interest, what is finally interpreted, and therefore should be reliable.
- UX questionnaires measure the impression of a group of users towards the UX of a product. UX professionals are typically not interested at all in the opinion of a single user, but always interpret mean values from an adequately large target group
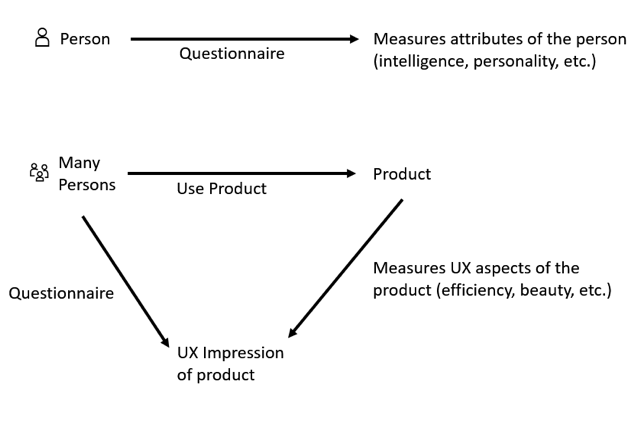
Figure 2. Differences between typical psychological questionnaires (top) and UX questionnaires (bottom).
This pattern is of course not unique for UX questionnaires but occurs in other domains as well. An example are marketing questionnaires that measure the impression of people towards a brand. Another example are questionnaires in political science that measure trust of people in political institutions or organizations.
The classical reliability concept, and also α, was developed for the case of classical psychological questionnaires. Thus, it is unclear if this concept can be transferred to UX questionnaires without any modification.
α Depends Not Only on the Scale, but also on the Product
As mentioned already in the introduction, in UX we measure the impression of a group of users towards a product. Thus, Cronbach’s α depends not only on the scale, but also on the selected target group and on the product. If we measure several products with the same UX scale, then the α values for the scales may change. And this change is not only a random change due to some measurement errors but also results from the specific context of the evaluation, that is, the product that is evaluated.
Items of a UX scale are always interpreted in the context of the product under investigation. As a small example, I looked at two bigger data sets (from unpublished practical product evaluations) in which products were evaluated with the UEQ (See Laugwitz et al., 2008, for the paper describing the construction of the UEQ). The UEQ contains a scale Dependability with the four items: unpredictable/predictable, obstructive/supportive, secure/not secure, meets expectations/does not meet expectations.
In the first data set, 151 subjects evaluated a washing machine, and Cronbach’s Alpha for the scale Dependability was 0.78. In the second data set, 720 subjects evaluated a social network, and Cronbach’s Alpha for the scale Dependability was 0.64. The main reason for this difference was that the correlations of the item secure/not secure to the other items in the scale were much higher in the first data set than in the second. In fact, these differences are not really surprising. In the context of a washing machine the concept of security is simply a bit different than in the context of a social network (where also the aspect of data security or misuse of one’s own data comes into consideration), and this difference has an impact on the correlations of the items in the scale.
In this example, it was quite obvious that the evaluated product impacts the interpretation of some items. But the specific product can also have subtle and not so easy to detect effects. There can be small changes in the meaning of some items that have an impact on the item correlations. This can cause changes of α.
As a second example, I looked at two bigger data sets (again from unpublished practical product evaluations) collected with the UEQ. The first data set contains data from the evaluations of several household appliances with the German UEQ (in total 3,983 data points). The second data set contains data from several evaluations of different web shops with the UEQ (in total 858 data points).
I calculated the correlations for the items of the scales Efficiency, Dependability, and Novelty over these two data sets (see Table 1). As shown in Table 1, single correlations between items are heavily influenced by the different types of products. Thus, the type of product seems to have an impact of the interpretation of the items and thus on the similarity of items. However, only for one scale (Dependability) this causes a drop of Alpha. For the other two scales, the lower correlations for some items were compensated by higher correlations for other items.
Table 1. Correlations of UEQ items for web shops and household appliances.
|
Scale Efficiency |
Scale Novelty |
Scale Dependability |
||||||
|
Items |
Web shops |
Househ. App. |
Items |
Web shops |
Househ. App. |
Items |
Web shops |
Househ. App. |
|
9, 20 |
0.43 |
0.35 |
3, 10 |
0.48 |
0.54 |
8, 11 |
0.42 |
0.12 |
|
9, 22 |
0.32 |
0.40 |
3, 15 |
0.30 |
0.44 |
8, 17 |
0.34 |
0.13 |
|
9, 23 |
0.28 |
0.49 |
3, 26 |
0.27 |
0.26 |
8, 19 |
0.27 |
0.12 |
|
20, 22 |
0.58 |
0.44 |
10, 15 |
0.38 |
0.53 |
11, 17 |
0.26 |
0.37 |
|
20, 23 |
0.45 |
0.28 |
10, 26 |
0.38 |
0.16 |
11, 19 |
0.44 |
0.39 |
|
22, 23 |
0.41 |
0.36 |
15, 26 |
0.44 |
0.33 |
17, 19 |
0.47 |
0.53 |
|
Alpha |
0.73 |
0.72 |
Alpha |
0.71 |
0.71 |
Alpha |
0,70 |
0.60 |
Such variations of α were also reported by Lewis (2018) for the System Usability Scale (see Brooke, 1996). Lewis’s paper lists several studies (some of them with large sample sizes) with the SUS. The observed value for α varied here between 0.83 and 0.97. Most likely the different types of investigated products also had an impact on the results. Please note that the SUS has 10 items and is known to show a high reliability (see, for example, Bangor et al., 2008). The impact of changes in the interpretation of single items due to the investigated product is of course smaller the more items are contained in the scale. Thus, the impact of such effects is bigger for shorter scales (like the UEQ scales with just four items per scale) than for larger scales like the SUS (where 10 items form the scale).
Thus, for UX questionnaires, α can never be interpreted as a quality criterion of a given scale or questionnaire itself. Even if there are high α values in some first evaluation studies of a new questionnaire, this does not mean that this will be true for all kinds of products. It is in fact only valid for products more or less similar to the ones that are evaluated. Thus, a statement in the report of a validation study that states that α was sufficient or high for all scales of a questionnaire is of limited usefulness and should not be interpreted as a general quality of the scale independent of the product type. To avoid such misinterpretations by UX practitioners, authors should make this explicit when they report studies that report the reliability of a UX questionnaire.
Similar effects can of course occur if a questionnaire is translated or applied in a completely different target group. This can also cause some subtle changes in the meaning or interpretation of items that impact the correlations between items. For translations, it is a common practice to validate if the structure of the scales is impacted by the translation. For applications of a scale to different product types, UX professionals should pay a similar level of attention to such effects.
Thus, reporting α values makes sense if results for a concrete application of a UX questionnaire are reported, but not as a general measure for the scale quality of a UX questionnaire that should be used in different application areas.
Sample Size and α
The main question of interest in UX research is typically not how accurate the measurement for a single user is (which is the classical idea behind the concept of reliability), but how stable the scale mean is against sampling effects and measurement errors.
The calculation of α is based on the correlations of the items in a scale. It is known that such correlations are quite unstable if the sample size is small. In a large simulation study, Schönbrodt and Perugini (2013) investigated the stability of correlations using a sequential sampling procedure. They varied the size of the correlation, the requested accuracy, and the confidence in the resulting correlation. They concluded that for some values of these parameters, which are quite typical in psychological research, up to 250 data points are required to get a stable estimate of the true correlation. Of course, α is based on the intercorrelations of all items in a scale and may thus be more stable than a single correlation, but it can be expected that the coefficient will be quite sensitive against small sample sizes.
An approximate significance test and the calculation of a confidence interval for coefficient α (under some additional assumptions concerning independence and distribution of the data) are described in Bonett (2002) or Iacobucci and Duhachek (2003).
But as I argued before, for UX scales, UX professionals are not interested in the values obtained by single participants. A quite stable estimation of the scale mean can be achieved even with miserable α values. I show this with the help of the following two small simulation studies.
In the first study, a scale of four items from the UEQ and data from a study with 240 participants was used as a basis for the simulation. The scale mean was 5.64, the standard deviation 1.14, and Cronbach’s α was 0.81, indicating a high reliability (if the cookbook suggestions were to be followed).
Random samples of 20, 30, 40, and 50 participants were used from the complete data set; these sample sizes are not untypical for UX evaluations in practice (such small samples result often from the combination of a classical usability test and a questionnaire, which is a quite popular way to evaluate products in practice). For each sample size, 200 such samples were drawn and α and the scale mean were calculated. These values are plotted in Figure 3.
The observed mean values and standard deviations (in parenthesis) for the estimated scale mean and α from the sample were the following:
- Sample size 20: 5.62 (0.26) for scale mean, 0.79 (0.12) for α
- Sample size 30: 5.61 (0.23) for scale mean, 0.8 (0.09) for α
- Sample size 40: 5.62 (0.19) for scale mean, 0.79 (0.08) for α
- Sample size 50: 5.63 (0.17) for scale mean, 0.8 (0.08) for α
But in the single samples shown in Figure 3, a huge variation of the estimated Alpha value can be observed.
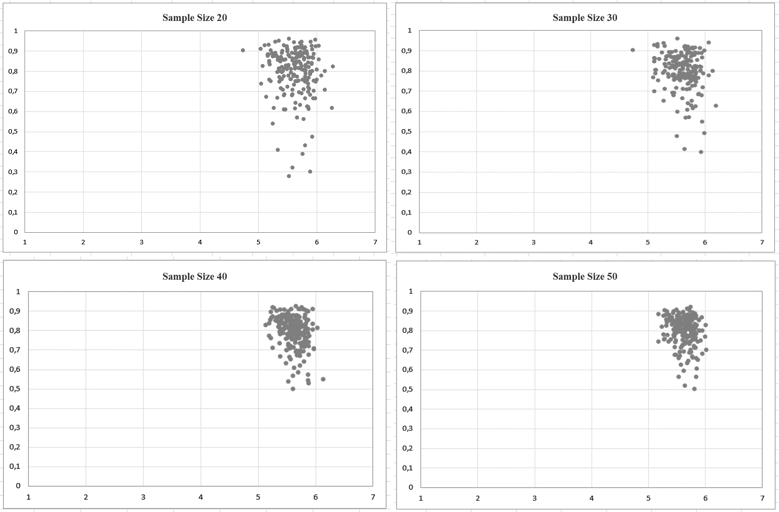
Figure 3. Alpha value and scale mean for 200 simulations with different sample sizes. The horizontal axis represents the mean scale value (7-point Likert scale with values from 1 to 7) and the vertical axis the α value.
As illustrated in Figure 3, α is extremely sensitive to sampling. For a sample size of 20, the α values varied between 0.28 and 0.95, that is, nearly the full range of possible α values was observed. Compared to this the computed scale mean is quite stable (it varied between 4.74 and 6.28). Even with a sample size of 50, there is still a relatively huge variation in the α values.
Thus, if the sample size is small and a low α value is observed, there is a high chance that this is due to some sampling effects and not an indicator of a low scale reliability. In these cases, UX professionals should better not pay too much attention to α.
In a second simulation, again samples of n = 30 were drawn from the same data set. This time an additional random response error was simulated with varying error probabilities to simulate different degrees of reliability.
Again, α and the scale mean were calculated per simulation. In Figure 4, I plotted the absolute difference of the calculated scale mean to the “true” scale mean 5.64 (in my case the scale mean calculated from all 240 data points in the data set) and α for each of the 200 simulation runs.
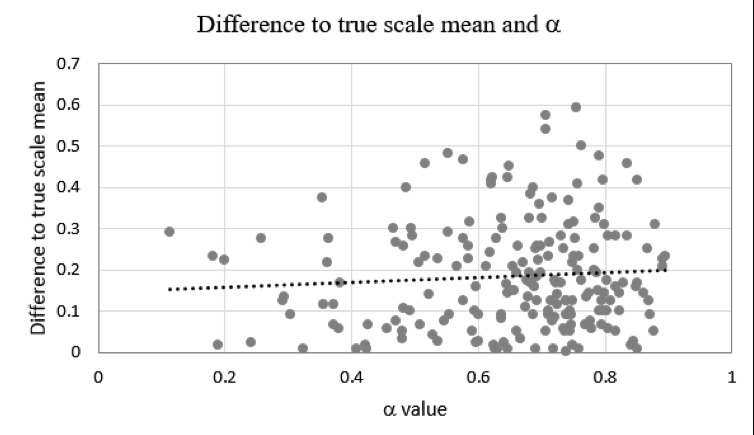
Figure 4. Dependency of α and the difference of scale mean for the simulated sample and the true scale mean from the complete data set.
As Figure 4 illustrates with the trend line, there is only a small dependency between the value of α (i.e., estimated scale reliability) and the error in measuring the scale mean. Thus, even with quite low levels of α, a relatively stable measurement of the scale mean can be expected.
Conclusions
Cronbach’s Alpha coefficient is widely used in UX research as a method to report scale reliability of questionnaires. However, there are several general methodological concerns about the usage of Cronbach’s Alpha for this purpose. These concerns are mainly discussed inside journals concerning psychometric theory, but seems to be widely ignored in practice (see also Cronbach, 2004 for a detailed discussion on this point). One goal of this paper is to raise awareness about these concerns among UX researchers.
Lee Cronbach (see Cronbach, 2004) himself was in later publications quite critical concerning the typical use of his Alpha coefficient and even more general about the practice to express the reliability of a measurement instrument by a single value. In his paper, Cronbach (2004) wrote, “Coefficients are a crude device that does not bring to the surface many subtleties implied by variance components. In particular, the interpretations being made in current assessments are best evaluated through use of a standard error of measurement” (p. 4). In a later part of the same paper, he wrote, “I am convinced that the standard error of measurement … is the most important single piece of information to report regarding an instrument, and not a coefficient” (p. 26).
One finding that may be highly relevant for researchers using UX questionnaires is that the Alpha coefficient is quite sensitive concerning sampling errors. If sample sizes are low (which is not unusual in UX evaluations), the coefficient is not a good indicator for scale reliability. Thus, it must be interpreted with care in such situations.
The reliability concept behind Cronbach’s Alpha (and also behind other measures to estimate reliability in psychological test theory) is based on the typical psychological tests or questionnaires in which attributes of single persons are measured and interpreted.
In applications of UX questionnaires, UX professionals are not interested in single opinions concerning UX but always in the average opinion of a target group. We can get quite stable measurements of a scale mean even if the Alpha value for the scale is quite low. Thus, in UX research, we can accept scales that show only moderate Alpha levels. In addition, reliability is not only a property of a scale but also depends on the evaluated product, that is, it can differ between product types. In my opinion this difference makes it also a bit questionable if the reliability concept developed for a psychological test can be applied without modification to UX questionnaires.
These UX specific factors impact also other known methods to estimate reliability (for example, test/re-test or split-half methods), that is, they are not specific to the usage of the Alpha coefficient.
Suggestions for UX Practitioners and Researchers
Of course, the usage of Alpha has, besides the problems described above, also some advantages. The coefficient is easy to compute and easy to understand. This is what made it popular among researchers and practitioners. In addition, reporting Alpha values to describe scale reliability is somehow a tradition in empirical UX research. Therefore, I do not argue to skip the reporting of the Alpha coefficient. But the coefficient should be interpreted more carefully when results are published.
I described in this paper five problematic aspects concerning the usage of the Alpha coefficient. Each of these aspects has some practical implications:
- Dependency on the number of items in a scale:
If a scale contains a high number of items, then a high value for Alpha can be reached, even if the intercorrelations of the items in the scale are moderate or even low. Thus, consider the number of items in a scale if you use Alpha to judge scale quality.
- Alpha is not an indicator for scale consistency:
If space permits this, report the single item correlations in publications of questionnaire results. This allows a much better insight about scale consistency. Misinterpretations of single items get clearly visible by small correlations with other items of the scale (but be careful if you have a small sample size), and this can be then considered in the interpretation of the data. If all intercorrelations are merged into the Alpha coefficient important information is lost.
- For many practical projects moderate levels for Alpha can be tolerated:
The level of Alpha that is required to properly interpret a scale depends on the importance of the decisions that are drawn from the results. In UX research, we typically do not interpret answers of single users, but mean scale values in a target group. Thus, for many projects we can live with moderate levels of Alpha because the influence of a low reliability on the level of respondents to the scale mean is limited.
- Dependency on the evaluated product:
If a new questionnaire is not restricted to a clearly defined type of application, it is important to provide data about scale reliability for different products. The items of a scale are always interpreted in the context of the evaluated product. Thus, scale reliability can differ between different product types.
It is of course practically not possible to check the reliability of new scales for all different product types to which the questionnaire is applicable. But having data for at least some common product categories is important to get a better insight into scale reliability. In addition, readers should be informed about this potential dependency between scale reliability and product type used in the study. The fact that reliability can vary depending on the product type should be explicitly mentioned.
- Dependency on sample size:
If you report the results of an UX evaluation with a questionnaire and your sample size is low, then a high value for Alpha should not be interpreted in the sense “reliability of the scale for our data is high and we can trust the results” nor does a low level of Alpha mean “reliability of the scale is low and we should not interpret the results.” Alpha is quite sensitive for sampling effects, and if your sample size is small, it should be interpreted carefully (because Alpha depends on the number of items in a scale, this is especially true for shorter scales). The standard error of the scale means may be a much better way to give the readers an impression of how much they can trust the measurement (see Cronbach, 2004).
Studies for the validation of new scales should always be planned with a high sample size; otherwise, it is difficult to judge scale reliability based on the results.
References
Bangor, A., Kortum, P. T., & Miller, J. T. (2008) An empirical evaluation of the system usability scale. International Journal of Human–Computer Interaction, 24(6), 574–594. DOI:10.1080/10447310802205776.
Bonett, D. G. (2002). Sample size requirements for testing and estimating coefficient Alpha. Journal of Educational and Behavioral Statistics, 27(4), pp. 335–340.
Brooke, J. (1996). SUS: A ‘quick and dirty’ usability scale. In P. Jordan, B. Thomas & B. Weerdmeester (Eds.), Usability Evaluation in Industry (pp. 189–194). Taylor & Francis.
Cortina, J. M. (1993). What is coefficient Alpha? An examination of theory and applications? Journal of Applied Psychology, 78(1), pp. 98–104.
Cronbach, L. J. (1951). Coefficient alpha and the internal structure of tests. Psychometrika, 16, pp. 297–334.
Cronbach, L. J. (2004). My current thoughts on coefficient Alpha and successor procedures. Educational and Psychological Measurement, 64(3), pp. 391–418.
Falk, C. F. & Savalei, V. (2011). The relationship between unstandardized and standardized Alpha, true reliability, and the underlying measurement model. Journal of Personality Assessment, 93(5), pp. 445–453.
George, D. & Mallery, P. (2003). SPSS for Windows step by step: A simple guide and reference. 11.0 update (4th ed.). Allyn & Bacon.
Guttman, L. (1945). A basis for analysing test-retest reliability. Psychometrika, 10, pp. 255–282.
Horst, P. (1966). Psychological measurement and prediction. Wadsworth Publishing Company, Inc.
Iacobucci, D. & Duhachek, A. (2003). Advancing Alpha: Measuring reliability with confidence. Journal of Consumer Psychology, 13(4), pp. 478–487.
Lance, C. E., Butts, M. M., & Michels, L. C. (2006). The source of four commonly reported cutoff criteria. Organizational Research Methods, 9(2), pp. 202–220.
Laugwitz, B., Schrepp, M., & Held, T. (2008). Construction and evaluation of a user experience questionnaire. In A. Holzinger (Ed.), HCI and Usability for Education and Work. USAB 2008. Lecture Notes in Computer Science, Vol. 5298 (pp. 63–76). Springer, Berlin, Heidelberg DOI: 10.1007/978-3-540-89350-9_6
Lewis, J. R. (2018). The System Usability Scale: Past, present and future. International Journal of Human-Computer Interaction, 34(7), pp. 577–590. DOI:10.1080/10447318.2018.1455307
Lewis, J. R. & Sauro, J. (2017). Can I leave this one out? The effect of dropping an item from the SUS. Journal of Usability Studies, 13(1), 38–46.
Lienert, Gustav A. (1989). Testaufbau und Testanalyse. Psychologie Verlags Union.
Nunnally, J. C. (1978). Psychometric theory (2nd ed.). McGraw-Hill.
Schönbrodt, F. D. & Perugini, M. (2013). At what sample size do correlations stabilize? Journal of Research in Personality, 47(5), pp. 609–612.
Sijtsma, K. (2009). On the use, misuse, and the very limited usefulness of Cronbach’s Alpha. Psychometrika, 74, pp. 107–120.