It has been seven years since UXPA and our founding editor-in-chief, Avi Parush, published the first issue of the Journal of Usability Studies (JUS). We felt that it was time to look back at the almost 80 peer-reviewed papers that have been published to see what we could learn about how to characterize JUS. The purpose of JUS is to “promote and enhance the practice, research, and education of user experience design and evaluation.” During the early meetings about whether the society should publish a journal, there was a decision that the journal should reflect the goals of the membership. It should speak to practitioners as well as researchers, should emphasize applied research over basic research, and should be a place for industry professionals to publish their work in addition to those at universities. The template created for authors required a section titled “Practitioner’s Take Aways” to emphasize the need to have papers speak to practitioners.
Are we achieving our objectives? Are we serving both researchers and practitioners? Who is publishing in the journal: academics, industry professionals? Is there a mixture of empirical research, case studies, analysis, and opinion? Are the papers being cited in the research literature? Those are a few of the questions to which we sought answers.
In the following sections, we describe our method, findings, and the conclusions we drew about how well we have met our objectives and what we can do to improve JUS.
What We Decided to Count
We looked at a small sample of the peer-reviewed papers to decide what kinds of data made sense to tabulate. We generated a list of broad categories.
Information About the Authors
Employment: We wanted to know what types of organizations the authors were employed at. There seemed to be three options: universities, industry, and government. It quickly became clear that there could be a mixture of organization types among the authors of the same paper. So we decided that the organization type would be determined by where the first author of the paper was employed. We were also interested to see how many papers represented collaboration between authors in different types of organizations. Of particular interest was whether authors from universities and industry were working together on papers. Because JUS is intended to speak to both researchers and practitioners, our hope was that it had become a good journal to submit collaborative work to.
Geography: The geographical distribution of the authors was also of interest. Is JUS attracting authors from around the world?
Information About the Studies Being Reported
Study Type: We started with an overall judgment about the type of study, i.e., was it an experiment, a case study, a theoretical analysis? In most papers the authors make a statement about its type, often in the Abstract section or at the beginning of the Conclusions section. But their assessment of the type of study often did not match our judgment. Consequently, we recorded both the authors’ and our judgment of study type.
Technology: We then looked at the technology that was used in the study or was the focus of the study, such as a website or mobile device.
Methodology: We were interested in the variety of methods used in the studies. We started out with one method category but when we began to disagree about the methods used we realized that there were two different types of methods to consider:
- the user experience (UX) method used in the study, such as usability testing, observation, etc.
- the research method used in the study, such as a product comparison experiment or a correlational study
So we tabulated both method types.
Participants and Statistics: Because JUS was intended to speak to both researchers and practitioners, we wanted to know how many studies collected data from participants and how many reported inferential statistics.
Number of Times Studies Were Cited
In order to obtain a better understanding of the impact of the published papers for the research community, we tracked the number of times every paper was cited in Google Scholar. We realized that there are several ways to measure the impact of a study. But the citation counts in Google Scholar were easy to obtain and would give us a rough idea about the number of citations and the types of papers that have been most popular.
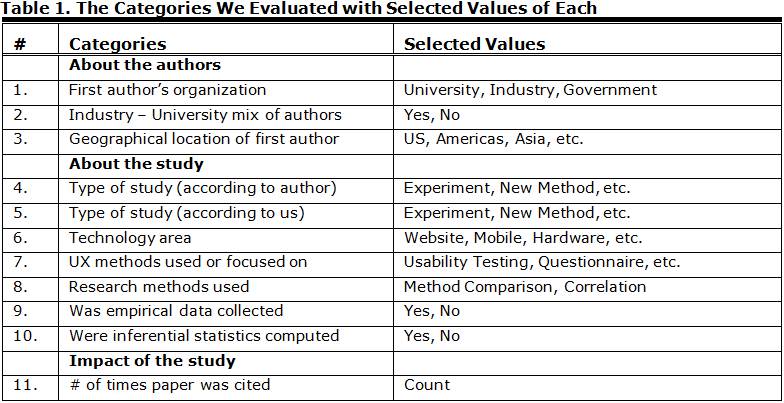
Table 1 shows the 11 categories we included in our analysis.
How We Tabulated the Characteristics
For convenience, we created a shared spreadsheet. We distributed the issues equally between us, read through each of the peer-reviewed papers, and made our judgments about the values to assign to each category. If either of us was not sure about a data value, s/he either highlighted the field or attached a comment to the cell. We had several discussions about the difficult or ambiguous cases.
When we reached final agreement on the categories and values, we added up the number of repetitions of the values in each category and summed them.
What We Found and What It Means
We describe the findings in the following sections.
About the Authors
Not unexpectedly, of the 77 papers published from November 2005 to February 2012, 61% had their first author from a university and 35% from industry (see Figure 1).
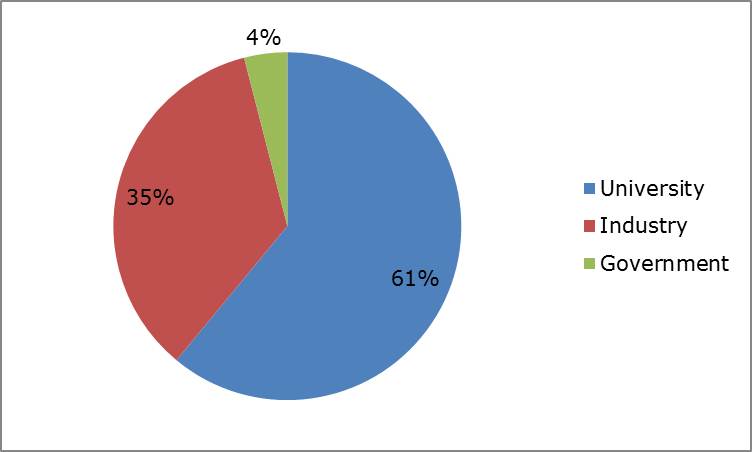
Figure 1. Type of organization first author works at
The mix of organizations seemed reasonable given JUS’s goal to reach practitioners as well as researchers.
We also looked at the mix of organizations among the authors of each paper (see Figure 2). We found that only 13% of the papers had authors from both universities and industry. There were no authors from industry or universities in papers from government organizations. We would like to see more collaboration between organizations in a journal that is intended to serve practitioners.
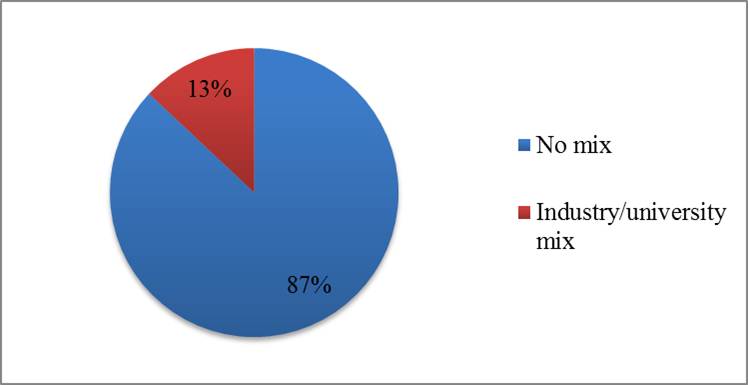
Figure 2. The mix of author organizations in JUS papers
Figure 3 shows the geographic location of the first author of the papers. It shows that 93% of the authors were from the North America or Europe. Fifty percent of the European papers were from Finland. Five papers were from Asia: India (2), Malaysia, Taiwan, and Korea.
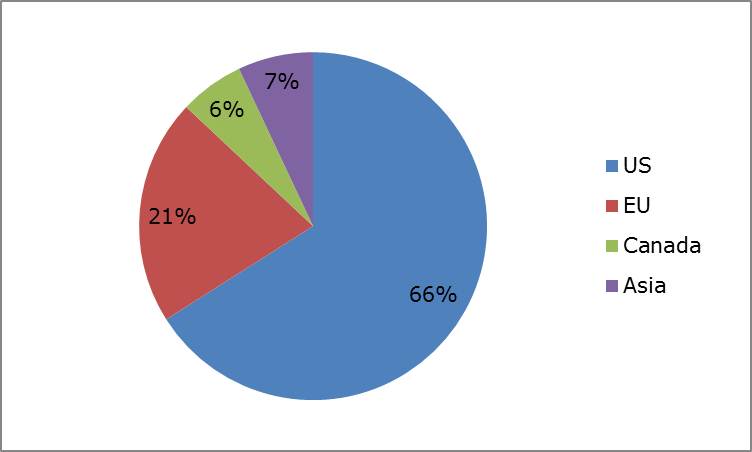
Figure 3. The geographic location of the first author of papers
To answer the question about how the JUS geographic breakdown reflects the UXPA breakdown, we compared them. Figure 4 shows the comparison. The two breakdowns are remarkably close.
There are some locations with UXPA local chapters that are not represented in the JUS distribution, notably Australia, New Zealand, and South America. We would like to stimulate a wider distribution.
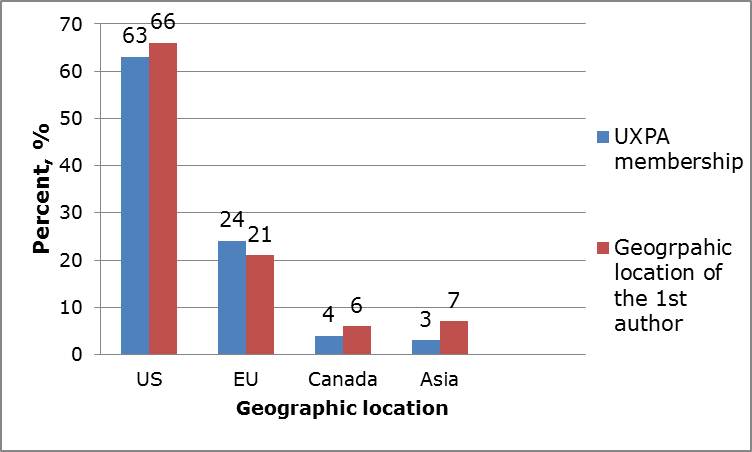
Figure 4. Comparison between the geographic location of the first author of papers and the geographic location of UXPA membership
About the Studies
When we looked at the types of studies in JUS, we found some interesting results (see Figure 5). Most papers state the type of study in the abstract and/or with the conclusions the authors draw from the study. You can see that about half of the papers are categorized as Case Studies by the authors and 14% are experiments. When we read the papers, we categorized many more of them, 40%, as experiments. Apparently, authors are reluctant to use the term “experiment” to describe the study they report. We can only speculate, but perhaps they feel that reviewers will treat their paper more harshly if they call a study an experiment.
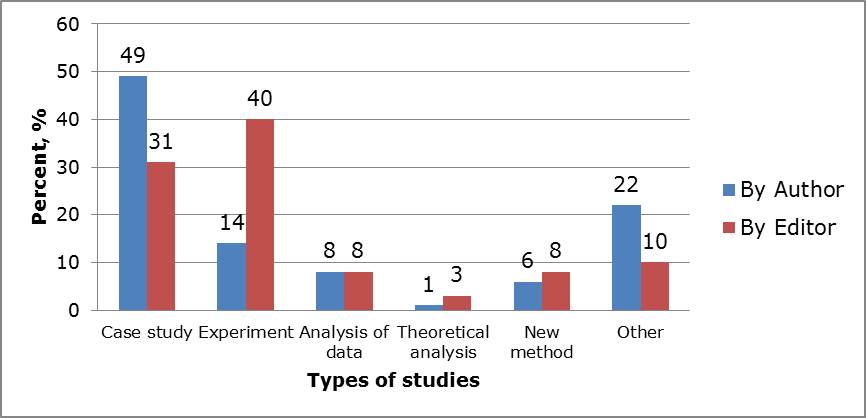
Figure 5. The types of studies published as judged by authors and editors
Not surprisingly, 80% of the experiments come from authors at universities.
In our categorization, only two of the papers were theory based, that is, an analysis or empirical study of a theory. We draw several conclusions from the lack of theory-based papers. The user experience profession has few theories to test and its professionals tend not to conduct basic research. It may also be the case that JUS is not attracting authors of theory-based studies. Perhaps the fact that JUS is both a relatively new journal and only available online causes authors to look at more established journals as a first choice for submittals. That is a bit of a chicken and egg problem for JUS. We can’t attract more theoretical papers until more are accepted but authors don’t submit them because they don’t see them in JUS.
Figure 6 shows the technology areas that are the focus of the studies.
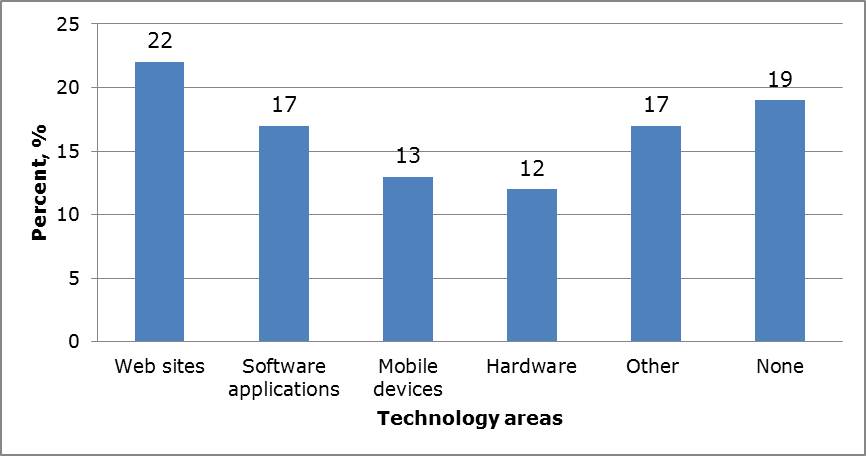
Figure 6. Technology areas that JUS papers focus on
As we mentioned above, there were two types of methods that we tabulated: UX methods and research methods. For example, a study about where links should be placed on web pages that compared two web page designs would be categorized as a research study with a comparison test. A study that used a survey to poll users about preferences would be categorized as a UX method using a questionnaire.
Figure 7 shows the UX methods that were studied. Usability testing was overwhelmingly the most frequently studied method. That finding is not surprising because usability testing is research-like in its components. The testing studies contribute to the strong trend toward evaluation methods. Those studies also fit into an extensive literature that has been developing over the past 25 years. What was a bit surprising to us is the lack of studies of the other methods used in product development, particularly requirements gathering methods such as site visits and early design methods such as prototyping. Perhaps the restricted methods seen in JUS papers is the result of the name of the journal. “Journal of Usability Studies” may suggest to some potential authors that the journal is focused on usability testing or usability evaluation. If that is the case, a name change that includes “user research” or “user experience” might encourage a wider range of submissions. It is, however, encouraging to have a good number of papers on universal design.
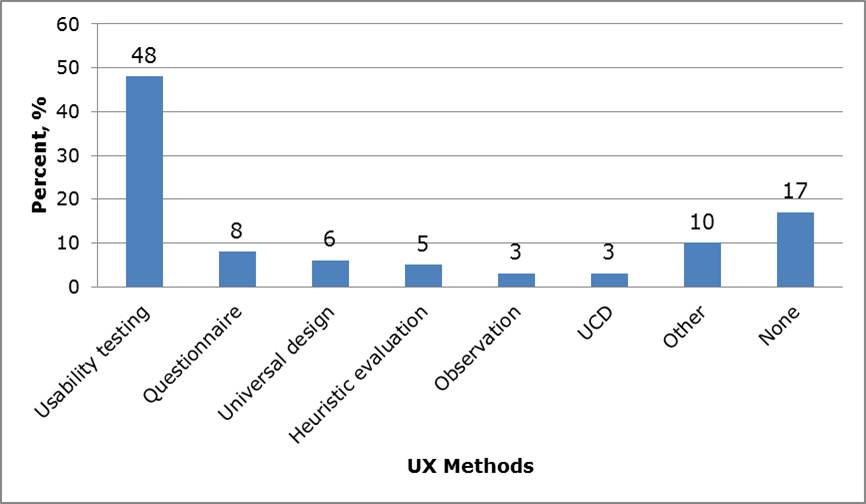
Figure 7. UX methods used in JUS papers
Figure 8 shows the research methods used in the empirical studies. The most frequently used method was some type of comparison of products, methods, or cultures. They account for almost 40% of the papers. The papers in the “None” and “Other” categories were opinion pieces and analyses of issues or of previously collected data.
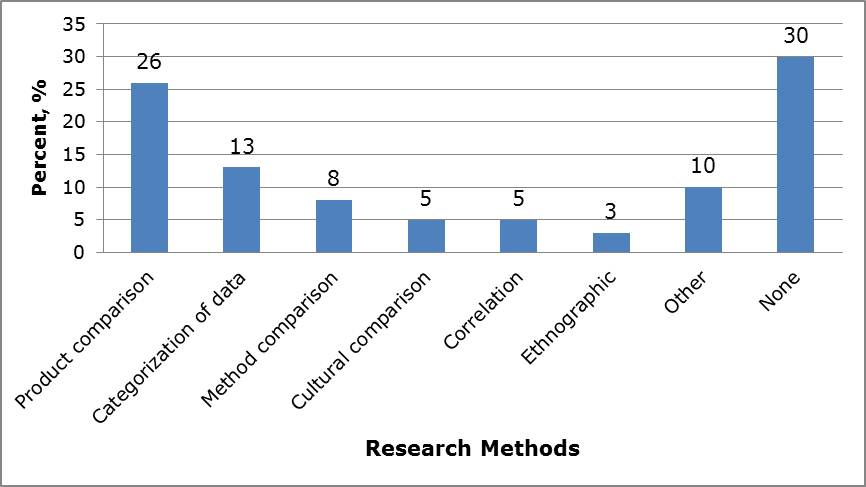
Figure 8. Research methods used in JUS papers
Our analysis showed that 79% of the papers included data that was collected from participants and 64% of them computed inferential statistics. Most of the statistics were simple t-tests, CHI-squares, or correlations. Empirical studies without inferential statistics are mostly case studies, such as demonstrations of new methods. We expected that most studies would be empirical and the 80/20 split seems like a reasonable one for our profession.
About the JUS Papers Being Cited
We chose to use a simple method for finding out how frequently JUS papers are being cited in the literature and which topics have attracted the most interest. We just wanted a rough idea about citations. We realize that we could have looked more deeply at the impact of the papers such as specifically where the papers were being cited and by whom. For example, were the citations from other authors in JUS, from the UX literature, from peer-reviewed journals? That level of analysis may come later. For this early look at the data, we used the numbers provided by Google Scholar when a paper title is searched.
Figure 9 shows the citations for the JUS papers published over the first five years of the journal. We chose those years because the most recent papers would not have time to be cited in the literature. They are arranged in their order of publication with the papers in Volume 1, Issue 1 shown first.
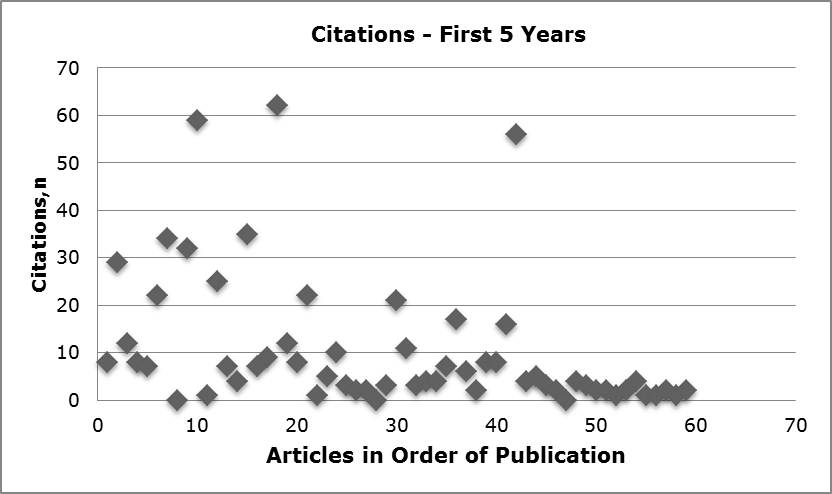
Figure 9. The number of times JUS papers have been cited according to Google Scholar
Not surprisingly the more recent papers have fewer citations. The three most frequently cited papers were from the following topics:
- How UX methods fit into Agile development (cited by 62)
- Impact of participants’ and moderators’ culture on usability testing (cited by 59)
- Determining what SUS scores mean (cited by 56)
Those papers were all empirical. A sample of papers with more than 20 citations includes:
- Formative usability test reporting
- Evaluation methods for games
- Eye tracking of web pages
- Sample size calculations
- SUS with non-English speaking users
This pattern of interests may point the way to topics that could become a special issue.
Conclusions
We believe that this initial look at the papers published in the first seven years of JUS is a good place to start a discussion about whether it meets the goals established for it. With 35% of the papers coming from industry and the large number of case studies, it appears that JUS is a place for practitioners to publish. Furthermore, the small number of theory-based papers reflects the applied emphasis of the journal and of the UX profession.
We would like to attract papers from a broader sampling of countries, especially countries with UXPA local chapters such as Australia, New Zealand, and South America. We have not yet looked at the geographic distribution of papers that were submitted to JUS but not accepted for publication. In another project we computed the JUS acceptance rate, which is 31%.
Consequently, there are many more manuscripts submitted than papers published. Still, we need to find a way to reach out to a broader audience of authors.
Finally, there is a heavy emphasis in the published papers on user experience evaluation, especially on usability testing. While those papers build on a large base of past studies, we would like to have more submittals on requirements gathering and design methods.
Encouraging special issues on those topics or modifying the name of the journal may be a way to prime the pump to increase the flow of such papers.
