
Abstract
Trust is an essential factor in many social interactions involving uncertainty. In the context of online services and websites, the problems of anonymity and lack of control make trust a vital element for successful e-commerce. Despite trust having received sustained attention, there is a need for validated questionnaires that can be readily applied in different contexts and for various products. We, therefore, report the development and validation of the TrustDiff scale, a semantic differential that measures user trust on three dimensions. Compared to Likert-type scales, semantic differentials have advantages when it comes to measuring multidimensional constructs in different contexts. Using 10 items, the TrustDiff semantic differential measures user perceptions of the Benevolence, Integrity, and Competence of an online vendor. The scale was investigated in three independent studies with over 1,000 participants and shows good structural validity, high reliability, and correlates expectedly with related scales. As a test of criterion validity, the TrustDiff scale showed significant differences on all subscales in a study involving a manipulated website.
Keywords
Trust, Semantic differential, Scale development, User experience, E-commerce
Introduction
Trust is an essential factor for securing working relationships when the parties involved are acting under uncertainty and with the risk of negative consequences (Casaló et al., 2007). In addition, trust-related concepts, such as credibility and privacy, can play an important role in determining the persuasiveness of an interface design (Némery & Brangier, 2014). There are multiple definitions of trust in the literature, emanating from various academic fields (e.g., Driscoll, 1978; Moorman et al., 1993; Rotter, 1967). This renders a precise operationalization for measuring trust particularly challenging. These disciplines generally define trust on the basis of two key components of trustworthiness: a willingness to be vulnerable and a perception of the intentions of the other party (Lewicki & Brinseld, 2012). The conceptualization of the constituents of user trust involves an analysis of the user’s assessment of his or her personal capacities to trust the vendor and the vendor’s capacity to engender that trust. The concept of trust is a construction that is inherently dependent on context. Trust, as an abstract concept, is a multidimensional term because it relates to conditional social behaviors. In the specific context of this paper, the concept of trust therefore acquires different significations depending on whether trust is built in an online or an offline environment.
Online trust usually involves aspects of trust in the internet itself and the organization behind the technology. Additionally, trust is characterized by a lack of face-to-face interaction, an asymmetry in the information available to each party, and concerns about privacy (van der Werff et al., 2018). The question of whether trust in a web context also implicates trust in the organization behind the website, in associated individuals (who, for example, will select or deliver your order), or in the internet technology itself (such as online payments) is still open for debate (van der Werff et al., 2018). However, trust in a web context is usually built around characteristics from e-commerce (Wang & Emurian, 2005). Accordingly, several questionnaires have been developed to measure trust (e.g., Bhattacherjee, 2002; Cho, 2006; Flavián et al., 2006; Gefen, 2002; Jian et al., 2000; McKnight et al., 2002a; Safar & Turner, 2005; Sauro, 2015). One of the main issues of trust research in web or e-commerce contexts is the lack of a common, validated, reliable, and versatile measure (Kim & Peterson, 2017). We further identify several limitations of the above-mentioned scales regarding applicability in research and practice. First, most questionnaires incorporate Likert-type scales with domain-specific statements. For instance, the items developed by McKnight et al. (2002a) are tailored to the specific website: For example, one of the statements to be rated is “LegalAdvice.com is competent and effective in providing legal advice.” In order to apply the scales in a different context, it might be necessary to rephrase its items. However, rephrasing the statements used in these questionnaires could result in an uncontrollable change in the scale’s reliability and validity. Second, translating Likert-type statements into other languages can be a difficult and time-consuming process, which may further affect validity. In the present research study, we therefore describe the development and validation of a new semantic differential for measuring trust on the web: the TrustDiff scale. This innovative measure displays several advantages over traditional Likert-type scales when used for measuring complex and multidimensional constructs (Verhagen et al., 2015). The results of three validation studies (total sample size N = 1,165) indicate that TrustDiff has excellent psychometric properties, measuring Benevolence, Integrity, and Competence with high reliability. Furthermore, we demonstrate how these three subscales relate to an existing Likert-type trust scale and to the concepts of visual aesthetics and usability. Finally, the TrustDiff scale was found to be sensitive to the manipulation of trust-related features in an experiment with a mock website. Overall, the TrustDiff scale is a promising tool for assessing trust in various domains of research and practice.
Characteristics and Dimensions of Trust
There are four characteristics of trust that are generally observed and accepted in the context of trust in e-commerce (Wang & Emurian, 2005). First, there must be two specific parties in a trusting relationship/a trusting party: a truster (such as an online customer) and a party to be trusted, that is, a trustee (such as an online vendor). Second, trust involves vulnerability, uncertainty, and risk for the truster, while anonymity and unpredictability are associated with the trustee. Third, trust leads to actions that mostly involve risk-taking behaviors such as providing personal and financial information. Finally, trust is subjective, and the level of trust considered prerequisite for engaging in online transactions is different for every individual. Moreover, people vary in their attitudes toward machines and technology (Wang & Emurian, 2005). Trust in e-commerce involves interpersonal trust, trust in the organization representing a website, and trust in the underlying technologies (van der Werff et al., 2018).
In the Web Trust Model developed by McKnight et al. (2002a, 2002b), trusting beliefs are at the core of what is generally considered the different dimensions of user trust. Although there are diverse types of trusting beliefs found in the literature (Bhattacherjee, 2002; Chen & Dhillon, 2003; Flavián et al., 2006; Gefen, 2002; Mayer et al., 1995; McKnight et al., 2002b), three dimensions are generally accepted: Benevolence, Integrity, and Competence. Benevolence is related to the user’s belief that the trustee is interested in the user’s welfare, is motivated to establish a mutually beneficial relationship, and has no intention to engage in opportunistic behavior. The character trait of Integrity, sometimes referred to as honesty (Flavián et al., 2006), is ascribed to the trustee if the user believes that the trustee is sincere and is intent on fulfilling any promises. Finally, Competence implies that the trustee has the resources and capabilities necessary to successfully complete the transaction and sustain the relationship (Casaló et al., 2007).
Existing Questionnaires
Various works have been directly or indirectly concerned with measuring trust (Bart et al., 2005; Cho, 2006; Corbitt et al., 2003; Lee & Turban, 2001; Jarvenpaa et al., 1999; McKnight et al., 2002a; Pavlou & Gefen, 2004; Safar & Turner, 2005; Sauro, 2015). However, from practical and research perspectives, there remains a need for a validated, brief, and easy-to-translate scale that measures trust and incorporates the three dimensions of Benevolence, Integrity, and Competence (Kim & Peterson, 2017). The following problems with pre-existing scales have been identified: First, not all of the existing scales investigate trust directly; instead, they often examine closely related constructs such as Benevolence, which is considered by Cho (2006) and also by McKnight et al. (2002a), who merely addressed it, as a component of the model for trust. Second, standard measurement methods were adapted to answer specific questions in certain contexts. An example of this is Lu et al. (2012) who developed Likert-type questions for Customer-to-Customer (C2C) platforms such as, “Do you agree that this C2C platform solves a security problem or stops a fraudulent behavior.” Third, in their meta-analysis, Kim and Peterson (2017) described pre-existing measurements as “ambiguous” and stated that there is a crucial need to devise a “well-developed scale to measure online trust that is specifically tailored to the business-to-consumer e-commerce environment” (p. 52). Fourth, measurements like those used in Sauro (2015) do not measure trust alone, but rather measure trust as one aspect of user experience in an e-commerce setting. In that context, trust is only measured using two items. Therefore, we decided to develop a semantic differential that addresses these problems and which also possesses certain advantages over Likert-scales.
Advantages of Semantic Differentials
Semantic differentials function by presenting respondents with a set of bipolar items, expressed as pairs of antonyms. This provides semantic differentials with specific advantages over the more common Likert-style questionnaires. Respondents to Likert-type scales can only indicate the extent to which they agree or disagree with a specific statement. Hence, a respondent’s selection of the option “strongly disagree” does not necessarily imply that the respondent agrees with the opposite of the item (Chin et al., 2008). Conversely, the format of semantic differentials enables respondents to express their opinion about a concept more fully; that is, they have a range of negative to positive response options to choose from. Another advantage is that semantic differentials can reduce the acquiescence bias sometimes provoked by Likert-type scales (Friborg et al., 2006). The acquiescence bias refers to a category of response biases indicating that respondents have a tendency to agree with all items or indicating a positive connotation (Friborg et al., 2006). Additionally, it has been demonstrated that semantic differentials outperform Likert-based scaling with regard to robustness (Hawkins et al., 1974), reliability (Wirtz & Lee, 2003), and validity (Van Auken & Barry, 1995). Furthermore, semantic differentials function effectively as a short-form scale format, which reduces survey completion time (Chin et al., 2008). Finally, the literature suggests that this format is appropriate for measuring complex and multidimensional constructs (Verhagen et al., 2015).
Development and Validation Strategy
The development and validation process adopted in this study followed the framework described by Verhagen et al. (2015). In a first step, relevant literature and existing scales were reviewed in order to develop a sample of bipolar scales reflecting the underlying concepts of Benevolence, Integrity, and Competence. In the second step, the linguistic and psychological antithetical terms for the survey item pairs were established on the basis of an extensive review carried out by 18 trained psychologists and user experience researchers. The scale anchors had to function as linguistic and psychological antonyms in relation to the concept being measured. After concluding these two steps, a first study was conducted to reduce the item pool and establish the structural validity (dimensionality) of the scale. We used the responses of 601 participants to conduct an exploratory factor analysis and to investigate correlations of the TrustDiff constructs with related constructs such as visual aesthetics and usability. This step served as an initial test of discriminant and convergent validity. A second study with 312 participants was conducted to test the measurement model with a confirmatory factor analysis, involving various types of interactive technology. The third study was set up as an experiment with 252 participants, where trust-related elements of a website were actively manipulated to test criterion validity.
Item Pool Development and Review
The literature review identified several relevant trust questionnaires that were used as a basis to develop an initial item. Key adjectives within sentences of existing questionnaires were extracted (Bart et al., 2005; Bhattacherjee, 2002; Cho, 2006; Corbitt et al., 2003; Flavián et al., 2006; Gefen, 2002; Gefen et al., 2003; Hong & Cho, 2011; Jian et al., 2000; Koufaris & Hampton-Sosa, 2004; Lu et al., 2012; McCroskey & Teven, 1999; Pavlou & Gefen, 2004; Rieser & Bernhard, 2016). Forty-three unique adjectives were identified, and several of them appeared multiple times in the literature. In a next step, possible antonyms were selected with the help of online dictionaries (www.merriam-webster.com, www.thesaurus.com, www.leo.org) and close synonyms were removed. This process resulted in 28 positive adjectives with up to three different antonyms.
An item-sort task as well as a test for linguistic and psychological bipolarity were performed by a panel (N = 18) of researchers and graduate students in the fields of psychology and human-computer interaction with knowledge of the Web Trust Model (McKnight et al., 2002a). They assigned each of the 28 adjectives to one of the three dimensions of trust using an online survey. Adjectives assigned to the correct dimension by less than 13 participants were excluded (Howard & Melloy, 2016). For each of the remaining adjectives, the best fitting antonym with the highest agreement was chosen, resulting in an initial set of 20 items (refer to Table 1).
Study 1
The goal of Study 1 was to reduce the over-representative item pool by employing factor analysis and to test the convergent and discriminant validity of the scale.
Method
The following sections present information about the participants, procedures, and materials used in Study 1.
Participants
A total of 714 participants finished the online survey successfully. Responses were excluded from the final data set according to the following criteria: first, if the response time of the participant was under 150 seconds (3 excluded); second, if a repeated response pattern (e.g., marking only the middle response option for a specific questionnaire) was detected (106) excluded); and third, if participants themselves indicated at the end of the survey that their data should not be used for analysis (4 excluded). After data exclusion, responses from 601 participants (42% women, 58% men, mean age = 38 years, age range: 18–84) remained. Recruitment took place on Amazon Mechanical Turk. For participation, the participants were reimbursed with $0.60. Only workers from Amazon Mechanical Turk living in the United States were eligible to participate in the survey.
Procedure and Materials
Participants were asked to perform two tasks on one of two randomly assigned websites (see Figure 1). The first group received a link to an online shop, where they were asked to find a product of their liking and acquire information about the company’s return policy. The second group was given a link to a website that specializes in small loans. While using this website, the participants were asked to obtain information about loan costs and find out whether or not security is required when applying for a loan. These two websites were chosen in order to assess trust in a realistic setting. These two websites were both selected on the basis of the websites’ traffic and the websites’ ranking (data from www.alexa.com and www.similarweb.com) in the United States, as the target audience of the survey were inhabitants of the United States, and the aim was to select relatively unknown websites in order to prevent any biases from previous experiences. Upon returning to the survey, participants were asked to rate the website regarding trust (the TrustDiff semantic differential and a Likert-type Trust scale), usability, and visual aesthetics. Finally, general demographic questions were presented.
Table 1. Items of the Trust Questionnaire Examined in Study 1
|
Scale |
Item |
M |
SD |
Mdn |
S |
K |
|
Benevolence |
|
|
|
|
|
|
|
BEN1 |
ignoring – caring |
4.49 |
1.241 |
4 |
−0.04 |
−0.51 |
|
BEN2 |
malicious – benevolent |
4.49 |
1.253 |
4 |
−0.05 |
−0.28 |
|
BEN3 |
rude – cordial |
5.08 |
1.158 |
5 |
−0.27 |
−0.24 |
|
BEN4 |
insensitive – sensitive |
4.32 |
1.202 |
4 |
−0.03 |
0.18 |
|
BEN5 |
inconsiderate – empathic |
4.52 |
1.221 |
4 |
−0.11 |
−0.03 |
|
Integrity |
|
|
|
|
|
|
|
INT1 |
dishonest – honest |
4.82 |
1.356 |
5 |
−0.46 |
−0.13 |
|
INT2 |
insincere – sincere |
4.75 |
1.304 |
5 |
−0.45 |
0.07 |
|
INT3 |
dishonorable – honorable |
4.62 |
1.333 |
5 |
−0.22 |
−0.34 |
|
INT4 |
unbelievable – believable |
5.08 |
1.376 |
5 |
−0.71 |
0.18 |
|
INT5 |
untruthful – truthful |
4.93 |
1.364 |
5 |
−0.40 |
−0.36 |
|
INT6 |
fraudulent – credible |
5.06 |
1.432 |
5 |
−0.58 |
−0.26 |
|
Competence |
|
|
|
|
|
|
|
COM1 |
clueless – knowledgeable |
5.56 |
1.169 |
6 |
−0.91 |
1.04 |
|
COM2 |
incompetent – competent |
5.51 |
1.211 |
6 |
−0.75 |
0.33 |
|
COM3 |
unskilled – skillful |
5.39 |
1.178 |
5 |
−0.59 |
0.15 |
|
COM4 |
unqualified – proficient |
5.39 |
1.193 |
6 |
−0.70 |
0.45 |
|
COM5 |
incapable – capable |
5.55 |
1.196 |
6 |
−0.78 |
0.58 |
|
COM6 |
uninformed – informed |
5.48 |
1.204 |
6 |
−0.65 |
0.26 |
|
COM7 |
inexperienced – experienced |
5.60 |
1.221 |
6 |
−0.89 |
0.62 |
|
COM8 |
ineffective – effective |
5.51 |
1.244 |
6 |
−0.88 |
0.66 |
|
COM9 |
inept – resourceful |
5.43 |
1.225 |
6 |
−0.78 |
0.53 |
Note. M = Mean, SD = Standard deviation, Mdn = Median, S = Skew, K = Kurtosis. N = 601.

Figure 1. Screenshots from www.crazysales.com.au and www.sunshineloans.com.au at the time the study was conducted (February 2017).
Measures
All items from the below-mentioned questionnaires were presented in random order within their own subsection of the survey. All measures consisted of 7-point Likert-type scales ranging from 1 (strongly disagree) to 7 (strongly agree), unless otherwise noted.
TrustDiff
The 20 item-pairs of the initial version of the TrustDiff scale were presented as a semantic differential with seven steps between the antonym pairs. Seven steps were chosen because this corresponds to the commonly used 7-point Likert scale and because it has been successfully applied in other semantic differentials (e.g., Hassenzahl et al., 2003). Participants were instructed to rate the website owner (“Please rate the website owner on the following dimensions”).
Convergent Trust Scale
To assess the convergent validity, the 15 items of the trust questionnaire developed by Flavián et al. (2006) were included in the survey. Just like the TrustDiff scale, this Likert-type scale measures trust with the three subscales Benevolence, Integrity, and Competence. Slight modifications in the items’ declarative statements were carried out to better fit the measured website. The scale showed excellent internal consistency: Benevolence (Cronbach’s alpha, α = .90), Integrity (α = .90), and Competence (α = .90).
Visual Aesthetics
The discriminant validity of visual aesthetics was assessed, using 18 items of the VisAWI (Moshagen & Thielsch, 2010). To keep the analysis simple, all items were averaged in an overall aesthetics score. Internal consistency was excellent for this scale (Cronbach’s α = .96).
Usability Metric for User Experience
As an additional measure of discriminant validity, usability was measured using the four items of the Usability Metric for User Experience (UMUX; Finstad, 2010). Internal consistency of the scale was good (Cronbach’s alpha, α = .87).
Results
The full set of N = 601 was considered for the item analysis and exploratory factor analysis. A two-sample Kolmogorov-Smirnov test was conducted to ensure that the distributions in the data sets from each website did not differ significantly (D = 0.090, p = .169). The item analysis and reduction process followed three steps. First, the distribution statistics for each item were analyzed (see Table 1). Three items (COM1, COM7, COM8) showed a slight negative skew, suggesting a ceiling effect. For this reason and because Competence was measured using many items (9), they were excluded from further analysis.
Next, an exploratory factor analysis was conducted on the 17 remaining items with oblique rotation because factors were expected to be correlated. The Kaiser-Meyer-Olkin measure verified the sampling adequacy for the analysis, KMO = .97 (“marvelous” according to Hutcheson & Sofroniou, 1999), and all KMO values for individual items were greater than .95, which is well above the acceptable limit of .5 (Field, 2013). The Bartlett’s Test of sphericity, which tests the overall significance of all correlations within the correlation matrix, was significant, χ2(136) = 9533.923, p < .001, suggesting that the use of exploratory factor analysis is appropriate. In an initial analysis of the eigenvalues, only two factors had eigenvalues over Kaiser’s criterion of 1. However, the parallel analysis and the scree plot suggested that three factors used in combination explained 61% of the variance. The exploratory factor analysis was performed using three factors, as this solution is in line with the theoretical model of three subcomponents of trust. After the first exploratory analysis, a total of three items (BEN3, INT2, and INT3) were eliminated because they did not contribute to the factor structure and failed to meet the minimum criteria (Howard, 2016) of having a primary factor loading of .4 or above, and no cross-loading of .3 or above (see Table 2).
Table 2. Rotated Pattern Matrix of the Exploratory Factor Analysis in Study 1
|
Item |
Factor Loadings |
h2 |
||
|
Benevolence |
Integrity |
Competence |
||
|
BEN1: ignoring − caring |
.774 |
.079 |
.071 |
.767 |
|
BEN2: malicious − benevolent |
.616 |
.179 |
.054 |
.629 |
|
BEN3: rude − cordial |
.446 |
.070 |
.319 |
.530 |
|
BEN4: insensitive − sensitive |
.848 |
−.018 |
−.005 |
.691 |
|
BEN5: inconsiderate − empathic |
.860 |
.000 |
.016 |
.753 |
|
INT1: dishonest − honest |
.143 |
.849 |
−.076 |
.830 |
|
INT2: insincere − sincere |
.401 |
.508 |
.012 |
.741 |
|
INT3: dishonorable − honorable |
.472 |
.430 |
.042 |
.764 |
|
INT4: unbelievable − believable |
.086 |
.693 |
.082 |
.671 |
|
INT5: untruthful − truthful |
−.035 |
.732 |
.160 |
.701 |
|
INT6: fraudulent − credible |
−.035 |
.747 |
.205 |
.768 |
|
COM2: incompetent − competent |
−.047 |
.126 |
.823 |
.791 |
|
COM3: unskilled − skillful |
.099 |
−.084 |
.846 |
.707 |
|
COM4: unqualified − proficient |
−.004 |
.067 |
.828 |
.763 |
|
COM5: incapable − capable |
−.062 |
.114 |
.841 |
.793 |
|
COM6: uninformed − informed |
−.027 |
.076 |
.832 |
.760 |
|
COM9: inept − resourceful |
.125 |
−.145 |
.868 |
.699 |
|
Eigenvalues |
1.98 |
0.73 |
10.46 |
|
|
% of variance |
18 |
17 |
26 |
|
Note. Exploratory factor analysis with MINRES and oblimin. Factor loadings above .3 are marked in bold. Three factors explain 61% of the total variance. h2 = Communality, N = 601.
A second exploratory factor analysis of the remaining 14 items, again with the minimal residual (MINRES) method and oblimin rotation, was conducted. The three factors explained 74% of the variance. All items had primary loadings above .5 and load with their corresponding factor. The factor loadings are presented in Table 3, and the correlations between the factors are presented in Table 4. Finally, the reliability of each subscale was analyzed. Benevolence (α = .89), Integrity (α = .95), and Competence (α = .93) showed high internal consistency. No substantial increase in Cronbach’s alpha for any of the scales could have been achieved by eliminating more items.
Table 3. Results of the Second Exploratory Factor Analysis in Study 1
|
Item |
Factor Loadings |
h2 |
||
|
Benevolence |
Integrity |
Competence |
||
|
BEN1: ignoring − caring |
.785 |
.081 |
.059 |
.779 |
|
BEN2: malicious − benevolent |
.605 |
.174 |
.058 |
.611 |
|
BEN4: insensitive − sensitive |
.825 |
.005 |
−.014 |
.675 |
|
BEN5: inconsiderate − empathic |
.903 |
−.025 |
.009 |
.790 |
|
INT1: dishonest − honest |
.143 |
.877 |
−.113 |
.834 |
|
INT4: unbelievable − believable |
.074 |
.709 |
.060 |
.657 |
|
INT5: untruthful − truthful |
−.011 |
.762 |
.121 |
.714 |
|
INT6: fraudulent − credible |
−.030 |
.770 |
.173 |
.774 |
|
COM2: incompetent − competent |
−.040 |
.121 |
.822 |
.793 |
|
COM3: unskilled − skillful |
.087 |
−.065 |
.836 |
.700 |
|
COM4: unqualified − proficient |
−.002 |
.065 |
.827 |
.762 |
|
COM5: incapable − capable |
−.051 |
.097 |
.847 |
.795 |
|
COM6: uninformed − informed |
−.014 |
.055 |
.841 |
.764 |
|
COM9: inept − resourceful |
.114 |
−.142 |
.871 |
.693 |
|
Eigenvalues |
0.70 |
1.80 |
8.62 |
|
|
% of variance |
18 |
18 |
38 |
|
|
α |
.90 |
.92 |
.95 |
|
Note. Three factors explain 74% of the total variance. Factor loadings above .3 are marked in bold. N = 601.
Table 4. Correlations Between the Factors Extracted in Study 1
|
Factor |
Benevolence |
Integrity |
Competence |
|
Benevolence |
– |
|
|
|
Integrity |
.76 |
– |
|
|
Competence |
.52 |
.72 |
– |
Note. N = 601.
Convergent and Discriminant Validity
To assess convergent and discriminant validity, the correlations of the TrustDiff and related measures were explored. Table 5 shows that the TrustDiff scale correlates strongly (r = .68) with the trust questionnaire adapted from Flavián et al. (2006), thereby indicating convergent validity. The TrustDiff scale was found to correlate with visual aesthetics as well as usability (r = .46 and r = .50, respectively). Interestingly, the subscale Benevolence was less strongly related to visual aesthetics and usability than the other subscales (r = .33 and r = .34 compared to correlations in the range of .41−.57). These differences between the correlations were statistically significant (t = -2.6 to -5.74, p < .05).
Table 5. Descriptive Statistics and Pearson Correlations of Measures in Study 1
|
|
M |
SD |
1. |
2. |
3. |
4. |
5. |
6. |
7. |
8. |
9. |
10. |
|
TrustDiff |
|
|
|
|
|
|
|
|
|
|
|
|
|
1. Benevolence |
4.45 |
1.08 |
– |
|
|
|
|
|
|
|
|
|
|
2. Integrity |
4.97 |
1.24 |
.74 |
– |
|
|
|
|
|
|
|
|
|
3. Competence |
5.46 |
1.07 |
.55 |
.72 |
– |
|
|
|
|
|
|
|
|
4. Total |
4.96 |
1.00 |
.86 |
.94 |
.85 |
– |
|
|
|
|
|
|
|
Flavián et al. (2006) |
|
|
|
|
|
|
|
|
|
|
|
|
|
5. Benevolence |
4.79 |
1.21 |
.60 |
.66 |
.54 |
.68 |
– |
|
|
|
|
|
|
6. Integrity |
4.83 |
1.18 |
.54 |
.69 |
.54 |
.67 |
.86 |
– |
|
|
|
|
|
7. Competence |
5.24 |
1.18 |
.36 |
.47 |
.57 |
.53 |
.75 |
.78 |
– |
|
|
|
|
8. Total |
4.95 |
1.11 |
.54 |
.65 |
.59 |
.68 |
.93 |
.95 |
.91 |
– |
|
|
|
9. VisAWI |
4.74 |
1.22 |
.33 |
.41 |
.47 |
.46 |
.46 |
.48 |
.49 |
.51 |
– |
|
|
10. UMUX |
5.42 |
1.21 |
.34 |
.47 |
.53 |
.50 |
.48 |
.51 |
.55 |
.55 |
.75 |
– |
Note. N = 601. All correlations are significant with p < .001.
Discussion
In Study 1, 14 items measuring three related subcomponents of trust were identified. A comparative analysis of the correlation values for the TrustDiff and related measures delivers a first test of convergent validity. Comparatively low correlations of the TrustDiff with visual aesthetics and usability measures indicate discriminant validity. The results of the second exploratory factor analysis support a three-dimensional measure with high reliability and good psychometric properties. The TrustDiff measurement model was tested and refined in Study 2. The ability of the final TrustDiff model to differentiate between two manipulated websites was investigated in Study 3.
Study 2
The goal of Study 2 was to test the proposed three-dimensional factor structure with an independent sample and to identify items that could be removed to make the questionnaire more economical.
Method
The following sections present information about the participants, the procedures, measures, and the type of technology used in Study 2.
Participants
A total of 315 participants from the United States completed the relevant part of the survey on Mechanical Turk. Three participants had to be excluded because they indicated that we should not use their data, resulting in a final sample of N = 312 (55% women, 44% men, 1% other or not disclosed; mean age = 37.6 years, age range: 18–76).
Procedure and Measures
As part of a larger study, participants were asked to name a single interactive technology they use frequently. Participants indicated how often they had used this particular technology over the last 14 days. The rest of the online survey focused on this particular technology, and the 14 items of the TrustDiff scale in Study 1 were included. As in Study 1, the word pairs were presented in random order.
Type of Technology and Frequency of Use
The most frequently mentioned technology was Facebook (42.7%), followed by other social media (Twitter 7.4%, Instagram 7.1%, YouTube 3.5%), Fitbit (3.2%), Microsoft Word or Excel (respectively, 2.6% and 1.9%), and various other technologies, such as Mechanical Turk, web browser, Amazon Alexa, digital games, and mobile apps. A vast majority of participants indicated that they used technology multiple times per day (84.6%). Almost 44% indicated that they used the technology six or more times per day.
Results and Discussion
As a test of the three-dimensional factor structure, a confirmatory factor analysis (CFA) was conducted using the lavaan package (0.5–23.1097) for R. All items were specified to load on their designated factor, and the loading of the first item was constrained to one. Multivariate normality was not given (Mardia tests: χ2 = 2474.4, p < .001; Zk = 50.6, p < .001); therefore, we used a robust maximum likelihood estimation method with Huber-White standard errors and a Yuan-Bentler-based scaled test statistic. Results of the CFA including all 14 items suggested that the proposed model fits the data adequately but not perfectly: χ2(74) = 140.530, p < .001, χ2/df = 1.89, CFI = .971, SRMR = .047, RMSEA = .054, PCLOSE = .279. All loadings of the latent factors on their designated items exceeded .80, except for item BEN2 (.68). Investigation of the modification indices indicated covariance between items COM4 and COM5, as well as between COM4 and COM6, and suggested a loading of Competence on INT6 to improve model fit. However, because the goal was to create an economic scale for user trust with three subscales, certain items have been removed instead of allowing cross-loadings for a better model fit. Thus, item BEN2 (malicious – benevolent) was removed because of low loadings of the Benevolence factor, INT6 (fraudulent – credible) was removed to reduce a possible influence of Competence on Integrity, and Item COM6 (uninformed – informed) was primarily removed on theoretical grounds. The aspect of how informed a vendor of a product is seems to be less related to other aspects of Competence such as Capability, Qualifications, and Resources. The item COM3 (unskilled – skillful) was removed, because it has too much statistical and theoretical overlap with item COM4 (unqualified – proficient).
The final scale was reduced to 10 items, measuring the three related but distinct dimensions and showed excellent psychometric properties: χ2(32) = 32.500, p = .442, χ2/df = 1.02, CFI = 1.000, SRMR = .027, RMSEA = .007, PCLOSE = .996. Descriptive statistics of the final 10-item TrustDiff scale are depicted in Table 6, and the measurement model is shown in Figure 2. Internal consistency of the three subscales was high (αBen = .85, αInt = .90, αCom = .91) as well as the reliability of the overall scale (ωh = .87, α = .95, and ωt = .97).
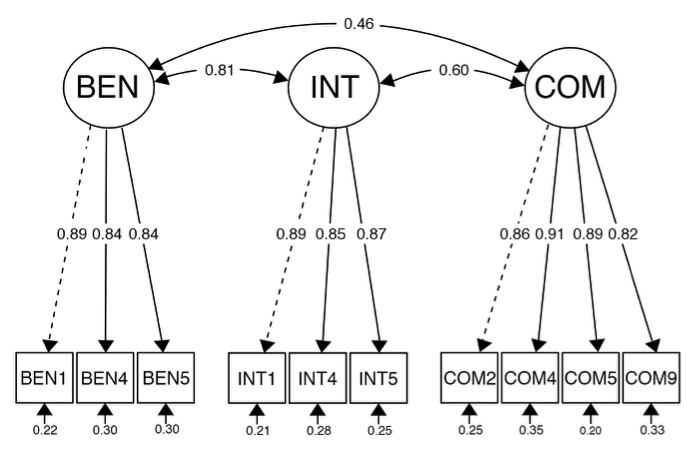
Figure 2. Measurement model of the TrustDiff scale in Study 2 with standardized loadings. Dotted lines indicate loadings that were constrained to one: χ2(32) = 32.500, p = .442, χ2/df = 1.02, CFI = 1.000, SRMR = .027, RMSEA = .007, PCLOSE = .996.
Table 6. Descriptive Statistics and Pearson Correlations of All Items for the Final TrustDiff scale in Study 2
|
|
M |
SD |
1. |
2. |
3. |
4. |
5. |
6. |
7. |
8. |
9. |
10. |
|
1. BEN1: |
4.43 |
1.39 |
– |
|
|
|
|
|
|
|
|
|
|
2. BEN4: |
4.27 |
1.38 |
0.74 |
– |
|
|
|
|
|
|
|
|
|
3. BEN5: |
4.46 |
1.37 |
0.74 |
0.71 |
– |
|
|
|
|
|
|
|
|
4. INT1: |
4.78 |
1.47 |
0.64 |
0.59 |
0.61 |
– |
|
|
|
|
|
|
|
5. INT4: |
5.06 |
1.50 |
0.59 |
0.56 |
0.56 |
0.76 |
– |
|
|
|
|
|
|
6. INT5: |
4.68 |
1.45 |
0.65 |
0.59 |
0.59 |
0.78 |
0.72 |
– |
|
|
|
|
|
7. COM2: |
5.79 |
1.24 |
0.34 |
0.29 |
0.30 |
0.40 |
0.50 |
0.46 |
– |
|
|
|
|
8. COM4: |
5.64 |
1.31 |
0.34 |
0.29 |
0.32 |
0.37 |
0.48 |
0.39 |
0.69 |
– |
|
|
|
9. COM5: |
5.81 |
1.29 |
0.40 |
0.34 |
0.41 |
0.47 |
0.52 |
0.49 |
0.77 |
0.73 |
– |
|
|
10. COM9: |
5.79 |
1.34 |
0.36 |
0.27 |
0.30 |
0.36 |
0.48 |
0.42 |
0.72 |
0.68 |
0.72 |
– |
Note. N = 312. All correlations are significant p < .001.
The results of these two confirmatory factor analyses showed that the questionnaire could be improved and shortened without losing reliability. The final model for the 10-item TrustDiff scale presents an excellent fit with high internal consistency. However, because participants were asked to report their TrustDiff evaluations with regard to a technology that they frequently used, it is likely that there was at least sufficient trust in the selected technology not to abandon it. In a next step, an experiment was conducted to investigate the criterion validity of the scale and the confirmatory factor analysis was repeated with the goal of replicating the measurement model.
Study 3
The goal of Study 3 was to test whether the TrustDiff scale would be able to differentiate between two websites that were manipulated regarding their trust-related features.
Method
The following sections provide information about the participants, procedures, materials, and measures used in Study 3.
Participants
A total of 394 participants from the United States completed the relevant part of the survey on the crowdsourcing platform CrowdFlower. The data were cleaned using two attention check items that reduced the sample size to 258. Six additional participants had to be excluded because they indicated that we should not use their data, resulting in a final sample of N = 252 (71% women, 28% men, 1% other or not disclosed; mean age = 39 years, age: 18–78).
Procedure and Materials
As part of a larger research project, but unrelated to Study 1 or Study 2, participants were asked to rate a mock online shop based on a screenshot provided.
The participants were randomly assigned into two groups. The first group was presented with a screenshot of an online shop that included several trust-supporting elements (high trust), and the second group received a screenshot of an online shop that lacked any trust-supporting elements (neutral; see Figure 3). In order to simulate a real internet shop, graphic design, structure design, content design, and social-cue design elements were manipulated (see Table 7) according to the elements identified by Seckler et al. (2015) and Wang and Emurian (2005).
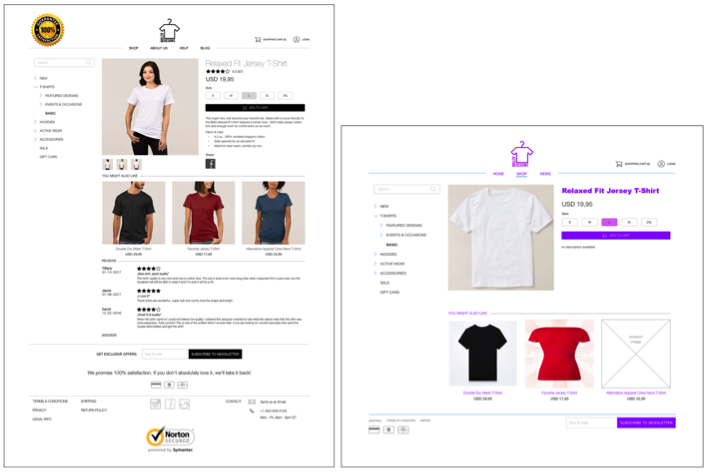
Figure 3. Mock online shop with trust-related features (left) and without (right) used in the experiment in Study 2.
Table 7. Overview of the Dimensions and Respective Features Manipulated in the Mock Online Shop
|
Dimension |
High-Trust |
Neutral |
|
Graphic design |
Muted colors, high contrast |
Bright colors, lower contrast |
|
|
Well-chosen and well-shot photographs |
Inconsistent and missing photographs |
|
Content design |
Satisfaction guarantee |
No satisfaction guarantee |
|
|
Links to more information in the footer, clearly readable |
Hard to read or lacking information |
|
|
Link to the privacy policy |
No link visible |
|
|
Seals of approval or third-party certificate |
No seals of approval or third-party certificates |
|
|
Comprehensive, correct, and current product information |
No product information |
|
Social-cue design |
Contact information for customer service in the footer |
No contact information |
|
|
Users’ reviews visible |
Lack of users’ reviews |
After examining the website screenshot for at least four seconds, participants were asked to complete the TrustDiff questionnaire, the Likert-type scale for trust by Flavián et al. (2006), and to rate the visual appeal and perceived usability of the website. All measures were presented as in Study 1. The data collected for this part of Study 3 were used to assess whether the TrustDiff scale had the capacity to differentiate between high and neutral trustworthiness.
Measures
The 10 word-pairs of the final TrustDiff scale were included together with 15 items of the Trust scale developed by Flavián et al. (2006) and 18 items of the VisAWI measure for visual aesthetics from Moshagen and Thielsch (2010; Cronbach’s alpha, α = .95). Unlike Study 1, only the overall score of the Trust scale from Flavián et al. (2006) was included in the analysis (Cronbach’s α = .96). All three subscales of the TrustDiff measure showed excellent internal consistency (αBen = .86, αInt = .90, αCom = .94). As with Study 1 and Study 2, 7-point scales were employed, and the items were presented randomly.
Results
On average, participants viewed the websites for 1.47 minutes (SD = 1.4, min = 13.8 seconds, max = 14.08 minutes). No significant differences in viewing time (log-transformed) were observed between the conditions, t(246.88) = 0.073065, p = .9418. All values measured deviated significantly from a normal distribution, and therefore Welch’s two sample t-test and robust Wilcoxon rank-sum tests were conducted. Both tests led to the same conclusions for all measures, so we decided to list only the results of the Welch’s t-test. Criterion validity was investigated by comparing the high-trust condition with the neutral condition. As presented in Table 8, Welch’s two sample t-tests yielded significant differences between the conditions for all subscales of the TrustDiff measure and the total score: t(230.1) = 6.577, p < .001, d = 0.84. The Likert-type scale for trust (Flavián et al., 2006) also showed a significant difference between the two conditions: t(228.8) = 6.470, p < .001, d = 0.82. The difference between both websites was even more pronounced for aesthetics, which was generally rated lower by the participants: t(247.7) = 7.037, p < .001, d = 0.89.
In addition to the test of the validity criterion, the analysis conducted in Study 2 was repeated in order to investigate whether the structure of the questionnaire could be replicated in a different context. The confirmatory factor analysis was run using the lavaan package (0.6.6) for R. All items were specified to load on their designated factor, and the loading of the first item was constrained to one. Multivariate normality was not given (Mardia tests: χ2 = 1441.0, p < .001; Zk = 49.7, p < .001); therefore, we used a robust maximum likelihood estimation method with Huber-White standard errors and a Yuan-Bentler based scaled test statistic. Results of the CFA that included all 10 items indicated that the proposed model fits the data well: χ2(32) = 42.985, p = .093, χ2/df = 1.34, CFI = .990, SRMR = .028, RMSEA = .037, PCLOSE = .864. However, high covariances between the latent variables Benevolence, Integrity, and Competence (0.86–0.89) implied that a one-factor model might also be appropriate. A comparison between the three-factor model and a one-factor model (all items loading on an overall trust factor) showed that the one-factor model had a significantly worse fit: χ2diff = 40.546, p < .001. Thus, we decided to retain the three-factor model on both statistical as well as theoretical grounds.
Table 8. Descriptive Statistics and Results of Welch’s Two Sample T-Test as an Assessment of the Criterion Validity of the TrustDiff Scale
|
|
High trust (n = 128) |
Neutral (n = 124) |
|
||||||
|
M |
SD |
M |
SD |
t |
df |
p |
d |
||
|
TrustDiff |
Benevolence |
5.01 |
0.962 |
4.28 |
1.075 |
5.681 |
245.0 |
< .001 |
0.72 |
|
|
Integrity |
5.48 |
0.993 |
4.75 |
1.199 |
5.210 |
238.7 |
< .001 |
0.66 |
|
|
Competence |
5.58 |
1.011 |
4.47 |
1.455 |
6.989 |
218.6 |
< .001 |
0.89 |
|
|
Total |
5.37 |
0.899 |
4.50 |
1.176 |
6.577 |
230.1 |
< .001 |
0.84 |
|
|
Trust* |
5.11 |
0.947 |
4.20 |
1.254 |
6.470 |
228.8 |
< .001 |
0.82 |
|
|
VisAWI |
4.91 |
1.094 |
3.91 |
1.167 |
7.037 |
247.7 |
< .001 |
0.89 |
Note. N = 252. *Likert-type Trust scale by Flavián et al. (2006).
General Discussion
The aim of this project was to develop and validate a scale for measuring trust in online contexts using a semantic differential. Scale construction is an important step in confirmatory research because the quality of a measurement scale determines the extent to which empirical results are meaningful and accurate (Bhattacherjee, 2002).
The main contribution of the TrustDiff scale is two-fold: First, as a semantic differential, it ensures broad applicability for measuring user trust on the web. As discussed earlier, the majority of existing trust questionnaires make use of the Likert-type items that are mostly tailored to the specific website measured in the respective study; consequently, they cannot be readily adapted to other research contexts (e.g., Lu et al., 2012; McKnight et al., 2002a). The pairs of antonyms used in the TrustDiff scale, however, are adjectives that generally apply to numerous contexts related to user trust on the web. Second, each item of the TrustDiff scale contains only two words (a one item-pair), namely opposite adjectives, that are easier to translate into other languages than full sentences. The declarative statements used in Likert-scale items from other trust scales (e.g., Bhattacherjee, 2002; Cho, 2006; Flavián et al., 2006; Gefen, 2002; McKnight et al., 2002a), however, are often complex and time-consuming to translate. Overall, the TrustDiff scale has considerable advantages over other trust scales: its broader and easier applicability in different contexts and languages, its capacity to minimize potential loss of reliability and validity, and its ability to measure manifestations of trust using a single scale that covers negative and positive evaluations. International firms whose online services are available across numerous countries and languages might profit from a universally applicable trust scale. A company is at risk of losing its viability if it fails to assess consumers’ trust in its services, especially when its revenue structure depends on a sustained rate of user transactions. An early identification of users with low trust levels may help companies ensure their customer retention rates by targeting this group with specialized interventions.
Based on existing literature, 28 positive adjectives with up to three antonyms for the three dimensions of trust (Benevolence, Integrity, and Competence) were generated. These items were tested for appropriate linguistic and psychological bipolarity and were reduced to 20 item pairs. Results from factor analysis in Study 1 (N = 601) suggested a 14-item scale measuring three distinct but related dimensions of trust. The trust dimensions of the 14-item TrustDiff scale were relatively highly correlated with a Likert-type trust scale and were less pronounced but still substantially correlated with perceived usability and aesthetics. In Study 2, the 14-items questionnaire measurement model was tested with 312 participants rating various frequently used technologies. Results of a confirmatory factor analysis suggested several avenues for improvement that resulted in a 10-item scale for trust with good psychometric properties. This measurement model could be replicated with an independent confirmatory factor analysis in Study 3. Moreover, the results of Study 3 showed that the TrustDiff scale is sensitive to websites with differences in trust-related features. The rating differences between the two websites were between d = 0.66 and 0.89, commonly interpreted as between moderate to large (Cohen, 1977). Compared to existing questionnaires that are context specific (e.g., McKnight et al., 2002a) or developed in other languages (e.g., Flavián et al., 2006), the TrustDiff scale can be applied in various contexts and has been tested with English-speaking participants. From a practitioner standpoint, the 10-item TrustDiff scale can be used without modifications to assess customers’ level of trust in an enterprise or service and may be translated relatively easily into other languages.
The three studies presented here entailed performing an initial thorough validation of the TrustDiff scale. Although the scale offers promising psychometric properties, it needs to be further tested with various products and services in different contexts. However, the 10-item scale was shown to have very good psychometric properties with a large variety of technologies in Study 2 and for the mockup websites in Study 3. The structure of the TrustDiff scale used in these studies needs further investigation in different cultural contexts and with languages other than English. For this task, a semantic differential is ideal, as it demands less translation input compared to the traditional Likert-type scales. However, it is nevertheless essential that psychometric bipolarity and structural validity are established in other languages. In addition, some studies have highlighted a number of possible limitations with semantic differentials, which may also need to be considered for the TrustDiff scale. More than 50 years ago, Heise (1969) emphasized that semantic differential scales can be susceptible to social desirability effects and that it is difficult to account for variations due to temporal factors, individual differences in response variation, or individual assessments of the semantic space. Mordkoff (1963) found that some semantic differential scales contained adjective-pairs that are not real opposites, highlighting a fundamental challenge when constructing semantic differential scales: the problematics of selecting psychologically opposed pairs of words. In a more recent study, Kulas and Stachowski (2009) described a problem with middle category responses on Likert scales that are often thought of as “neutral” responses but sometimes mean “it depends.” Although the Likert scales were examined in this study, similar problems could also occur with semantic differential scales. Based on such questions, Stoklasa et al. (2019) proposed a more elaborate approach to semantic differentials. Applying a modified procedure for data collection and a novel method that takes linguistic uncertainty into account, they argued that their approach allows for a more appropriate reflection of the meaning of concepts. While the use of a more sophisticated method of analysis is a worthwhile next step, there are also a number of practical research questions that could be explored with the TrustDiff scale. For instance, the scale could be used to investigate how different web design elements relate to the different dimensions of trust or distrust, because the present questionnaire represents the construct trust on a negative to positive axis on three subscales. Furthermore, to build a comprehensive picture of user trust and trust-related behaviors, the TrustDiff scale could be combined with measures of trust in a technology. Trust in a technology has been found to be related to the intention to explore and to use more features of the respective technology (McKnight et al., 2011). This vendor-technology trust distinction could be particularly helpful to better understand the relative influence that these dimensions have in the adoption of a technology, post-adoption use, and the abandonment of a technology. Ultimately, researchers could investigate the predictive power of the TrustDiff scale regarding the trust-related behavior of users and how it may relate to antecedents of trust. For instance, interface language quality, which is a major issue in multilingual software projects (e.g., Bargas-Avila & Brühlmann, 2016), could influence user trust in vendors. Additionally, the wording of the TrustDiff scale is not exclusive to the web context because many of the items might have face-validity in other settings. For instance, the validity of the TrustDiff scale could be investigated in areas of interpersonal trust, trust in virtual assistants, or offline buyer-seller relationships. A no less promising project would be an attempt to discover user profiles based on an analysis of their responses using the scale. This might allow researchers and practitioners to design and evaluate trust-related interventions targeted at specific subgroups.
Conclusion
We present the development and validation of a semantic differential that helps to evaluate user trust and potentially serves as a tool to investigate how user trust emerges. The development and validation followed best practices, and the scale can be readily applied to a variety of research questions. The TrustDiff scale was tested with over 1,000 participants and was demonstrated to possess good psychometric properties and high reliability. The semantic differential is easy-to-use and easy-to-translate, and is thus a viable alternative to Likert-scale format questionnaires for assessing user trust.
Tips for Usability Practitioners
When assessing user trust, practitioners should consider using a standardized questionnaire.
- Standardized questionnaires have known properties regarding the reliability and validity of the measure when compared to ad hoc questionnaires.
- The TrustDiff scale can be used to evaluate user trust in an online vendor; however, it may not be sufficient to identify trust-related problems in an interface.
- The ten pairs of adjectives of the TrustDiff scale can be quickly assessed by participants and are therefore an efficient measure for the three dimensions of trust.
- The TrustDiff scale can be used to repeatedly assess user perceptions regarding website or product changes.
- In comparison to questionnaires that are tailored to a specific context such as e-commerce, the TrustDiff scale can be used in a variety of situations.
Acknowledgements
Special thanks to Sebastian Perrig and Elisa Mekler. This work has been approved by the Institutional Review Board of the Faculty of Psychology, University of Basel under the numbers D-003-17 and M-003-17.
References
Bargas-Avila, J. A., & Brühlmann, F. (2016). Measuring user rated language quality: Development and validation of the user interface language quality survey (LQS). International Journal of Human-Computer Studies, 86, 1–10. doi: 10.1016/j.ijhcs.2015.08.010
Bart, Y., Shankar, V., Sultan, F., & Urban, G. L. (2005). Are the drivers and role of online trust the same for all web sites and consumers? A large-scale exploratory empirical study. Journal of Marketing, 69(4), 133–152. doi: 10.1509/jmkg.2005.69.4.133
Bhattacherjee, A. (2002). Individual trust in online firms: Scale development and initial test. Journal of Management Information Systems, 19(1), 211–241. doi: 10.1080/07421222.2002.11045715
Casaló, L. V., Flavián, C., & Guinalíu, M. (2007). The role of security, privacy, usability and reputation in the development of online banking. Online Information Review, 31(5), 583–603. doi: 10.1108/14684520710832315
Chen, S. C., & Dhillon, G. S. (2003). Interpreting dimensions of consumer trust in e-commerce. Information Technology and Management, 4(2), 303–318. doi: 10.1023/A:1022962631249
Chin, W. W., Johnson, N., & Schwarz, A. (2008). A fast form approach to measuring technology acceptance and other constructs. MIS Quarterly, 32(4), 687–703. doi: 10.2307/25148867
Cho, J. (2006). The mechanism of trust and distrust formation and their relational outcomes. Journal of Retailing, 82(1), 25–35. doi: 10.1016/j.jretai.2005.11.002
Cohen, J. (1977). Statistical power analysis for the behavioral sciences (revised edition). Academic Press. doi: 10.2307/2286629
Corbitt, B. J., Thanasankit, T., & Yi, H. (2003). Trust and e-commerce: A study of consumer perceptions. Electronic Commerce Research and Applications, 2(3), 203–215. doi: 10.1016/s1567-4223(03)00024-3
Driscoll, J. W. (1978). Trust and participation in organizational decision making as predictors of satisfaction. Academy of Management Journal, 21(1), 44–56. doi: 10.2307/255661
Field, A. (2013). Discovering statistics using IBM SPSS statistics. SAGE Publications.
Finstad, K. (2010). The usability metric for user experience. Interacting with Computers, 22(5), 323–327. doi: 10.1016/j.intcom.2010.04.004
Flavián, C., Guinalíu, M., & Gurrea, R. (2006). The role played by perceived usability, satisfaction and consumer trust on website loyalty. Information & Management, 43(1), 1–14. doi: 10.1016/j.im.2005.01.002
Friborg, O., Martinussen, M., & Rosenvinge, J. H. (2006). Likert-based vs. semantic differential-based scorings of positive psychological constructs: A psychometric comparison of two versions of a scale measuring resilience. Personality and Individual Differences, 40(5), 873–884. doi: 10.1016/j.paid.2005.08.015
Gefen, D. (2002). Reflections on the dimensions of trust and trustworthiness among online consumers. ACM Sigmis Database, 33(3), 38–53. doi: 10.1145/569905.569910
Gefen, D., Karahanna, E., & Straub, D. W. (2003). Trust and TAM in online shopping: An integrated model. MIS Quarterly, 27(1), 51–90. doi: 10.2307/30036519
Hassenzahl, M., Burmester, M., & Koller, F. (2003). Attrakdiff: Ein Fragebogen zur Messung wahrgenommener hedonischer und pragmatischer Qualität. In Mensch & Computer 2003 (pp. 187–196). Springer. doi: 10.1007/978-3-322-80058-919
Hawkins, D. I., Albaum, G., & Best, R. (1974). Stapel scale or semantic differential in marketing research? Journal of Marketing Research, 11(3), 318–322. doi: 10.2307/3151152
Heise, D. R. (1969). Some methodological issues in semantic differential research. Psychological Bulletin, 72(6), 406–422. doi: doi.org/10.1037/h0028448
Hong, I. B., & Cho, H. (2011). The impact of consumer trust on attitudinal loyalty and purchase intentions in b2c e-marketplaces: Intermediary trust vs. seller trust. International Journal of Information Management, 31(5), 469–479. doi: 10.1016/j.ijinfomgt.2011.02.001
Howard, M. C. (2016). A review of exploratory factor analysis decisions and overview of current practices: What we are doing and how can we improve? International Journal of Human-Computer Interaction, 32(1), 51–62. doi: 10.1080/10447318.2015.1087664
Howard, M. C., & Melloy, R. C. (2016). Evaluating item-sort task methods: The presentation of a new statistical significance formula and methodological best practices. Journal of Business and Psychology, 31(1), 173–186. doi: 10.1007/s10869-015-9404-y
Hutcheson, G. D., & Sofroniou, N. (1999). The multivariate social scientist: Introductory statistics using generalized linear models. Sage. doi: 10.4135/9780857028075
Jarvenpaa, S. L., Tractinsky, N., & Saarinen, L. (1999). Consumer trust in an internet store: A cross-cultural validation. Journal of Computer-Mediated Communication, 5(2), 0–0. doi: 10.1111/j.1083-6101.1999.tb00337.x
Jian, J.-Y., Bisantz, A. M., & Drury, C. G. (2000). Foundations for an empirically determined scale of trust in automated systems. International Journal of Cognitive Ergonomics, 4(1), 53–71. doi: 10.21236/ada388787
Kim, Y., & Peterson, R. A. (2017). A meta-analysis of online trust relationships in e-commerce. Journal of Interactive Marketing, 38(Supplement C), 44–54. doi: 10.1016/j.intmar.2017.01.001
Koufaris, M., & Hampton-Sosa, W. (2004). The development of initial trust in an online company by new customers. Information & Management, 41(3), 377–397. doi: 10.1016/j.im.2003.08.004
Kulas, J. T., & Stachowski, A. A. (2009). Middle category endorsement in odd-numbered Likert response scales: Associated item characteristics, cognitive demands, and preferred meanings. Journal of Research in Personality, 43(3), 489-493.
Lee, M. K., & Turban, E. (2001). A trust model for consumer internet shopping. International Journal of Electronic Commerce, 6(1), 75–91. doi: 10.1080/10864415.2001.11044227
Lewicki, R. J., & Brinseld, C. (2012). Measuring trust beliefs and behaviours. In F. Lyon, G. Mollering, & M. N. K. Saunders (Eds.), Handbook of research methods on trust (pp. 29–39). Edward Elgar Publishing. doi: 10.4337/9780857932013.00011
Lu, J., Wang, L., & Hayes, L. A. (2012). How do technology readiness, platform functionality and trust influence C2C user satisfaction? Journal of Electronic Commerce Research, 13(1), 50–69.
Mayer, R. C., Davis, J. H., & Schoorman, F. D. (1995). An integrative model of organizational trust. Academy of Management Review, 20(3), 709–734. doi: 10.2307/258792
McCroskey, J. C., & Teven, J. J. (1999). Goodwill: A reexamination of the construct and its measurement. Communications Monographs, 66(1), 90–103. doi: 10.1080/03637759909376464
McKnight, D. H., Carter, M., Thatcher, J. B., & Clay, P. F. (2011, July). Trust in a specific technology: An investigation of its components and measures. ACM Transactions on Management Information Systems, 2(2), 12:1–12:25. doi: 10.1145/1985347.1985353
McKnight, D. H., Choudhury, V., & Kacmar, C. (2002a). Developing and validating trust measures for e-commerce: An integrative typology. Information Systems Research, 13(3), 334–359. doi: 10.1287/isre.13.3.334.81
McKnight, D. H., Choudhury, V., & Kacmar, C. (2002b). The impact of initial consumer trust on intentions to transact with a web site: A trust building model. The Journal of Strategic Information Systems, 11(3), 297–323. doi: 10.1016/s0963-8687(02)00020-3
Moorman, C., Deshpande, R., & Zaltman, G. (1993, January). Factors affecting trust in market research relationships. Journal of Marketing, 81–101. doi: 10.2307/1252059
Mordkoff, A. M. (1963). An Empirical Test of Functional Antonymy of Semantic Differential Scales. Journal of Memory and Language, 2(5), 504–509.
Moshagen, M., & Thielsch, M. T. (2010). Facets of visual aesthetics. International Journal of Human-Computer Studies, 68(10), 689–709. doi: 10.1016/j.ijhcs.2010.05.006
Némery, A., & Brangier, E. (2014). Set of Guidelines for Persuasive Interfaces: Organization and Validation of the Criteria. Journal of Usability Studies, 9(3), 105–128.
Pavlou, P. A., & Gefen, D. (2004). Building effective online marketplaces with institution-based trust. Information Systems Research, 15(1), 37–59. doi: 10.1287/isre.1040.0015
Rieser, D. C., & Bernhard, O. (2016). Measuring trust: The simpler the better? In Proceedings of the 2016 CHI Conference Extended Abstracts on Human Factors in Computing Systems (pp. 2940–2946). New York, NY, USA: ACM. doi: 10.1145/2851581.2892468
Rotter, J. B. (1967). A new scale for the measurement of interpersonal trust. Journal of Personality, 35(4), 651–665. doi: 10.1111/j.1467-6494.1967.tb01454.x
Safar, J. A., & Turner, C. W. (2005). Validation of a two factor structure for system trust. In Proceedings of the Human Factors and Ergonomics Society Annual Meeting (Vol. 49, No. 3, pp. 497-501). Los Angeles, CA: SAGE Publications. doi: 10.1177/154193120504900360
Sauro, J. (2015). SUPR-Q: A comprehensive measure of the quality of the website user experience. Journal of Usability Studies, 10(2), 68–86.
Seckler, M., Heinz, S., Forde, S., Tuch, A. N., & Opwis, K. (2015). Trust and distrust on the web: User experiences and website characteristics. Computers in Human Behavior, 45, 39–50. doi: 10.1016/j.chb.2014.11.064
Stoklasa, J., Talášek, T., & Stoklasová, J. (2019). Semantic differential for the twenty-first century: scale relevance and uncertainty entering the semantic space. Quality & Quantity, 53(1), 435–448. doi: 10.1007/s11135-018-0762-1
Van Auken, S., & Barry, T. E. (1995). An assessment of the trait validity of cognitive age measures. Journal of Consumer Psychology, 4(2), 107–132. doi: 10.1207/s15327663jcp040202
van der Werff, L., Real, C., & Lynn, T. (2018). Individual trust and the internet. In R. H. Searle, A.-M. I. Nienaber, & S. B. Sitkin (Eds.), The Routledge Companion to Trust. Routledge. doi: 10.4324/9781315745572
Verhagen, T., van Den Hooff, B., & Meents, S. (2015). Toward a better use of the semantic differential in IS research: An integrative framework of suggested action. Journal of the Association for Information Systems, 16(2), 108–143. doi: 10.17705/1jais.00388
Wang, Y. D., & Emurian, H. H. (2005). An overview of online trust: Concepts, elements, and implications. Computers in Human Behavior, 21(1), 105–125. doi: 10.1016/j.chb.2003.11.008
Wirtz, J., & Lee, M. C. (2003). An examination of the quality and context-specific applicability of commonly used customer satisfaction measures. Journal of Service Research, 5(4), 345–355. doi: 10.1177/1094670503005004006