Abstract
A loyal customer base depends upon a good user experience over the product’s complete lifetime. Successful products are continuously developed over a long period. Their functionality and complexity typically grow over years, so it is important to measure their user experience continuously. A carefully selected, effective questionnaire can collect quantitative results. But with so many established UX questionnaires available, it is often difficult to choose a suitable one for a specific project. The task becomes more complex if different UX questionnaires are used and results must be compared. It is essential to understand the relationship between user experience data collected with different questionnaires.
We investigated three common user experience questionnaires, SUS, UMUX-LITE, and UEQ-S, used to evaluate four common products in an online study of 435 participants: Netflix®, PowerPoint® (PPT), Zoom®, and BigBlueButton™ (BBB). In this way, the measured scale scores of the questionnaires could be compared for these products. Results showed SUS and UMUX-LITE scores as nearly identical for all four products. For usability or UX quality, we found that the selection of the survey has only a limited impact, but for overall UX quality there were clear differences between SUS, UMUX-LITE, and UEQ-S.
Keywords
User experience, usability, UX measurement, UX questionnaires, System Usability Scale, SUS, User Experience Questionnaire, UEQ-S, Usability Metric for User Experience, UMUX-LITE
Introduction
To be competitive in the market, a product needs to offer, at a minimum, a sufficient user experience quality. If this is not the case, the user base will shrink, especially for cloud-based products which allow their users to switch to competitors with low effort. Thus, it is important to constantly measure the UX of a product to check how the UX develops over time.
Many complex products, especially business software, contain numerous screens that support many application scenarios. Time and resource constraints however make it nearly impossible to use expert evaluations or usability tests for constantly monitoring the usability or UX quality of the product. The preferred solution for such products is to integrate a feedback button or link into the application that points to an online survey or to send invitations to participate in online surveys by email campaigns. This allows contacting many users with relatively low effort. Typically, such surveys contain a standard UX questionnaire that measures UX quantitatively, captures some information about the participant, and allows users to enter comments or suggestions to improve the product (Schrepp, 2021).
Standard UX questionnaires suitable for such online surveys must be relatively short, especially when they are launched directly in the product over a feedback button or link. Otherwise, users might not complete them (Vicente & Reis, 2010). SUS, UMUX-LITE, and UEQ-S are three UX questionnaires that are frequently used in such scenarios. They are sufficiently short and are general enough to be used for many different types of products.
This article investigates the dependency between three UX questionnaires, SUS, UMUX-LITE, and UEQ-S, through evaluating four products: Netflix®, Microsoft® PowerPoint® (PPT), Zoom®, and BigBlueButton™ (BBB). We present similarities and differences in the results.
Investigated Questionnaires
To compare the three questionnaires in our study, we considered each questionnaire’s scale, the information gathered by its items, and the general UX concept that is realized by each questionnaire.
System Usability Scale (SUS)
The 10 items of the SUS (Brooke, 1996, 2013) describe classical usability criteria (ease of use, usefulness, perceived complexity, consistency, and ease of learning) through making short statements about the product. Participants can express their disagreement or agreement to these statements on a 5-point response scale.
The 10 items are these:
- I think that I would like to use this system frequently.
- I found the system unnecessarily complex.
- I thought that the system was easy to use.
- I think that I would need the support of a technical person to be able to use this system.
- I found the various functions in this system were well integrated.
- I thought there was too much inconsistency in this system.
- I would imagine that most people would learn to use this system very quickly.
- I found the system very cumbersome to use.
- I felt confident using the system.
- I needed to learn a lot of things before I could get going with this system.
The original publication (Brooke, 1996) describes the SUS as “a quick and dirty usability scale.” However, the SUS is clearly the most currently-used UX questionnaire. There is a large body of research literature dealing with the psychometric properties of the SUS, so it is quite well understood (Lewis & Sauro, 2017; Lewis, 2018).
The SUS provides an overall score between 0 and 100. For half of the SUS (Items 1, 3, 5, 7, and 9), agreement describes a positive evaluation (items with positive polarity). For the other half, disagreement represents a positive evaluation (items with negative polarity). For the items with positive polarity, answers are coded as 0 to 4 from disagreement to agreement; for the items with negative polarity, answers are coded from 4 to 0. Thus, a 4 always represents the most positive evaluation, and a 0 the most negative evaluation. If we sum up these values over the 10 items per participant, we get a value between 0 and 40. This value is multiplied by 2.5 to scale it up to a range between 0 and 100 (the argument for this re-scaling is that a 0-100 range is easier to communicate because of its similarity to a percentage range). The SUS score for a product is then simply the average over all participant scores.
Bangor et al. (2008, 2009) derived an adjective rating of the SUS scores from a large collection of SUS data obtained from several usability studies. Participants rated a product with the SUS and chose the adjective that best describes their overall experience. Then, the authors of these papers calculated the mean SUS scores per adjective (values in brackets show the standard deviation): Best imaginable: 90,9 (13,4), Excellent: 85,5 (10,4), Good: 71,4 (11,6), OK: 50,9 (13,8), Poor: 35,7 (12,6), Awful: 20,3 (11,3), Worst Imaginable: 12,5 (13,1). This association to adjectives helps to interpret single SUS scores.
A more detailed benchmark was described in Lewis and Sauro (2018). This benchmark contains data from 241 industrial usability studies. Depending on the observed SUS score, products are classified into 11 categories (values in brackets show the range of SUS scores associated with this category): A+ (84.1-100), A (80.8-84.0), A- (78.9-80.7), B+ (77.2-78.8), B (74.1-77.1), B- (72.6-74.0), C+ (71.1-72.5), C (65.0-71.0), C- (62.7-64.9), D (51.7-62.6), and F (0-51.6). Each category is described by a grade, the interval of SUS scores related to the category and a percentile of products from the benchmark data set that fall into this category (Lewis & Sauro, 2018).
Usability Metric for User Experience-Lite Version (UMUX-LITE)
Usability Metric for User Experience (UMUX) is a short questionnaire containing just four items (Finstad, 2010). The items are short statements about UX aspects. Participants can express their disagreement or agreement to these statements on a 7-point response scale.
The items are these:
- I have to spend too much time correcting things with this system.
- This system’s capabilities meet my requirements.
- This system is easy to use.
- Using this system is a frustrating experience.
The UMUX-LITE is a short form of the UMUX that contains just the second and third item from the list above. The UX concept behind UMUX and especially UMUX-LITE is similar to the Technology Acceptance Model (Davis, 1986; Davis & Davis, 1989). This model assumes that user acceptance of a new technology is based on its perceived usefulness (Item 2 of the UMUX) and perceived ease of use (Item 3 of the UMUX).
The UMUX-LITE is scored like the SUS. Responses are coded as 0 to 6 from disagreement to agreement, so 0 is the most negative and 6 the most positive evaluation (both items in the UMUX-LITE have positive polarity). The two scores are added up per participant, which results in a score between 0 and 12. This score is then divided by 12 and multiplied by 100 to transfer it to the range 0 to 100. Again, the UMUX-LITE score for a product is then the average overall participant score.
Both UMUX and UMUX-LITE correlate highly with the System Usability Scale (SUS). There have been several attempts to estimate SUS scores from UMUX-LITE scores. A first approach (Lewis et al., 2013, 2015), which uses a regression formula, was later found to be biased for products that showed higher SUS scores (Lah et al., 2020). Other options are to compute the SUS score directly from the ease-of-use question of the UMUX-LITE or using a regression formula based on this ease-of-use question (Lewis & Sauro, 2021c, 2021d).
The UMUX, and especially the UMUX-LITE, provide a high-level measurement of overall UX. They can be used in research situations that only allow presenting a small number of questions to the participants.
A further evolution of the UMUX-LITE is the UX-LITE (Lewis & Sauro, 2021a, 2021b). It uses a 5-point answer scale instead of the 7-point answer scale of the UMUX-LITE and allows alternative formulations for the semantically complex item “This system’s capabilities meet my requirements.” These alternative formulations (for example, “{Product}’s features meet my needs,” in which the real product name is entered for the placeholder) are empirically validated (Lewis & Sauro, 2021b) and have roughly the same psychometric properties as the original item. In addition, UX-LITE contains a method to convert UX-Lite scores to percentiles (which makes use of the existing SUS benchmark).
User Experience Questionnaire—Short Version (UEQ-S)
The User Experience Questionnaire (UEQ) is designed to allow a quick assessment of UX (Laugwitz et al., 2006, 2008) using a number of task-related (pragmatic) and non-task-related (hedonic) UX aspects. It contains 26 items which are grouped into six scales, Attractiveness, Efficiency, Perspicuity, Dependability, Stimulation, and Novelty. The item format is a semantic differential with a 7-point answer scale.
A short version, called UEQ-S, includes just eight items (four from the pragmatic scales Efficiency, Perspicuity, Dependability, and four from the hedonic scales Stimulation and Novelty). UEQ-S is available for scenarios requiring very short completion times. This short version does not allow measuring the six single UEQ scales. It contains only two scales for the pragmatic quality (the first four items in the list below) and hedonic quality (the last four items in the list below), but it provides an overall UX score (Schrepp et al., 2017a).
The UEQ-S has the following items that are scored from -3 (most negative evaluation) to +3 (most positive evaluation).
| obstructive | o o o o o o o | supportive |
| complicated | o o o o o o o | easy |
| inefficient | o o o o o o o | efficient |
| confusing | o o o o o o o | clear |
| boring | o o o o o o o | exciting |
| not interesting | o o o o o o o | interesting |
| conventional | o o o o o o o | inventive |
| usual | o o o o o o o | leading edge |
The UEQ offers a large benchmark data set (Schrepp et al., 2013; Schrepp et al., 2017b) that contains data from 452 studies of different products. The benchmark provides, per scale, a grouping into five categories (Excellent, Good, Above Average, Below Average, and Bad). Each category is linked to a percentile of products from the benchmark data set. If a product falls, according to the benchmark, into the category Excellent, this means it is amongst the 10% of the best products. If it falls into the category Above Average, 25% of the products from the benchmark data set have better results, and 50% have worse results for this scale. The benchmark for the short version was derived from the benchmark of the full version (Hinderks et al., 2018).
Conceptual Differences Between the Three Questionnaires
If we take a closer look at the items of SUS, UMUX-LITE, and UEQ-S, it is evident that they do not only differ in their item format or the way the results are scored. In addition, they cover semantically distinct aspects of UX (Schrepp, 2021).
The items of the SUS relate to the classical facets of usability, which are properties of a system that support or hinder the users in solving their tasks. This aspect is summarized in the single UMUX-LITE item “This system is easy to use,” and it is covered by the four items of the PQ scale of the UEQ-S. Thus, all three questionnaires try to measure the usability or pragmatic quality of a product.
The UMUX-LITE also covers the aspect of usefulness of a system, which is not covered by any of the SUS or UEQ-S items. In contrast, the UEQ-S contains a scale that measures the fun of use (hedonic quality) of a system or product. This aspect is not considered in SUS or UMUX-LITE.
Thus, all three questionnaires realize by the selection of their items a different concept of UX. It is an interesting question how these differences influence the evaluation of products.
Methods
Study Comparing Three Questionnaires
Data for the same product are quite often collected with different UX questionnaires. Doing a rough comparison of results requires some knowledge of the relationship between the user experience data collected with different questionnaires.
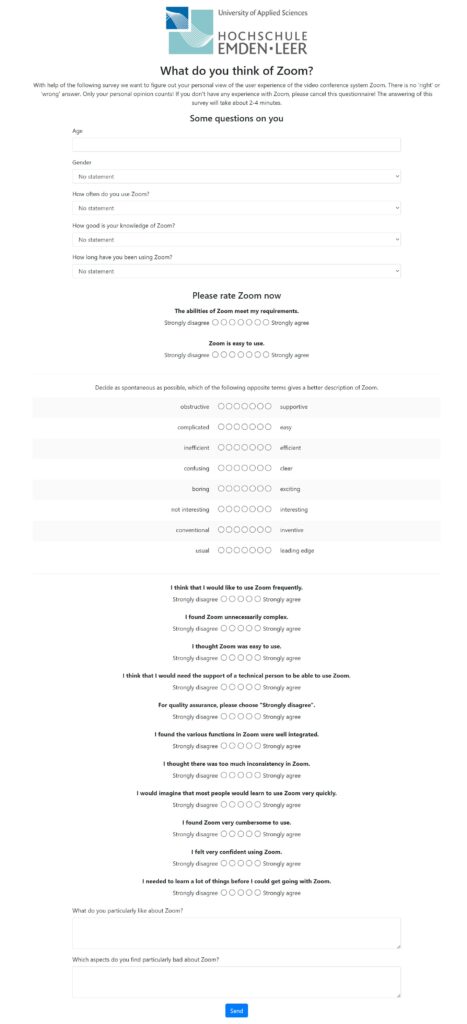
To compare SUS, UMUX-LITE, and UEQ-S, we compiled a survey that contained all items of these questionnaires plus some additional questions on demographics, usage behavior, and comment fields (Appendix 1).
The items of a questionnaire are, of course, interpreted in the context of the evaluated product (Schrepp, 2020; Meiners et al., 2021). Thus, it is not sufficient to compare the results of UX questionnaires just based on a single product. The choice of this product may simply influence the result of the comparison. Therefore, we used four different products in our study. To ensure we could recruit enough participants, we restricted our selection to well-known and often used products Netflix, MS PowerPoint, Zoom, and BigBlueButton. The products were selected to cover different usage scenarios. Netflix is used for fun and leisure. PowerPoint is used in a working context. Zoom is a common video conferencing solution, and BigBlueButton is a teaching conference system used mainly in universities and schools.
Survey Setup
The questionnaire starts with short instructions. Then it captures demographic attributes of the participants and some information about their usage experience with the product. All questions are optional, so there is for each question an additional No answer category.
We asked this:
- Age
- Gender
Male (M), Female (F), Diverse (D), No answer
- Frequency
How often do you use {product name}?
On a daily basis (F1), Several times a week (F2), Several times a month (F3), Not very frequent (F4), No answer
- Experience
How good is your knowledge of {product name}?
Low (E1), Medium (E2), Strong (E3), Excellent (E4), No answer
- Duration
How long have you been using {product name}?
Less than 6 months (D1), 6 months to 5 years (D2), Since more than 5 years (D3), No answer
The identifier in brackets is used to refer to the options below in a short form. For details, see the full questionnaire in Appendix 1.
In addition, the survey contained a question for quality assurance that simply asked the participant to choose a defined answer category. The goal of this question was to filter out participants who did not read the question carefully.
After this block with demographic questions, the two items of the UMUX-LITE are shown, followed by the eight items of the UEQ-S and then the 10 items of the SUS. At the end two comment fields show “What do you particularly like about {product name}?” and “Which aspects do you find particularly bad about {product name}?”
Participant Recruiting
Participants for the studies were recruited between September 2021 and December 2021 over e-mail distribution lists of several universities. The participants received an invitation email which contained a link to an online survey. Overall, 435 responses were submitted.
To improve data quality, we performed a cleanup. Data records with response times that were too short (less than 1 minute), answered the quality assurance question incorrectly, or contained less recorded activities (clicks or navigations by keyboard) were removed. Ninety-seven records were removed because they violated one of these criteria. The data below refer to the data set after cleanup.
Time Required to Fill the Survey
We recorded the time between opening the questionnaire and submitting the data. The required average times in seconds are (standard deviations in parenthesis): Netflix 3 min 49 s (1 min, 57 s), PowerPoint 3 min 50 s (2 min, 32 s), Zoom 4 min 2 s (2 min, 12 s), and BigBlueButton 4 min 32 s (1 min, 56 s).
Demographics and Usage Characteristics
Table 1 shows the distribution of the demographic attributes in the four studies. Only one participant selected the answer option Diverse (nonbinary or gender fluid) for the question concerning gender. Therefore, a statistical analysis of this group was not possible.
Table 1: Overview of Participants, Distribution of Demographics, and Usage
|
Study |
No. |
Gender |
Mean |
Experience |
Frequency |
Duration |
||||||||||
|
M |
F |
N/A |
E1 |
E2 |
E3 |
E4 |
F1 |
F2 |
F3 |
F4 |
D1 |
D2 |
D3 |
|||
|
Netflix |
97 |
53 |
42 |
2 |
30 |
6 |
21 |
52 |
18 |
16 |
37 |
35 |
9 |
2 |
62 |
32 |
|
PPT |
89 |
66 |
23 |
0 |
28 |
8 |
45 |
31 |
5 |
2 |
7 |
28 |
51 |
1 |
9 |
78 |
|
Zoom |
76 |
38 |
36 |
2 |
28 |
15 |
31 |
26 |
4 |
3 |
24 |
25 |
19 |
4 |
67 |
2 |
|
BBB |
76 |
41 |
34 |
1 |
27 |
19 |
34 |
15 |
1 |
1 |
12 |
20 |
32 |
13 |
42 |
0 |
Abbreviations: No. (number of participants), Experience (E1 = Low, E2 = Medium, E3 = Strong, E4 = Excellent), Frequency (F1 = Daily, F2 = Sev. times month, F3 = Sev. times week, F4 = Not very frequent), and Duration (D1= <6 month, D2= 6 month to 5 years, D3 = >5 years).
As we can see, the average age of the participants is similar in all studies. Zoom and BBB have a similar number of males and females. For Netflix and PPT, the number of male participants is much higher than the number of female participants. There are also differences in the distribution of the response options for experience, frequency of use, and duration of use between the different products. This is, of course, no surprise because the products support different use cases and are available on the market for different time periods.
Results
We report first the impact of the demographic factors and the usage characteristics on the results of the questionnaires. Then we analyze the scale means and present the correlations of the scales between the different questionnaires. This article focuses on the main results of the study, but additional analyses are available in a detailed research report (Kollmorgen et. al, 2022).
Impact of Gender
Because demographic attributes and usage experience differ for the four investigated products, we first inspected the impact of gender on the scores of the three questionnaires.
Table 2: Questionnaire Scores Dependent on Gender
|
Questionnaire |
Gender |
Netflix |
PPT |
Zoom |
BBB |
|
UMUX-LITE |
Male |
81.90 |
72.22 |
75.66 |
66.87 |
|
Female |
80.20 |
72.46 |
82.64 |
68.38 |
|
|
SUS |
Male |
84.40 |
69.62 |
73.36 |
69.82 |
|
Female |
81.90 |
73.70 |
82.64 |
70.81 |
|
|
UEQ-S |
Male |
1.08 |
0.20 |
0.73 |
0.26 |
|
Female |
1.00 |
0.41 |
1.07 |
0.58 |
The scale scores use mean value over participant scores. Scores for UMUX-LITE and SUS range from 0 to 100, and UEQ-S scores range from -3 to 3.
Only gender had a significant influence for Zoom on all three questionnaires. Female participants tended to rate Zoom better than male participants (UMUX-LITE: df = 71, t-value = -1.858, p = .034; SUS: df = 71, t-value = -2.484, p = .008; UEQ-S: df = 71, t-value = -1.67, p = .049). For the other products there was no significant influence of gender on the scores.
This finding is consistent with other published results for SUS. A majority of studies investigating the impact of gender on SUS ratings, as summarized in Lewis (2018), found no significant effect of gender on the SUS scores. A similar result is reported for the impact of age.
Impact of Age
To check if the age of participants impacts their UX ratings, we split the participants into three groups based on their age (less than 21 years, 21 to 25 years, and older than 25 years). We performed an ANOVA (analysis of variance) for the product and questionnaire. None of these 12 ANOVAs indicated a significant impact (p < .05) of age on the UX scores as measured by the questionnaires.
But we must note that our samples were quite homogeneous for age. They consist mainly of students or younger persons. Thus, our data are not optimal to detect such an influence, if it exists.
Impact of Frequency of Usage
Table 3: Scale Scores Dependent on Usage Frequency
|
Questionnaire |
Frequency |
Netflix |
PPT |
Zoom |
BBB |
|
UMUX-LITE |
On a daily basis |
80.21 |
83.34 |
88.89 |
83.33 |
|
Several times a week |
83.78 |
82.14 |
83.68 |
75.69 |
|
|
Several times a month |
79.29 |
72.02 |
78.67 |
73.75 |
|
|
Not very frequent |
74.07 |
70.07 |
75.44 |
66.15 |
|
|
SUS |
On a daily basis |
87.50 |
80.00 |
88.33 |
90.00 |
|
Several times a week |
87.16 |
75.36 |
82.92 |
72.50 |
|
|
Several times a month |
79.50 |
71.96 |
77.5 |
73.50 |
|
|
Not very frequent |
70.28 |
69.02 |
72.63 |
70.70 |
|
|
UEQ-S |
On a daily basis |
1.38 |
0.81 |
1.54 |
1.00 |
|
Several times a week |
1.20 |
0.54 |
0.82 |
0.69 |
|
|
Several times a month |
0.95 |
0.26 |
1.08 |
0.62 |
|
|
Not very frequent |
-0.12 |
0.18 |
0.68 |
0.35 |
The more frequently a product is used, the higher UX scored on the questionnaires. This is not unexpected. If a product shows good UX, it will be used more frequently. Conversely, over time frequent users will be the ones with a better impression. Figure 1 shows the SUS scores for the four investigated products dependent on the self-reported usage frequency.
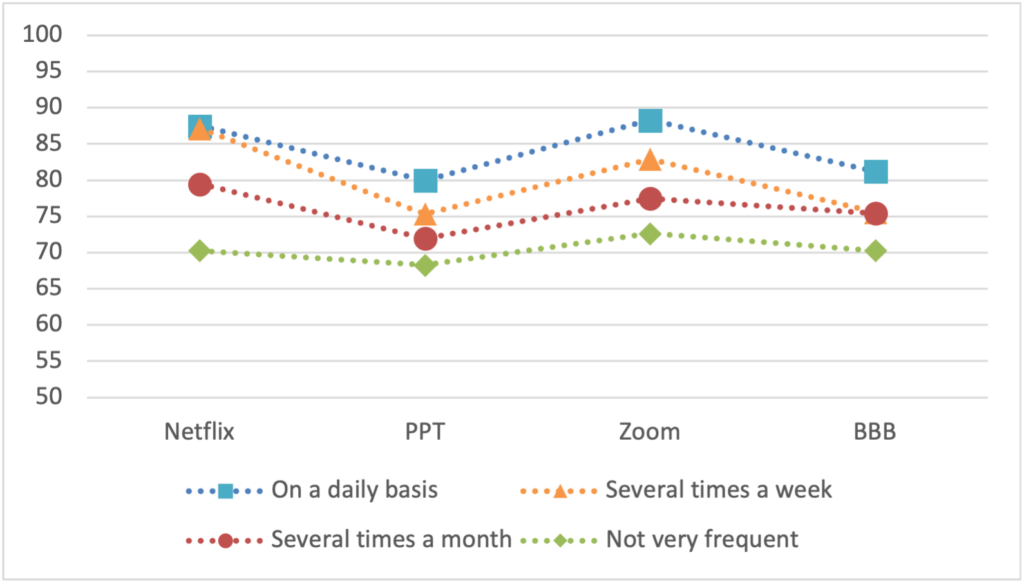
Many of the differences are quite high; the impact on usage frequency on the scale scores leads to meaningful differences. If we, for example, compare the values of the groups for Netflix with the SUS benchmark described above, we see that participants that use it daily or several times a week rate it as a A+, participants that use it several times a month rate it as A-, whereas non-frequent users rate it as C.
An ANOVA shows that the frequency of usage had a significant impact on the SUS scores for Netflix (df = 3, F = 6.352, p = .001) and Zoom(df = 4, F = 3.0, p = .024) on the UMUX-LITE scores for Zoom (df = 4, F = 4.202, p = .004) and BBB(df = 4, F = 2.955, p = .026) and for the UEQ-S score for Netflix (df = 3, F = 5.728, p = .001).
Impact of Experience
There are significant differences in the number of participants in the response categories (Table 1). For example, PowerPoint (PPT) has 79 participants that used it for more than 5 years and only 10 for all the other categories together. Similar distributions are observed for the other products. Due to this suboptimal choice of answer categories, a detailed analysis does not make sense.
Impact of Knowledge
For UMUX-LITE and SUS there is a clear trend that the higher the participant judges his or her own knowledge about the product, the better is the score of the scale. For the UMUX-LITE, an ANOVA showed that, except for Netflix, knowledge had a significant impact on the scores (Zoom: df = 3, F = 4.627, p = .005; PPT: df = 3, F = 3.178, p = .028; BBB: df = 4, F = 7.324, p < .001). For SUS the impact is significant, except for PPT (Zoom: df = 3, F = 3.763, p = .014; BBB: df = 4, F = 4.703, p = .002; Netflix: df = 3, F = 5.156, p = .002). Differences are quite high (the benchmark ratings differ for different groups), so the self-reported level of knowledge leads to substantial differences.
For the UEQ-S, this trend is not as clear. If we look into the two sub-scales PQ and HQ, this is due to the HQ scale. Whereas PQ shows the same pattern as UMUX-LITE and SUS (the higher the self-reported knowledge is, the higher is the score), this is not true for HQ. Pragmatic quality increases with the self-reported level of knowledge, but hedonic quality or fun of use does not. This is not surprising. Of course, building up product knowledge requires spending time using the product and, especially for products that are designed to work on specified tasks, this routine does not improve the impression of the product as original and stimulating.
Table 4: Scale Scores Dependent on Knowledge (Self-Reported)
|
Questionnaire |
Knowledge |
Netflix |
PPT |
Zoom |
BBB |
|
UMUX-LITE |
Low |
75.00 |
66.63 |
67.78 |
61.84 |
|
Medium |
78.97 |
68.15 |
76.61 |
73.04 |
|
|
High |
79.65 |
77.69 |
83.33 |
76.67 |
|
|
Excellent |
87.50 |
86.67 |
95.84 |
83.33 |
|
|
SUS |
Low |
77.08 |
63.12 |
68.33 |
66.32 |
|
Medium |
77.74 |
68.56 |
74.84 |
73.01 |
|
|
High |
82.36 |
74.05 |
82.98 |
77.67 |
|
|
Excellent |
92.36 |
81.00 |
91.25 |
80.00 |
|
|
UEQ-S |
Low |
0.27 |
0.22 |
0.40 |
0.36 |
|
Medium |
0.99 |
0.02 |
0.79 |
0.46 |
|
|
High |
0.97 |
0.56 |
1.10 |
0.67 |
|
|
Excellent |
1.43 |
0.53 |
1.12 |
0.50 |
Scale Scores for the Products
Table 5 shows the scale means for the three questionnaires for all four investigated products.
Table 5: Scale Scores Means and Standard Deviations
| Product | UMUX-LITE | SUS | UEQ-S | PQ | HQ |
|---|---|---|---|---|---|
| Netflix | 80.67 (18.30) | 82.89 (13.21) | 1.02 (1.00) | 1.21 (1.10) | 0.82 (1.20) |
| PPT | 72.28 (18.58) | 70.67 (15.55) | 0.25 (0.89) | 0.98 (1.07) | -0.48 (1.15) |
| Zoom | 77.85 (17.08) | 76.81 (16.86) | 0.84 (0.96) | 1.51 (1.05) | 0.17 (1.11) |
| BBB | 67.54 (22.18) | 70.36 (15.86) | 0.40 (0.85) | 1.09 (1.05) | -0.29 (1.04) |
Standard deviations are shown in parenthesis.
Let us first look at the UEQ-S results (see Figure 2). If we compare the products, we see that Netflix scores best overall (UEQ-S score), followed by Zoom second, BBB third, and PPT last. If we look at the sub-scales, we see that the order differs. For pragmatic quality (PQ), Zoom scores best, Netflix second, BBB third, and PPT last. For hedonic quality (HQ), Netflix clearly is first with Zoom second, BBB third, and again PPT last.
For Netflix, the pragmatic and hedonic quality are nearly the same. For the other three products, the pragmatic quality is always rated higher than the hedonic quality.
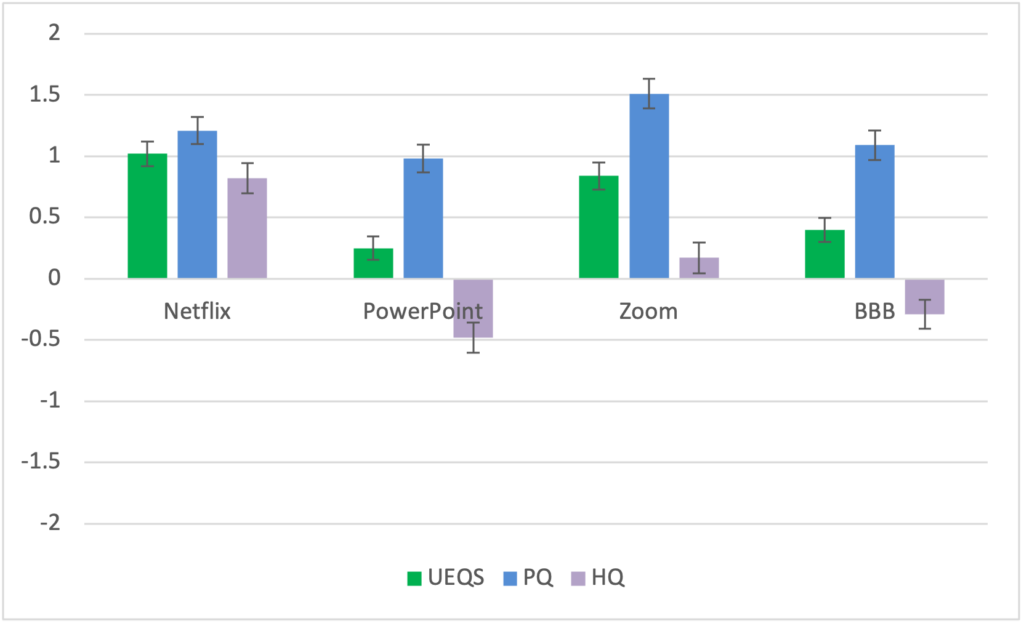
For the UEQ-S, the difference between Netflix and Zoom and the difference between BBB and PPT are not statistically significant. Netflix is significantly better evaluated than PPT (df = 184, t-value = 5.471, p < .001) and BBB (df = 171, t-value = 4.25, p < .001). Zoom is significantly better evaluated than PPT (df = 163, t-value = 4.041, p < .001) and BBB (df = 150, t-value = 2.929, p = .002).
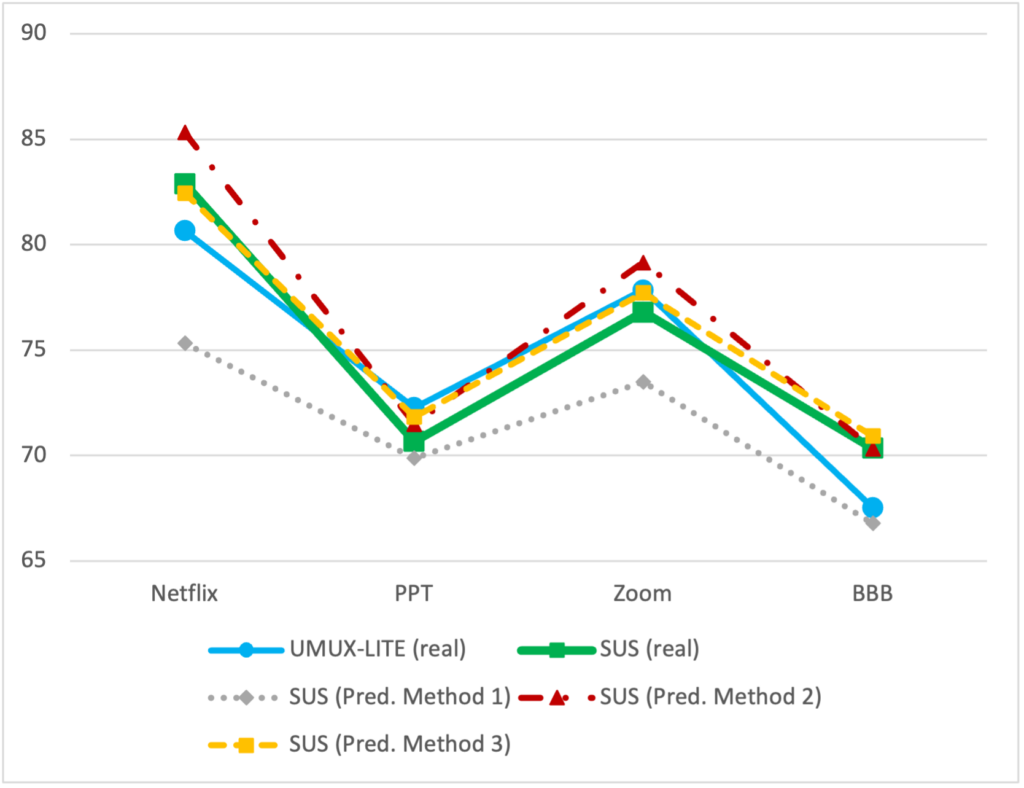
Figure 3 shows the UMUX-LITE and SUS scores.
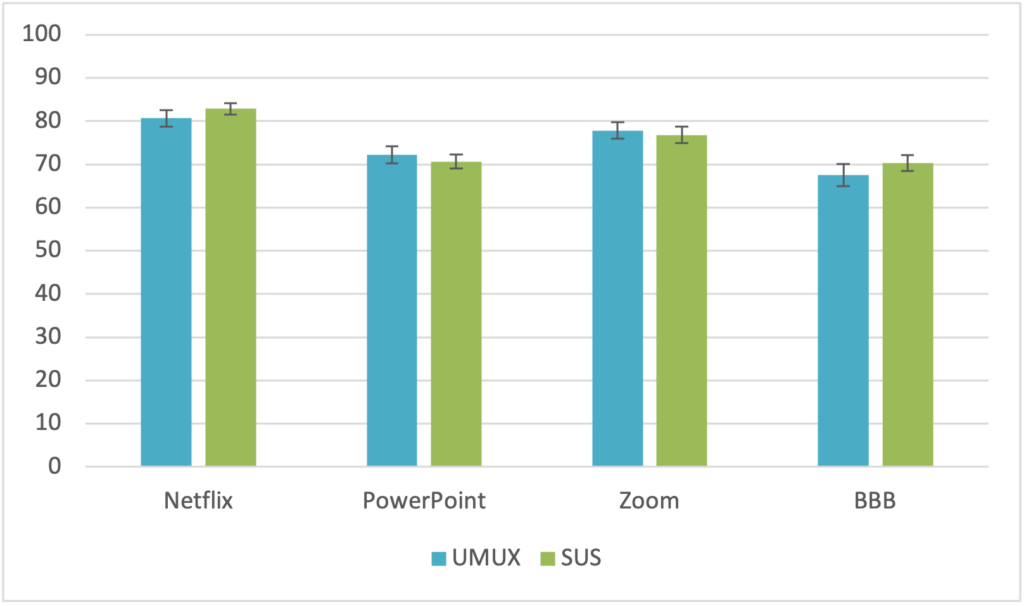
If we look at the differences for UMUX-LITE and SUS evaluation between products, we see that many of them are statistically significant (p < 0.05).
The SUS value for Netflix is significantly better evaluated than Zoom (df = 171, t-value = 2.457, p = .007), PPT (df = 184, t-value = 5.787, p < .001), and BBB (df = 171, t-value = 5.664, p < .001). Zoom is significantly better evaluated than PPT (df = 163, t-value = 2.559, p = .006) and BBB (df = 150, t-value = 2.549, p = .006). The difference between BBB and PPT is not statistically significant (p < .05).
For the UMUX-LITE, the difference between Netflix and Zoom and the difference between BBB and PPT are not statistically significant (p < .05). Netflix is significantly better evaluated than PPT (df = 184, t-value = 3.099, p = .001) and BBB (df = 171, t-value = 4.264, p < .001). Zoom is significantly better evaluated than PPT (df = 163, t-value = 2.096, p = 0.019) and BBB (df = 150, t-value = 3.295, p = .001).
Another observation is that the SUS and UMUX-LITE scores are nearly identical for all four products. This again supports the suggestion in Lewis et al. (2013) that the UMUX-LITE can substitute the SUS in scenarios with a very small number of questions presented to the participants.
There are several estimation methods to predict a SUS score from available UMUX-LITE data. Of course, the pure UMUX-LITE score can be used, as suggested by Lah et al. (2020). Other methods are these: (The abbreviation EoU refers to the ease-of-use question, “This system is easy to use.”)
- Method 1: SUS score = 0.65 * UMUX-LITE score + 22.9 as proposed in Lewis et al. (2013)
- Method 2: SUS score = (EoU – 1) * (100/6) as proposed in Lewis & Sauro (2021c)
- Method 3: SUS score = -2.279 + 19.2 * ((EoU – 1) * (4/6) + 1) based on a regression analysis and proposed also in Lewis & Sauro (2021c)
Note that in Method 1, EoU is included in the score through the ease-of-use question in the UMUX-LITE.
If we apply these formulas to our results, we get the estimations shown in Table 6. The R2 values for the different methods in the last column show that the plain UMUX-LITE score is a much better estimation of the SUS score than the estimation based on the regression formula from Lewis et al. (2013), which is in line with the results in Lah et al. (2020).
Table 6: Estimation of the SUS Score by UMUX-LITE
|
|
Netflix |
PPT |
Zoom |
BBB |
R2 |
|
SUS (real) |
82.89 |
70.67 |
76.81 |
70.36 |
– |
|
UMUX-LITE (real) |
80.67 |
72.28 |
77.85 |
67.54 |
81% |
|
SUS (Pred. Method 1) |
75.34 |
69.88 |
73.50 |
66.80 |
4% |
|
SUS (Pred. Method 2) |
85.33 |
71.50 |
79.17 |
70.33 |
86% |
|
SUS (Pred. Method 3) |
82.46 |
71.83 |
77.72 |
70.94 |
97% |
Overall, the best predictions are obtained by Methods 2 and 3, which only consider the ease-of-use question and not both questions of the UMUX-LITE. From a practical perspective, the estimation based on Method 3 is extremely close to the real SUS score and provides the best overall results, which is in line with results presented by Lewis & Sauro (2021d). But the pure UMUX-LITE score and Method 2 also deliver reasonably good results for all four products.
If we use the results of a questionnaire mainly to compare different products’ UX quality, we see that all three questionnaires come to nearly the same result. Netflix scores best, followed by Zoom, and then PPT and BBB with a lower rating. Thus, if these questionnaires are used to compare products’ UX quality the results are very similar.
All three questionnaires offer benchmarks to support the semantical interpretation of the results. If we look at the SUS benchmark according to Lewis & Sauro (2018), we see that Netflix is classified as A, PowerPoint as C, Zoom as B, and BBB as C. The corresponding classification with the UMUX-LITE is A- for Netflix, C+ for PowerPoint, B+ for Zoom, and C for BBB. Thus, according to SUS and UMUX-LITE, Netflix shows UX quality as very good, Zoom good, and PowerPoint as well as BigBlueButton only mediocre.
For the UEQ-S, we get Above Average for Netflix, Bad for PowerPoint, Below Average for Zoom, and Bad for BBB. Thus, the classification with the UEQ-S is much more negative. The UX quality especially of PowerPoint and BBB is rated quite negative (worst category). If we look at the single values for PQ and HQ, we can see that this is due to a really bad HQ score for those products. The PQ score, pure usability, is rated merely as average, but the rating for the fun of use is quite negative. Since SUS and UMUX-LITE do not capture HQ at all, it is not surprising that the evaluations differ.
Thus, if we simply compare products, the three questionnaires generate nearly the same results. If we rely on their corresponding benchmarks to judge the overall quality compared to other commonly used products, the evaluations clearly differ because the questionnaires measure different UX quality aspects.
Correlations Between the Scales
Figure 5 shows the observed correlations between the scales of the three questionnaires. All correlations were significantly different from 0 (p < .05).
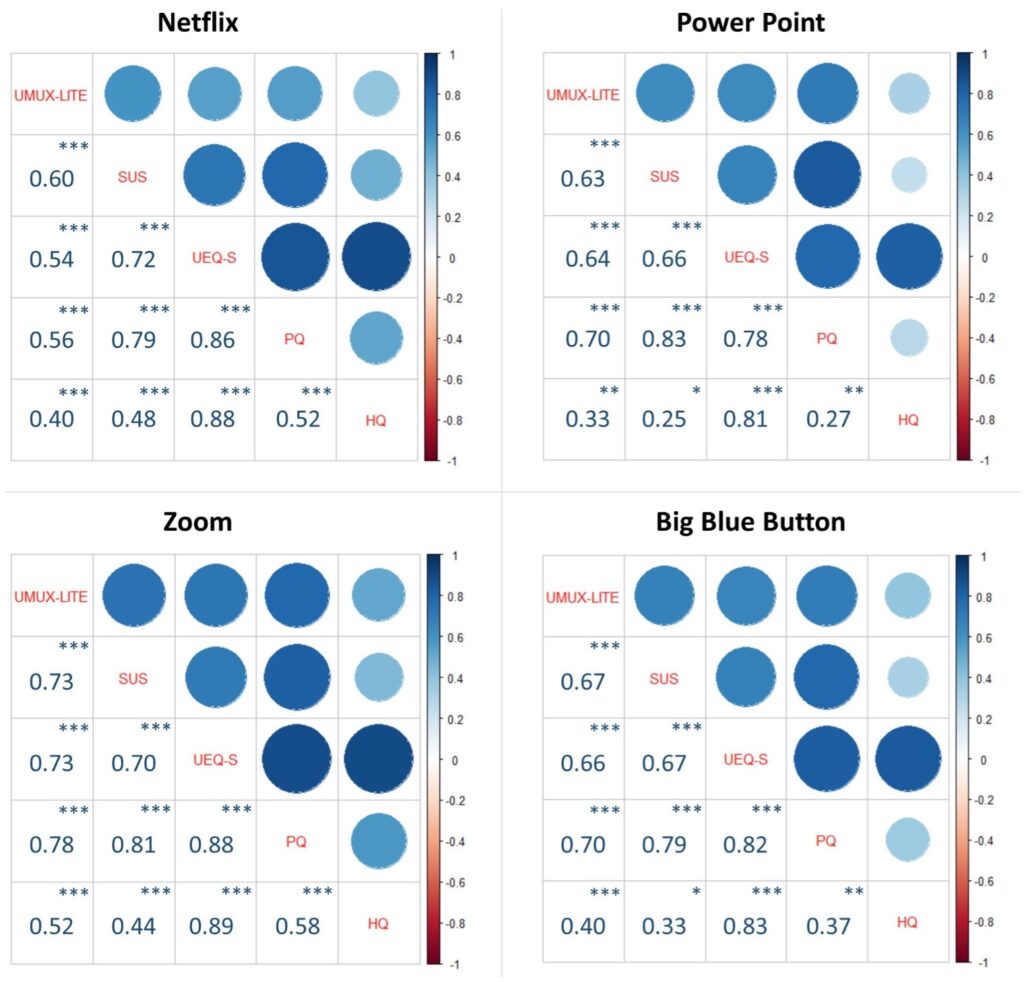
The UMUX-LITE and SUS show all four products have very high correlations between 0.6 and 0.73. SUS shows high correlations to PQ (between 0.79 and 0.83). The correlations between UMUX-LITE and PQ are also quite substantial (between 0.56 and 0.77). This confirms the theoretical assumption that these three scores measure highly similar concepts such as the usability-related UX quality of a product.
The correlations of SUS and UMUX-LITE to HQ are much smaller. Thus, the hedonic quality or fun of use is a distinct concept.
An interesting observation is that the correlation between HQ and PQ varies over products. For PPT, which is used for work and HQ is thus most likely irrelevant for most users, the correlation is relatively low at 0.27. A similar result is observed for BBB, which is used mainly in the context of universities and schools. For Netflix and Zoom, the correlation between PQ and HQ is much higher. Netflix is clearly used for entertainment. Zoom can be used for business meetings but as well for private meetings with friends. Thus, the strength of the correlation between PQ and HQ seems to depend on the importance of hedonic quality for the overall assessment of products. This is in line with the general finding for the importance of UX aspects in different types of products (Winter, et al., 2017; Santoso & Schrepp, 2019).
Conclusion
Our results showed that the SUS and the UMUX-LITE scores are nearly identical for four investigated products, Netflix, PowerPoint (PPT), Zoom, and BigBlueButton (BBB). Thus, the UMUX-LITE can be used to substitute the SUS if only an overall UX quality indicator is required. Although, the 10 detailed questions of the SUS provide more information about potential problems than the two items of the UMUX-LITE. Additionally, the results show that a prediction of the SUS score based on the ease-of-use question of the UMUX-LITE alone provides a better estimation than a prediction based on both UMUX-LITE questions. But from a practical point of view, even a direct estimation of the SUS score by the plain UMUX-LITE score provides reasonable results.
The results also suggest that if we simply want to rank different products for their usability or UX quality, the selection of the survey doesn’t have much impact (Table 5). The results obtained with the SUS and UMUX-LITE place Netflix first, Zoom second, PPT third, and BBB last. The UEQ-S differs only in the order of PPT (last) and BBB (third).
However, if we use the benchmarks delivered with these questionnaires to draw conclusions on the overall quality, there are clear differences between SUS and UMUX-LITE as well as UEQ-S. These differences result from the different UX concepts on which these questionnaires are based. UEQ-S measures pragmatic and hedonic quality and both qualities are equally weighted to provide an overall result. SUS and UMUX-LITE focus strongly on the pragmatic quality. Therefore, for products with a low level of hedonic quality, these evaluations of overall quality differ compared to typical products in the benchmark data set.
The results for SUS, UMUX-LITE, and PQ show very high correlations (Figure 5), thus they all measure a quite similar concept. The correlations to HQ are much smaller.
Another observation is that the correlations of the scales differ between different products. We cannot fully rule out that these are random effects due to the sample size because correlations tend to stabilize only for higher sample sizes (Schönbrodt & Perugini, 2013). But items of questionnaires are always interpreted in the context of the evaluated product. Thus, it is not an unrealistic assumption that small changes in the interpretation of an item that occur from different product contexts can cause such differences. This highlights the importance of always using several products with different usage domains to draw conclusions about the correlation of scales or even the correlations of items inside a scale (Schrepp, 2020).
Additionally, we investigated the impact of demographic variables and information about the usage behavior on the UX scores measured by the three questionnaires (Tables 3 and 4). Age and gender had no real impact on the UX ratings. The higher the usage frequency is, the higher the UX rating. A similar effect is found for the self-reported knowledge of the application. A more detailed finding is that pragmatic quality increases with the self-reported level of knowledge whereas hedonic quality does not increase. But note that these findings cannot be generalized to arbitrary products. Special use cases, product specific design details, or special target groups of users may influence whether such factors have an impact on the UX ratings or not.
There are some limitations of our study that need to be mentioned. We used four mature products that offer an at least average usability based on the benchmarks. It must be checked if the results can be confirmed with products that create a bad usability impression. A second limitation is that our target group consists mainly of students. It should be checked if the results can be replicated with more representative groups of participants. A third limitation is that the order of the UMUX-Lite, UEQ-S, and SUS was not randomized. This was done to separate the UMUX-Lite and the SUS, which both contain very similar “easy to use” items, by moving the block of UEQ-S items between them. However, results reported in Lah et al. (2020) indicate that the impact of such a fixed order on the results is quite small. In two studies reported in Lah et al. (2020), the presentation order of three UX questionnaires (mTam, SUS, and UMUX-Lite) was manipulated in a survey. All possible orders (Latin square design) were realized. But no significant effect of the presentation order of the questionnaires could be found on the results.
Tips for Usability Practitioners
- Different users may have quite different opinions about the UX of a product. This may also be the case for user groups distinguished by demographic factors or usage behavior. In our study, we found a systematic influence of self-reported expertise and frequency of usage on several UX scales. If you measure UX with questionnaires, it may be interesting to capture such data to get deeper insights.
- The selection of an adequate questionnaire is important. Different UX questionnaires set the focus on different semantical aspects of UX. This is even the case for short questionnaires. As we have seen, the SUS, the UMUX-LITE, and the PQ scale of the UEQ-S are highly correlated. A closer look at their items shows that they all set a strong focus on the usability of a product. The UEQ-S considers usability and hedonic quality as equally important for the overall UX. SUS or UMUX-LITE concentrates on usability aspects and does not consider hedonic quality. Thus, these questionnaires measure different semantical concepts.
- If we compare products for their UX quality using these questionnaires, they provide surprisingly similar results. But if we use the benchmarks to draw conclusions on the overall UX quality, things are different. For example, the UEQ-S rated the UX quality of PPT as pretty bad, whereas SUS and UMUX-LITE rated the quality average. This results from the fact that PPT gets quite low ratings for hedonic quality, which is ignored in SUS and UMUX-LITE and therefore does not affect these scales.
- If it is clear which UX aspects are most important for the success of a product, it is easy to choose the questionnaire that best covers these aspects. For example, for a product that is primarily used for professional work, SUS or UMUX-LITE are a good choice because they focus on usability-related UX aspects. For products like Netflix, which are used for fun and leisure, a questionnaire that also considers hedonic aspects, for example the UEQ-S, is a better choice.
- The more items you use, the more information you can capture. Although, the longer the survey is, the more participants abandon it. Because UMUX-LITE provides a very good estimation of a full SUS score, it can replace SUS in research situations that allow very few questions.
References
Bangor, A., Kortum, P. T., & Miller, J. T. (2008). An empirical evaluation of the System Usability Scale. International Journal of Human-Computer Interaction, 24(6), 574–594.
Bangor, A., Kortum, P. T., & Miller, J. T. (2009). Determining what individual SUS scores mean: Adding an adjective rating scale. Journal of Usability Studies, 4(3), 114–123.
Brooke, J. (1996). SUS: A quick and dirty usability scale. Usability Evaluation in Industry, 189(194), 4–7.
Brooke, J. (2013). SUS: A Retrospective. Journal of Usability Studies, 8(2), 29–40.
Davis, F. D. (1986). A technology acceptance model for empirically testing new end-user information systems: Theory and results. [PhD thesis, Massachusetts Institution of Technology]. DSpace@MIT.
Davis, F. D., & Davis, F. (1989). Perceived Usefulness, Perceived Ease of Use, and User Acceptance of Information Technology. MIS Quarterly, 13(3), 319–340.
Finstadt, K. (2010). The Usability Metric for User Experience. Interacting with Computers, 22(5), 323–327.
Hinderks, A., Schrepp, M., & Thomaschewski, J. (2018). A Benchmark for the Short Version of the User Experience Questionnaire. Proceedings of the 14th International Conference on Web Information Systems and Technologies (WEBIST) (pp. 373–377). SciTePress Digital Library (Science and Technology Publications, Lda).
Kollmorgen, J., Schrepp, M., Thomaschewski, J. (2022). A Comparison of three short User Experience Questionnaires [Research protocol]. Research Gate. http://dx.doi.org/10.13140/RG.2.2.32773.01760/1
Lah, U., Lewis, J. R., & Šumak, B. (2020) Perceived Usability and the Modified Technology Acceptance Model. International Journal of Human–Computer Interaction, 36(13), 1216–1230. https://doi.org/10.1080/10447318.2020.1727262
Laugwitz, B., Held, T., & Schrepp, M. (2008). Construction and evaluation of a user experience questionnaire. Symposium of the Austrian HCI and usability engineering group [Symposium] (pp. 63-76). Springer.
Laugwitz, B., Schrepp, M., & Held, T. (2006). Konstruktion eines Fragebogens zur Messung der User Experience von Softwareprodukten [Construction of a questionnaire to measure the user experience of software products]. In A. M. Heinecke & H. Paul (Eds.), Mensch & Computer 2006: Mensch und Computer im StrukturWandel (pp. 125–134). München, Oldenbourg Verlag.
Lewis, J. R. (2018). The system usability scale: past, present, and future. International Journal of Human–Computer Interaction, 34(7), 577–590.
Lewis, J. R., & Sauro, J. (2017). Can I Leave This One Out? The Effect of Dropping an Item From the SUS. Journal of Usability Studies, 13(1), 38–46.
Lewis, J. R., & Sauro, J. (2018). Item benchmarks for the System Usability Scale. Journal of Usability Studies, 13(3), 158–167.
Lewis, J. R., & Sauro, J. (2021a). A Review of Alternates for the UMUX-Lite Usefulness Item. Measuring U. Retrieved May 19, 2022, from https://measuringu.com/UMUX-lite-alternatives-review
Lewis, J. R., & Sauro, J. (2021b). Measuring UX: From the UMUX-Lite to the UX-Lite. Measuring U. Retrieved May 19, 2022, from https://measuringu.com/from-umux-lite-to-ux-lite
Lewis, J. R., & Sauro, J. (2021c). How to Estimate SUS Using the UX-Lite. Measuring U. Retrieved June 19, 2022, from https://measuringu.com/how-to-estimate-sus-with-ux-lite
Lewis, J. R., & Sauro, J. (2021d). Accuracy of Three Ways to Estimate SUS with the UX-Lite. Measuring U. Retrieved June 19, 2022, from https://measuringu.com/accuracy-of-sus-estimation-with-ux-lite
Lewis, J. R., Utesch, B. S., & Maher, D. E. (2013). UMUX-LITE: When there’s no time for the SUS. Proceedings of the SIGCHI Conference on Human Factors in Computing Systems, 2099–2102.
Lewis, J. R., Utesch, B. S., & Maher, D. E. (2015). Investigating the correspondence between UMUX-LITE and SUS scores. In A. Marcus (Ed.), Design, user experience, and usability: design discourse (pp. 204–211). Springer International Publishing.
Meiners, A.-L., Kollmorgen, J., Schrepp, M., & Thomaschewski, J. (2021, September 5-8). Which UX Aspects Are Important for a Software Product? Importance Ratings of UX Aspects for Software Products for Measurement with the UEQ+. In S. Schneegass, B. Pfleging, and D. Kern (Chairs), Mensch und Computer 2021. MuC ’21: Mensch und Computer 2021. Ingolstadt, Germany. http://dx.doi.org/10.1145/3473856.3473997
Santoso, H. B., & Schrepp, M. (2019). The impact of culture and product on the subjective importance of user experience aspects. Heliyon, 5(9).
Schönbrodt, F. D., & Perugini, M. (2013). At what sample size do correlations stabilize? Journal of Research in Personality, 47(5), 609–612.
Schrepp, M. (2020). On the Usage of Cronbach’s Alpha to Measure Reliability of UX Scales. Journal of Usability Studies, 15(4), 247–258.
Schrepp, M. (2021). User Experience Questionnaires: How to use questionnaires to measure the user experience of your products? KDP. https://www.amazon.com/User-Experience-Questionnaires-questionnaires-experience-ebook/dp/B092DP41VM/ref=tmm_kin_swatch_0?_encoding=UTF8&qid=&sr=
Schrepp, M., Hinderks, A., & Thomaschewski, J. (2017a). Design and evaluation of a short version of the user experience questionnaire (UEQ-S). International Journal of Interactive Multimedia and Artificial Intelligence, 4(6), 103–108.
Schrepp, M., Hinderks, A., & Thomaschewski, J. (2017b). Construction of a benchmark for the User Experience Questionnaire (UEQ). International Journal of Interactive Multimedia and Artificial Intelligence, 4(4), 40–44.
Schrepp, M., Olschner, S., & Schubert, U. (2013). User Experience Questionnaire (UEQ) Benchmark. Praxiserfahrungen zur Auswertung und Anwendung von UEQ-Erhebungen im Business-Umfeld. In Brau, H., Lehmann, A., Petrovic, K., & Schroeder, M. C. (Eds.), Proceedings of the Usability Professionals 2013 (pp. 348–353). UPA e.V.
Vicente, P. & Reis, E. (2010). Using questionnaire design to fight nonresponse bias in web surveys. Social Science Computer Review, 28(2), 251–267.
Winter, D., Hinderks, A., Schrepp, M., & Thomaschewski, J. (2017). Welche UX Faktoren sind für mein Produkt wichtig? [Which UX factors are important for my product?] Proceedings of the Usability Professionals 2017 (pp. 191–200). Gesellschaft für Informatik e.V.
Appendix 1